and Empirical Results. Billy M. Williams, M.ASCE1 and Lester A. Hoel, F.ASCE2 ... the keys to optimizing transportation system operations. In the absence of ...
Modeling and Forecasting Vehicular Traffic Flow as a Seasonal ARIMA Process: Theoretical Basis and Empirical Results Billy M. Williams, M.ASCE1 and Lester A. Hoel, F.ASCE2 Abstract: This article presents the theoretical basis for modeling univariate traffic condition data streams as seasonal autoregressive integrated moving average processes. This foundation rests on the Wold decomposition theorem and on the assertion that a one-week lagged first seasonal difference applied to discrete interval traffic condition data will yield a weakly stationary transformation. Moreover, empirical results using actual intelligent transportation system data are presented and found to be consistent with the theoretical hypothesis. Conclusions are given on the implications of these assertions and findings relative to ongoing intelligent transportation systems research, deployment, and operations. DOI: 10.1061/共ASCE兲0733-947X共2003兲129:6共664兲 CE Database subject headings: Traffic flow; Traffic models; Seasonal variations; Data analysis; Traffic management; Intelligent transportation systems.
Introduction Internationally, the transportation focus in developed nations has shifted from the construction of physical system capacity to improving operational efficiency and integration. The infrastructure deployed within this new focus is commonly called intelligent transportation systems 共ITSs兲. Access to information about dynamic system conditions is essential to this effort. Consequently, the final years of the 20th century saw the widespread instrumentation of surface transportation networks in the world’s metropolitan areas, and this effort continues unabated. The data provided by these sensor systems are disseminated to travelers and support modest control systems, such as freeway ramp metering. However, the dynamic system optimization potential inherent in realtime data remains largely untapped. Accurate short-term prediction of system conditions is one of the keys to optimizing transportation system operations. In the absence of explicit forecasts, traveler information and transportation management systems simply react to the currently sensed situation. In essence, this approach assumes that the current conditions provide the best estimate of the near-term conditions. This is obviously a poor general assumption, especially for times when traffic conditions are transitioning into or out of congestion. This need for accurate system forecasts has motivated research efforts in traffic condition prediction 共in most cases, traffic flow 1
Assistant Professor, Dept. of Civil Engineering, North Carolina State Univ., Raleigh, NC 27695-7908. 2 L.A. Lacy Distinguished Professor of Engineering, Dept. of Civil Engineering, Univ. of Virginia, Charlottesville, VA 22904-4742. Note. Discussion open until April 1, 2004. Separate discussions must be submitted for individual papers. To extend the closing date by one month, a written request must be filed with the ASCE Managing Editor. The manuscript for this paper was submitted for review and possible publication on December 3, 2001; approved on September 27, 2002. This paper is part of the Journal of Transportation Engineering, Vol. 129, No. 6, November 1, 2003. ©ASCE, ISSN 0733-947X/2003/6664 – 672/$18.00.
prediction兲. The scope of research has been broad, from systemwide predictions of origin-destination matrices to single-point forecasts of traffic flow. The purpose of this paper is to present a case for acceptance of a specific time series formulation—the seasonal autoregressive moving average process—as the appropriate parametric model for a specific type of ITS forecast: short-term traffic condition forecasts at a fixed location in the network, based only on previous observations at the forecast location. In the balance of the paper, this forecast type will be referred to as the univariate short-term prediction problem. Univariate short-term predictions are, of course, not the only type of traffic condition forecasts that will be needed in nextgeneration ITS. For example, at sufficiently short discrete time intervals, discrete approximations of continuum traffic flow models, such as Daganzo’s lagged cell-transmission model 共Daganzo 1999兲, are promising candidate prediction methods. However, accurate modeling and forecasting of fixed-point traffic data streams are foundational and will provide the primary demand forecasts at uncongested entry points to instrumented systems. Univariate short-term predictions will also continue to be important for forecasting traffic condition data series that are averaged over time intervals with lengths above a certain threshold, say for example 15 min. At longer discrete time intervals, a situation will eventually be reached where it is no longer possible to theoretically establish and model stable correlation with other detection locations within the instrumented network. In such cases, the most accurate forecasts will be univariate predictions even for data locations interior to the network. Williams 共2001兲 provides further discussion and analysis of multivariate traffic condition forecasting approaches.
Short-Term Prediction Problem Fixed-location roadway detection systems commonly provide three basic traffic stream measurements: flow, speed, and lane occupancy. Flow 共alternatively referred to as volume兲 is typically
664 / JOURNAL OF TRANSPORTATION ENGINEERING © ASCE / NOVEMBER/DECEMBER 2003
given as an equivalent flow rate in vehicles per hour. Speed is typically given as the algebraic mean of the observed vehicle speeds 共although the harmonic mean would be more appropriate from a traffic flow theory perspective兲. Lane occupancy is a measure of traffic stream concentration and is the percentage of time that the sensor is detecting vehicle presence, or, in other words, the percentage of time that the sensor is ‘‘on.’’ The base discrete time interval of the traffic condition data series varies from system to system, generally falling in the range of 20 s to 2 min. ITS software systems usually create one or more archivable data series from the base series. These archivable data series are aggregated at longer intervals ranging from 1 min up to a quarter, half, or full hour. Actual data-archiving practices vary widely from system to system. The univariate short-term prediction problem involves generating forecasts for one or more discrete time intervals into the future based only on the previous observations. By way of formal definition, let 兵 V t 其 be a discrete time series of vehicular traffic flow rates at a specific detection station. The univariate short-term traffic flow prediction problem is Vˆ t⫹k ⫽ f 共 V t ,V t⫺1 ,V t⫺2 ,... 兲 ,
k⫽1,2,3,...
(1)
where Vˆ t⫹k is the prediction of V t⫹k computed at time t. The prediction where k⫽1 is the single interval or one-step forecast. Likewise, multiple interval forecasts are those where k⬎1.
Seasonal ARIMA Process Time Series Notation An understanding of time series differencing, time interval backshift, and associated notation is prerequisite to a basic understanding of the seasonal autoregressive integrated moving average 共ARIMA兲 process. Therefore, a brief presentation of these important concepts and conventions follows. Differencing creates a transformed series that consists of the differences between lagged series observations. The single lag difference operator is often denoted by the symbol ⵜ. Using this symbol, the first and second differences for an arbitrary time series 兵 X t 其 can be defined as ⵜX t ⫽X t ⫺X t⫺1
(2a)
ⵜ 2 X t ⫽X t ⫺X t⫺1 ⫺ 共 X t⫺1 ⫺X t⫺2 兲 ⫽X t ⫺2X t⫺1 ⫹X t⫺2 (2b) Differencing with the single lag operator ⵜ is sometimes called ordinary differencing, with the superscript denoting the order of ordinary differencing. Differencing can also be applied at a seasonal lag. In this case, a subscript is employed to specify the length of the seasonal cycle. For example, for a series with a seasonal cycle of 12 intervals, the first seasonal difference would be defined as ⵜ12X t ⫽X t ⫺X t⫺12 . Higher-order seasonal differencing can also be specified by using an integer superscript greater than one in combination with the seasonal cycle subscript. In ARIMA model expressions it is more common to see the backshift operator B used to define the required differencing. The backshift operator is defined by the expression B j X t ⫽X t⫺ j
(3)
Using the backshift operator, the first difference can be written as (1⫺B)X t ⫽X t ⫺X t⫺1 , the second difference as (1⫺B) 2 X t ⫽(1⫺2B⫹B 2 )X t ⫽X t ⫺2X t⫺1 ⫹X t⫺2 , and so on. In general expressions, the superscript d is used to denote the degree of ordinary differencing. In the same manner, seasonal differencing can
be specified by the expression (1⫺B S ) D X t , with S denoting the length of the seasonal cycle and D denoting the order of seasonal differencing.
Seasonal ARIMA Definition A brief presentation of the ARIMA model form is given below. For a more detailed discussion, the reader is referred to a comprehensive time series analysis text, such as Brockwell and Davis 共1996兲 or Fuller 共1996兲. A time series 兵 X t 其 is a seasonal ARIMA ( p,d,q) ( P,D,Q) S process with period S if d and D are nonnegative integers and if the differenced series Y t ⫽(1⫺B) d (1⫺B s ) D X t is a stationary autoregressive moving average 共ARMA兲 process defined by the expression 共 B 兲 ⌽ 共 B s 兲 Y t ⫽ 共 B 兲 ⍜ 共 B s 兲 e t
(4)
where B⫽backshift operator defined by B X t ⫽X t⫺a ; (z)⫽1 ⫺ 1 z⫺¯⫺ p z p ,⌽(z)⫽1⫺⌽ 1 z⫺¯⫺⌽ P z P ; (z)⫽1⫺ 1 z ⫺¯⫺ q z q ,⍜(z)⫽1⫺⍜ 1 z⫺¯⫺⍜ Q z Q ; e t is identically and normally distributed with mean zero, variance 2 ; and cov(e t ,e t⫺k )⫽0᭙k⫽0, that is, 兵 e t 其 ⬃WN(0, 2 ). The parameters p and P represent the nonseasonal and seasonal autoregressive polynomial order, respectively, and the parameters q and Q represent the nonseasonal and seasonal moving average polynomial order, respectively. As discussed above, the parameter d represents the order of normal differencing, and the parameter D represents the order of seasonal differencing. From a practical perspective, fitted seasonal ARIMA models provide linear state transition equations that can be applied recursively to produce single and multiple interval forecasts. Furthermore, seasonal ARIMA models can be readily expressed in state space form, thereby allowing adaptive Kalman filtering techniques to be employed to provide a self-tuning forecast model. a
Theoretical Justification for Seasonal ARIMA The theoretical justification for modeling univariate time series of traffic flow data as seasonal ARIMA processes is founded in the time series theorem known as the Wold decomposition, which applies to discrete-time data series that are stationary about their mean and variance. Therefore it is also necessary to support an assertion that an appropriate seasonal difference will induce stationarity.
Wold Decomposition The Wold decomposition is a fundamental time series analysis theorem, which states that if 兵 X t 其 is a stationary time series, then ⬁
X t⫽
兺 j e t⫺ j ⫹V t
(5)
j⫽0
where 0 ⫽1 and 兺 ⬁j⫽0 2j ⬍⬁; 兵 e t 其 ⬃WN(0, 2 ); 兵 V t 其 and 兵 e t 其 are uncorrelated; e t ⫽limit of linear combinations of X s , s⭐t; and V t is deterministic 共Brockwell and Davis 1996; Fuller 1996兲. In practical terms, Wold’s theorem says that any stationary time series can be decomposed into a deterministic series and a stochastic series. Furthermore, the theorem states that the deterministic part can be exactly represented as a linear combination of past values and that the stochastic part can be represented as a moving average time series via the time-invariant linear filter ⌿ ⫽ 兵 0 , 1 ,... 其 .
JOURNAL OF TRANSPORTATION ENGINEERING © ASCE / NOVEMBER/DECEMBER 2003 / 665
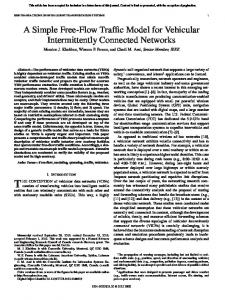
level of traffic flow and the covariance between time-lagged traffic flow observations are strongly time dependent. The first difference of a traffic flow series is also clearly nonstationary. Let 兵 X t 其 be a traffic flow time series and 兵 Y t 其 ⫽ 兵 ⵜX t 其 . Under normal conditions, we can know with a high degree of certainty when peak and off-peak conditions will occur. Consequently, for the time intervals t when traffic volumes are expected to be rising to a peak, the expected value of Y t is greater than zero, or E 关 Y t 兴 ⬎0. Likewise, for the time intervals t when traffic volumes are expected to be falling from a peak, the expected value of Y t is less than zero, or E 关 Y t 兴 ⬍0. However, a one-week seasonal difference intuitively holds the promise of yielding a stationary transformation for traffic condition data series. Traffic condition data in urban areas generally exhibit a characteristic weekly pattern closely tied to work week activities. Weekdays typically involve significant peaking in the morning and the afternoon, and weekend days typically experience lower-level peaks, with a single midday peak in some cases. For example, Fig. 1 shows two typical weeks, each at two freeway locations. The left side of Fig. 1 includes the traffic flow profiles for 2 weeks at a detector location on the outer 共clockwise兲 loop in the southwest quadrant of the M25 orbital motorway around London, and the right side of Fig. 1 includes traffic flow profiles for two weeks at a detector location on northbound Interstate 75 共I-75兲 inside the northwest quadrant of the Interstate 285 共I-285兲 perimeter freeway in Atlanta. Given this stability in weekly traffic flow patterns, it follows that creating a series composed of the differences between traffic condition observations and the observations one-week prior should remove the predominant time dependencies in the mean and variance. Okutani and Stephanedes 共1984兲 previously put forth the assertion that a weekly seasonal difference of traffic condition data will induce stationarity. As stated above, the assertion that a weekly seasonal difference will yield a stationary transformation of discrete time traffic condition data series, coupled with the Wold decomposition theorem, provides theoretical justification for the application of ARIMA models. This theoretical foundation in turn supports the hypothesis that properly fitted seasonal ARIMA models will provide accurate traffic condition forecasts. The next section presents testing of this hypothesis through the empirical evaluation of seasonal ARIMA modeling of several freeway data sets.
Fig. 1. Typical weekly patterns for two freeways
This is in essence identical to the definition of an ARMA process. Therefore, if we can defensibly assume that traffic flow data series can generally be made stationary through seasonal differencing, then the case is made that seasonal ARIMA is an appropriate parametric model.
Time Series Stationarity As touched on above, the Wold decomposition applies to time series that are stationary with respect to mean and variance. Stationarity with respect to mean and variance is referred to as weak stationarity. Stochastic processes such as time series can also be strictly stationary; this more restrictive condition is called strict or strong stationarity. For a stochastic process to be strictly stationary, any two finite samples of the same size must have the same joint distribution function. Strict stationarity is not an important concept in time series analysis, and therefore when a time series is said to be stationary, it is generally understood that this means weakly stationary. By way of formal definition, a time series 兵 X t 其 is said to be weakly stationary 共stationary兲 if the following two conditions hold: 1. Expected value of X t is same for all t; and 2. Covariance between any two observations in series is dependent only on lag between observations 共independent of t). In practice, it is seldom possible to prove or assume strict adherence to these two conditions. However, if the time dependencies in the expected values and covariances are small relative to the nominal level of the series, the series may be close enough to stationarity to be effectively modeled as an ARIMA process. Therefore, sound ARIMA modeling strategy begins with selecting the differencing scheme that will yield the most nearly stationary transformation of the raw series. Untransformed time series of vehicular traffic flow clearly do not meet either of the conditions for stationarity. The expected
Empirical Results Following a brief introduction to the analyzed data sets, the presentation of empirical results focuses first on correlation analysis as a basis for assessing the stationarity of series transformations using a first weekly difference. This is followed by a presentation of the model-fitting results and a discussion of the heuristic benchmarks used to assess the predictive performance of the fitted
Table 1. Descriptive Statistics—M25 Motorway Data Data series 共1996兲 Development September 1–October 18 Test October 19–November 30
Series length 共number of observations兲
Missing values
Percent missing
Series mean 共vph兲
Mean absolute one-step change
4,608
122
2.6
3,112
316
4,128
355
8.6
2,953
299
666 / JOURNAL OF TRANSPORTATION ENGINEERING © ASCE / NOVEMBER/DECEMBER 2003
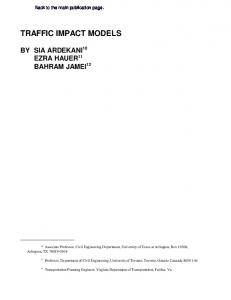
forecasting by researchers at the Institute for Transport Studies at the University of Leeds 共ITS-Leeds兲. M25 has four travel lanes at the location of detector station 4762A. The modeled data represent total 15-min hourly flow rates across all four lanes and cover the period from September 1 through November 30, 1996. Table 1 presents some descriptive statistics on the M25 Motorway data including the number and percentage of missing observations. Fig. 2 illustrates the location of the M25 data.
Fig. 2. M25 data location
seasonal ARIMA models. The results section concludes with an assessment of the model forecast accuracy.
The Data Data from two freeway locations, one in the United States and one in the United Kingdom, are used in this study. In addition to representing different countries, the two data sets involve different freeway types and different detection technologies. As mentioned above in reference to Fig. 1, the U.K. data are from the outer loop in the southwest quadrant of the M25 motorway around London, a location representative of modern major urban circumferential freeways. The U.S. data are from northbound I-75 inside the northwest quadrant of the I-285 perimeter freeway around Atlanta, a location representative of a major urban radial freeway. Traffic condition data on the M25 are gathered by the Highway Agency’s Motorway Incident Detection and Automatic Signaling 共MIDAS兲 system using paired inductive loops. The Atlanta I-75 data are collected by Georgia’s statewide advanced traffic management system, NaviGAtor, using the Autoscope video detection technology. For both data sets, the modeling and forecasting were performed on traffic flow data aggregated at 15-min discrete time intervals, with a portion of the data held out from model estimation for the purpose of model testing and validation. M25 Motorway The Highways Agency provided the data on archival CD-ROM media. The data include traffic condition observations at 1 min discrete intervals. The initial seasonal ARIMA modeling research using these data was performed on detector station 4762A, between the M3 and M23 interchanges, at a 15-min discrete data aggregation 共Williams 1999兲. This was done to allow direct comparison with the results of published and ongoing modeling and
Interstate 75 The Georgia Department of Transportation provided 15-min archived traffic condition data from the NaviGAtor system. Data from detector station 10048 were used in this study. At the location of detector station 10048, northbound I-75 has four regular travel lanes and one high-occupancy vehicle 共HOV兲 lane. The HOV lane is not physically separated from the regular lanes. The modeled data represent average per-lane 15-min hourly flow rates for the four regular travel lanes. Therefore the relative level of the I-75 data differs from the M25 data by a factor of between three and four. The analyzed station 10048 data cover the period from November 1, 1998, through March 23, 1999. Table 2 presents some descriptive statistics on the I-75 data, including the number and percentage of missing observations, and Fig. 3 illustrates the location of the I-75 data.
Correlation Analysis The most common method for assessing whether or not a data series is stationary is to examine the sample autocorrelation function. For stationary series, the sample autocorrelation function exhibits either exponential decay or an abrupt end to significant correlation after a finite number of lags. As discussed above, traffic condition data series are clearly nonstationary. Examination of the weekly patterns exhibited in Fig. 1 leads to an expectation that the autocorrelations will be very strong at 1-day and 1-week lags 共96 and 672 intervals, respectively, for 15-min discrete interval data兲. This expectation is clearly realized in the sample autocorrelation function plots for the development data sets of the two freeway locations 共Fig. 4兲. The autocorrelation peaks occur at even multiples of the 1-day lag of 96 intervals, and the peak correlation rises at the 1-week lag of 672 intervals. It was asserted above that a first seasonal difference at a oneweek lag should induce stationarity for traffic condition data series. This premise can be evaluated by examining the sample autocorrelation plots for the differenced series. The sample autocorrelation functions for the 1-week differenced model development data are plotted in Fig. 5. The M25 plot more clearly demonstrates stationarity than the I-75 plot, but the I-75 development data timeframe includes the weeks of the Thanksgiving, Christmas, and New Year’s holidays. The effect of these weeks on the correlation structure of the development data sample is signifi-
Table 2. Descriptive Statistics—Interstate 75 Data Data series 共1998 –1999兲 Development November 1–January 14 Test January 15–March 23
Series length 共number of observations兲
Missing values
Percent missing
Series mean 共vph兲
Mean absolute one-step change
7,200
987
13.7
1,075
81
6,528
348
5.3
1,169
89
JOURNAL OF TRANSPORTATION ENGINEERING © ASCE / NOVEMBER/DECEMBER 2003 / 667
vealed that ARIMA (1,0,1)(0,1,1) S consistently emerges as the preferred model, based on minimization of the Schwarz Bayesian information criterion 共SBC兲. Although the model estimation procedure generally includes an estimate for a constant term, this term is often not statistically significant and is small relative to the nominal level of the observations. Therefore it is recommended that in most cases the constant term be omitted from the forecast equations. For this study the robust model identification and estimation procedure was further applied to the I-75 station 10048 data, with the results consistent with the previous findings. Table 3 presents the SBC values for the three seasonal models with the lowest SBC values for each data set; and the final parameters derived from the development data sets are presented in Table 4. Fitted ARIMA models can be rearranged into recursive one-step predictors using previous one-step prediction errors to approximate the series innovations. The corresponding prediction equation for the ARIMA (1,0,1)(0,1,1) 672 models is Vˆ t⫹1 ⫽V t⫺671⫹ 1 共 V t ⫺V t⫺672兲 ⫺ 1 共 V t ⫺Vˆ t 兲 ⫺⍜ 1 共 V t⫺671 Fig. 3. I-75 data location
⫺Vˆ t⫺671兲 ⫹ 1 ⍜ 1 共 V t⫺672⫺Vˆ t⫺672兲
(6)
cant. The sample autocorrelation function plot of the 1-week differenced test data, Fig. 6, exhibits a more clearly stationary pattern.
Eq. 共6兲 provides a simple linear recursive estimator. The test data forecasts presented in the next section were calculated by implementing Eq. 共6兲 in Microsoft Excel spreadsheets with the parameters given in Table 4.
Fitted Models
Heuristic Forecasting Benchmarks
The M25 data were used in previous research aimed at investigating the appropriateness of seasonal ARIMA for univariate traffic flow prediction 共Williams 1999兲. This earlier research included development of a robust parameter estimation procedure building on the work of Chen and Liu 共1993a, 1993b兲. Detection and modeling of outliers in traffic condition data are necessary to eliminate model identification errors and parameter estimate bias. Capacity-reducing incidents are the principal cause of outliers in univariate traffic condition data streams. In Williams 共1999兲 and follow-on research 共Smith et al. 2002兲, the joint outlier detection and parameter estimation procedure was applied to several freeway traffic condition data sets, with the final model form selected on the basis of the Schwarz Bayesian information criterion 共Schwarz 1978兲. These modeling efforts re-
Although the purpose of this paper is not to definitively establish the practical viability of widespread use of seasonal ARIMA for ITS traffic condition forecasting, it is nonetheless important to compare the empirical forecasting results to reasonable heuristic forecasting methods. The purpose of this comparison is to assess the likelihood that fitted ARIMA models will provide a statistically significant increase in forecast accuracy sufficient to justify going beyond easy-to-understand heuristic techniques that require little or no customization. The predictive performance of the seasonal ARIMA models presented in this paper is tested against three heuristic forecasting methods: the random walk forecast, the historical average forecast, and a deviation from the historical average forecast.
Fig. 4. Autocorrelation function for undifferenced data 668 / JOURNAL OF TRANSPORTATION ENGINEERING © ASCE / NOVEMBER/DECEMBER 2003
Fig. 5. Autocorrelation function for seasonally differenced data
Random Walk Forecast If we explicitly or implicitly consider that traffic condition data streams can be well modeled as a 2D random walk, then the best forecast for the next observation in the series is simply the most recent observation, that is, Vˆ t⫹1 ⫽V t . This is because if our data series is a random walk we have no expectation of the direction or magnitude of the change from one step to the next. This is obviously not the case with traffic condition data, but changes from one interval to the next are often relatively small, so this approach gives somewhat reasonable predictions in many cases. As touched on in the introduction, traffic management and control actions or decisions made in response to currently sensed conditions carry an implicit assumption that random walk forecasts are reasonable. One way of looking at the random walk forecast is that it is fully informed by the current conditions but completely uninformed by historical patterns. If the modeled process were truly a random walk, there would be no historical patterns, only uncorrelated fluctuations. However, we know, as illustrated by Fig. 1, that traffic condition data follow dependable weekly patterns. This leads to the second heuristic forecasting approach, historical average forecasts. Historical Average Forecast The phenomenon that traffic conditions follow nominally consistent daily and weekly patterns leads to an expectation that historical averages of the conditions at a particular time and day of the week will provide a reasonable forecast of future conditions at the same time of day and day of the week. A straight historical average forecast is the antithesis of the random walk forecast; in the historical average forecast, predictions are informed solely by previously observed patterns, but completely uninformed by the current conditions. A straight historical average prediction method was used in the AUTOGUIDE ATIS demonstration project in London 共Jeffrey et al. 1987兲. However, intuition holds that averaging that applies greater weight to more recent observations would provide consistently better forecasts than straight averages, either of all past observations or of a fixed moving window of past observations. This would allow the historically based estimates to track with the yearly ebb and flow of traffic levels, as well as general long-term traffic level trends. Simple exponential smoothing of traffic condition observations at each time of day and day of week provides a convenient method of computing such a weighted average. Let our traffic condition data series be 兵 V t 其 . If the discrete data interval is 15
min, there will be a lag of 672 intervals between each successive observation at the same time of day and day of week. In this case, the exponentially smoothed forecast would be calculated with smoothing parameter ␣ by the equation Vˆ t⫹672⫽␣V t ⫹ 共 1⫺␣ 兲 Vˆ t
(7)
To be considered a heuristic approach, the smoothing parameter ␣ must be based on expert judgment rather than estimated from representative data. If ␣ is estimated from the data, the result is essentially a fitted ARIMA 共0,1,1兲 model, and each time of day and day of week could have its own smoothing parameter. The smoothing parameter ␣ in general should fall between zero and one. As ␣ approaches zero, the forecast approaches a straight average of past observations, and as ␣ approaches one, the forecast approaches the random walk forecast. Gardner 共1985兲 found that smoothing parameters smaller than 0.3 were usually recommended by practitioners. Intuitively it seems reasonable that the smoothing parameter for traffic condition data should be relatively small because it is desirable for the estimates to follow the modest cycles and trends while not being thrown off by abnormally high or low observations. Therefore, a smoothing parameter ␣ of 0.2 is used for historical average estimation in this study. If the current conditions are normal, historical average forecasts can outperform random walk forecasts, especially during
Fig. 6. Autocorrelation function for seasonally differenced I-75 test data
JOURNAL OF TRANSPORTATION ENGINEERING © ASCE / NOVEMBER/DECEMBER 2003 / 669
Table 3. Fitted Models with Lowest SBC Values ARIMA model
Table 5. Forecast Performance Comparison RMSEP
MAD
MAPE 共%兲
STDEV error
332.22 466.29 400.99 378.89
204.89 288.60 258.00 228.47
8.74 12.53 11.43 9.78
324.68 463.75 400.64 378.92
141.73 180.02 192.63 153.54
75.02 95.05 123.56 81.19
8.97 10.10 12.85 9.54
138.15 205.95 180.01 153.54
SBC Data series/model
M25 models (1,0,1)(0,1,1) 672 (1,0,2)(0,1,1) 672 (2,0,1)(0,1,1) 672 I-75 models (1,0,1)(0,1,1) 672 (3,0,0)(0,1,1) 672 (1,0,2)(0,1,1) 672
58,092 58,100 58,100 146,807 146,811 146,812
times when traffic levels are routinely increasing or decreasing. However, historical average forecasts cannot respond to dynamic conditions that differ from the norm, such as increased traffic levels related to a special event or decreased traffic levels during a general holiday. The final forecasting heuristic seeks to remedy this weakness by combining the dynamic responsiveness of the random walk forecast with the process memory of the historical average forecast. Deviation from Historical Average Forecasts The final heuristic prediction method is a straightforward combination of the random walk and historical average forecasts. In this method, exponentially weighted historical averages are computed for each time of the day and day of the week. To compute the forecast for the next interval, the ratio of the most recent observation to its corresponding historical average is multiplied by the current historical average for the forecast interval. In equation form, let 兵 V t 其 be a 15-min discrete interval traffic data series and 兵 S t 其 be the corresponding series of smoothed historical averages calculated by S t ⫽␣V t ⫹ 共 1⫺␣ 兲 S t⫺672
(8)
The one-step prediction is calculated by Vˆ t⫹1 ⫽
Vt *S S t t⫺671
(9)
Once again, if the smoothing parameter is based on expert judgment rather than derived from the data, this method can be considered a heuristic approach. The underlying assumption is that the most recently observed ratio of existing to historical conditions will persist into the near future. A similar approach is used in the Leitund Information System Berlin 共LISB兲 to forecast link travel time 共Kaysi et al. 1993兲. LISB was a full-scale commercial route-guidance system trial in West Berlin. This system, now referred to as ALI-SCOUT, uses infrared communications to transmit traveler information to the drivers of equipped vehicles. It is worth noting that the deviation from the historical average forecast is quite similar to the seasonal ARIMA (1,0,1) ⫻(0,1,1) 672 model that emerged from systematic time series analysis of the development data sets. The seasonal component of the selected ARIMA model produces exponentially weighted averages at each 15-min time period. Therefore the multiplicative
Table 4. ARIMA (1,0,1)(0,1,1) 672 Model Parameters Data series
1
1
⌰1
M25 station 4762A I-75 station 10048
0.88 0.95
0.54 0.15
0.85 0.85
M25 station 4762A Seasonal ARIMA Random walk Historical average Deviation from historical average I-75 station 10048 Seasonal ARIMA Random walk Historical average Deviation from historical average
model is essentially an ARMA 共1,1兲 model fitted to the deviations from the current smoothed time period averages. The intuition that the ratio of current conditions to historical conditions will persist into the near-term future is supported by the fact that both fitted models have a high estimate for the autoregressive parameter 1 , 0.88 and 0.95, respectively, for M25 and I-75.
Predictive Performance The seasonal ARIMA predictions were compared to the three heuristic approaches described above. The one-step predictions were generated for the second partition of each of the data sets as presented in Table 1 and Table 2. These data were not used in the model identification or parameter estimation phases. Three statistics are used to compare predictive performance: root mean square error of prediction 共RMSEP兲, mean absolute deviation 共MAD兲, and mean absolute percentage error 共MAPE兲. The MAPE statistic is the most useful and illustrative because the nominal level of traffic flow measurements varies by an order of magnitude between the daily peaks and troughs. Furthermore, the MAPE statistic allows for some degree of comparison of general predictive performance among processes that have different nominal levels. For example, the M25 and I-75 data series used in this study differ by a factor that largely results from the fact that the M25 flow rates are aggregate rates across all travel lanes while the I-75 flow rates are average per lane rates. This factor carries over to the RMSEP and MAD statistics but not to the MAPE statistic. Table 5 presents the predictive performance of each forecasting method for the test data sets. In addition to the goodness of fit statistics described in the previous paragraph, Table 5 also includes the standard deviation 共STDEV兲 of each method’s forecast errors. The error standard deviations are provided to give a sense of the one-step forecast confidence intervals. The Table 5 results support the theoretical applicability of seasonal ARIMA for univariate traffic condition modeling and forecasting. The seasonal ARIMA models provide the best forecasts based on all the prediction performance statistics. As expected, the deviation from the historical average heuristic prediction method provided the second best forecast performance. The performance of the random walk and historical average predictions is reversed for the two data sets. As discussed above, the historical average prediction would be expected to achieve its best results during times when traffic levels are closely following normal conditions, and the random walk prediction would be expected to
670 / JOURNAL OF TRANSPORTATION ENGINEERING © ASCE / NOVEMBER/DECEMBER 2003
Table 6. M25 Forecast Performance Comparison to Clark et al.
共1998兲 Model Seasonal ARIMA Kohonen map/ARIMA Random walk
MAD
MAPE 共%兲
384 514 488
8.6 11.5 10.4
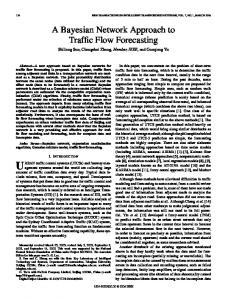
slowly to the lower than normal observations as they persist. Although its immediate adaptation to the observed to historical ratio allows the deviation from the historical average forecast to perform quite well during the period from 8:15 a.m. to 9:45 a.m., this characteristic also results in model instability in the face of rapid shifts. The clearest example of this is the greater than 100% forecast error at 8:00 a.m. caused by the deviation from historical average forecast fully applying the higher than average observation at 7:45 a.m in its one-step prediction.
Comparison to Other Research
Fig. 7. Representative plots of observed and predicted flow rates
outperform the historical average forecasts at times when current traffic levels are exhibiting significant deviation from normal conditions. Therefore, it is likely that close inspection of the test data sets for the two locations would reveal that traffic conditions at the M25 detector station are more closely following normal patterns during the time period of the test data than are traffic conditions at the I-75 detector station. A visual example of the comparative forecast performance is given in Fig. 7. The plots show the observed 15-min traffic volumes from 5:00 a.m. to noon for an arbitrarily selected weekday morning from the test data for each site. The plots also show the corresponding seasonal ARIMA, exponentially weighted historical average, and deviation from the historical average predictions. In the interest of clarity, the random walk forecasts are not shown, but would simply be the observed traffic volumes shifted one 15-min interval to the right. The I-75 plot in Fig. 7 illustrates that the seasonal ARIMA and deviation from historical average forecasts are nearly identical when observed values are tracking closely to historical norms. The M25 plot, on the other hand, shows how the response of the seasonal ARIMA and deviation from historical average forecasts differs when observations go through an extended departure from normal levels. The M25 plot indicates that observations were normal through 7:30 a.m., but the 7:45 a.m. observation was about 1,500 vehicles per hour above normal, and the 8:00 a.m. through 10:45 a.m. observations were approximately 2,000 vehicles per hour below normal. In this extended period of below-normal traffic volumes, the deviation from the historical average forecast tracks well with the observations. This is as expected because the deviation from historical average forecasts assume that each ratio of observed to historical traffic volume will fully persist into the next interval. In contrast, the M25 seasonal ARIMA forecasts continue to give a measure of deference to the historical levels, adapting more
The M25 data set used in this study has been the subject of considerable traffic flow prediction research performed at ITSLeeds 关including Clark et al. 1998 and Chen and Grant-Mueller 共2001兲兴. Clark et al. 共1998兲 presented a layered forecast approach consisting of a Kohonen map neural network used to classify traffic flow data streams into one of four categories, each category in turn having an independent fitted ARIMA forecast model. The Clark et al. 共1998兲 research used the same data location and time frame as the seasonal ARIMA modeling presented in this paper, but forecast performance statistics were presented only for the hours of 6:00 a.m. to 9:00 p.m. on the weekdays of October 25 and 28 to 31, 1996. Table 6 provides a comparison of the seasonal ARIMA forecasts to the Kohonen map/ARIMA forecasts over this same time period, along with the corresponding random walk forecasts. It is noteworthy that the Kohonen map/ARIMA forecasts were outperformed by the random walk forecasts in terms of both MAD and MAPE. Chen and Grant-Mueller 共2001兲 present the findings of further ITS-Leeds research to develop and test a ‘‘sequential learning’’ neural network forecasting approach. The data are the same M25 traffic volumes used in this paper and in the earlier ITS-Leeds research. As with the Kohonen map modeling discussed above, the researchers used the final five weekdays in October 1996 for forecast model testing. However, for the sequential learning neural network effort, the 1-min flows were aggregated into running 15-min averages; in other words, 15-min averages were computed at each 1-min interval rather than only at the quarter-hour points. As a quick comparison, the seasonal ARIMA model presented in this study was applied to the series of running 15-min averages. This process was straightforward in that the series of 1-min running 15-min averages can be treated as 15 interleaved discrete interval time series. No parameter reestimation was done, and therefore the seasonal ARIMA forecasts were computed using parameters estimated only on the original quarter-hour interval development series. From the graphs and discussion in Chen and Grant-Mueller 共2001兲, the best-performing sequential learning neural network achieved a MAPE of approximately 9 to 9.5% for the five test days. The seasonal ARIMA model applied as described above achieved a MAPE of 8.9% over the same period. This is only slightly higher than the 8.6% MAPE for the original 15-min discrete interval series over the same five days. It is likely that the seasonal ARIMA MAPE for the 1-min running 15-min
JOURNAL OF TRANSPORTATION ENGINEERING © ASCE / NOVEMBER/DECEMBER 2003 / 671
average series would improve slightly if the parameters were optimized for running averages in the development data.
Discussion of Findings Experimental analysis of two representative freeway data sets supports the theoretical basis for modeling and forecasting univariate traffic condition data as a seasonal ARIMA process. One-step seasonal ARIMA predictions consistently outperformed heuristic forecast benchmarks. It is necessary to point out that the assertions and findings presented in this paper directly contradict a statement in Kirby et al. 共1997兲, namely that extending simple ARIMA models ‘‘to include seasonal and other effects, in practice... did not have a substantial impact on the results.’’ On the contrary, a first seasonal difference taken at a one-week lag is the key to proper application of ARIMA modeling to time-indexed traffic volumes. The statement in Kirby et al. 共1997兲 may have been the product of the data used in the underlying research. The Williams 共1999兲 research also included the Beaune, France, data used in the Kirby et al. 共1997兲 research, which consist of southbound flows in the peak summer holiday season on the route from Paris to the French Riviera. Traffic flow levels over this period are extremely heavy, deviate significantly from normal weekly patterns, and do not settle down to a consistent weekly pattern. Therefore it is true that the strengths of seasonal ARIMA modeling are not as clearly demonstrated in relation to these data. However, this data set is atypical and not appropriate for supporting general assertions relative to traffic condition forecasting. Furthermore, the theoretical foundation for seasonal ARIMA modeling negates any theoretical motivation to investigate highlevel nonlinear mapping approaches, such as neural networks. This assertion is supported by comparison to actual neural network forecasting results with a common data set.
Recommendations Neural network and nonparametric approaches such as nearestneighbor regression provide a desirable feature in their ability to adapt to or ‘‘learn’’ the process being modeled. This adaptive learning feature would certainly be valuable for advanced traffic management systems by automating the task of maintaining model accuracy. An ideal forecasting method would be plug-andplay with little or no off-line, human intensive model training or retraining necessary. However, the seasonal ARIMA model presented in this paper can be represented in state space form and can therefore be implemented using adaptive Kalman filtering techniques to update the parameter estimates. Follow-on research is needed to develop and test the validity and efficiency of such a seasonal ARIMA-based adaptive Kalman filtering approach. At a minimum, future research on alternate univariate forecast approaches should include comparisons to seasonal ARIMA and heuristic forecasting performance. The ARIMA (1,0,1)(0,1,1) S model provides a simple three-parameter linear recursive estimator. Therefore, an appropriately applied seasonal ARIMA model should be considered the parametric model benchmark for univariate traffic condition forecasting. Likewise, the deviation
from the historical average prediction method described in this paper provides good forecasts and should be considered a key heuristic forecast benchmark.
Acknowledgments The writers would like to acknowledge the support of the Virginia Transportation Research Council, the Virginia Department of Transportation, the Georgia Transportation Institute, the Georgia Department of Transportation, and the Federal Highway Administration through the Mid-Atlantic Universities Transportation Center. The writers would also like to acknowledge the Telematics Division of the United Kingdom Highways Agency for their graciousness in providing the M25 data used in this study.
References Brockwell, P. J., and Davis, R. A. 共1996兲. Introduction to time series and forecasting, Springer, New York. Chen, C., and Liu, L. 共1993a兲. ‘‘Forecasting time series with outliers.’’ J. Forecasting, 12共1兲, 13–36. Chen, C., and Liu, L. 共1993b兲. ‘‘Joint estimation of model parameters and outlier effects in time series.’’ J. Am. Stat. Assoc., 88共421兲, 284 –297. Chen, H., and Grant-Mueller, S. 共2001兲. ‘‘Use of sequential learning for short-term traffic flow forecasting.’’ Transp. Res., Part C: Emerg. Technol., 9共5兲, 319–336. Clark, S. D., Chen, H., and Grant-Muller, S. 共1998兲. ‘‘Artificial neural network and statistical modelling of traffic flows—The best of both worlds.’’ 8th World Congress on Transport Research, Antwerp, Belgium, July 12–17, Pergamon, New York, Paper No. 630. Daganzo, C. F. 共1999兲. ‘‘The lagged cell-transmission model.’’ Proc., 14th Int. Symp. on Transportation and Traffic Theory, A. Ceder, ed., Pergamon, New York, 81–106. Fuller, W. A. 共1996兲. Introduction to statistical time series, 2nd Ed., Wiley, New York. Gardner, E. S., Jr. 共1985兲. ‘‘Exponential smoothing: The state of the art.’’ J. Forecasting, 4共1兲, 1–38. Jeffrey, D. J., Russam, K., and Robertson, D. I. 共1987兲. ‘‘Electronic route guidance by AUTOGUIDE: The research background.’’ Traffic Eng. Control, 28共10兲, 525–529. Kaysi, I., Ben-Akiva, M., and Koutsopoulos, H. 共1993兲. ‘‘Integrated approach to vehicle routing and congestion prediction for real-time driver guidance.’’ Transportation Research Record 1408, Transportation Research Board, National Research Council, Washington, D.C., 66 –74. Kirby, H., Dougherty, M., and Watson, S. 共1997兲. ‘‘Should we use neural networks or statistical models for short term motorway traffic forecasting?’’ Int. J. Forecasting, 13共1兲, 43–50. Okutani, I., and Stephanedes, Y. J. 共1984兲. ‘‘Dynamic prediction of traffic volume through Kalman filtering theory.’’ Transp. Res., Part B: Methodol., 18共1兲, 1–11. Schwarz, G. 共1978兲. ‘‘Estimating the dimension of a model.’’ Ann. Stat., 6共2兲, 461– 464. Smith, B. L., Williams, B. M., and Oswald, R. K. 共2002兲. ‘‘Comparison of parametric and nonparametric models for traffic flow forecasting.’’ Transp. Res., Part C: Emerg. Technol., 10共4兲, 257–321. Williams, B. M. 共1999兲. ‘‘Modeling and forecasting vehicular traffic flow as a seasonal stochastic time series process.’’ PhD dissertation, Univ. of Virginia, Charlottesville, Va. Williams, B. M. 共2001兲. ‘‘Multivariate vehicular traffic flow prediction: Evaluation of ARIMAX modeling.’’ Transportation Research Record 1776, Transportation Research Board, Washington, D.C., 194 –200.
672 / JOURNAL OF TRANSPORTATION ENGINEERING © ASCE / NOVEMBER/DECEMBER 2003