Winthrop Baylies. 2. , Noel Poduje. 3. , and John Valley. 4. 1. Massachusetts Institute of Technology, Cambridge MA;. 2. BayTech Group, Weston MA;. 3.
MRS Spring Meeting, Symposium I: Chemical Mechanical Planarization, San Francisco, CA, April 2002.
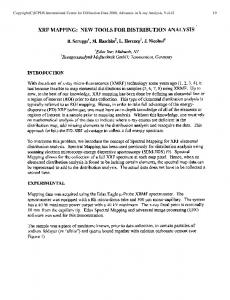
Modeling and Mapping of Nanotopography Interactions with CMP Brian Lee1, Duane S. Boning1, Winthrop Baylies2, Noel Poduje3, and John Valley4 1 Massachusetts Institute of Technology, Cambridge MA; 2BayTech Group, Weston MA; 3 ADE Corporation, Westwood MA; 4ADE Phase-Shift, Tucson AZ Abstract As the demand for planarity increases with advanced IC technologies, nanotopography has arisen as an important concern in shallow trench isolation (STI) chemical mechanical polishing (CMP) processes. Previous work has shown that nanotopography, or small surface height variations on raw wafers 20 to 50 nm in amplitude extending across millimeter scale lateral distances, can result in substantial CMP-induced localized thinning of surface films such as oxides or nitrides used in STI [1]. This interaction with CMP depends both on characteristics of the wafer such as heights and spatial wavelengths of the nanotopography, and characteristics of the CMP process including the planarization length or pad stiffness. In this paper we review and extend the previous work on modeling of nanotopography. Three approaches to predicting the post-CMP oxide thinning due to nanotopography are compared. The first approach is the simplest, where a statistical aggregate effect is computed. Following the work of Schmolke [2], a transfer coefficient α is found which captures the portion of the nanotopography that is correlated with the final oxide thinning. The second approach is the most detailed, depending on explicit numerical simulation of pad elastic properties. In this case, a contact wear simulation is used to produce a detailed map of oxide thickness corresponding to any given pre-measured nanotopography wafer surface. The third approach is a signal processing method, sitting somewhere between the previous two extremes in terms of approximation and complexity. In this last case, a two-dimensional transfer function is extracted which captures the spatial smoothing accomplished by CMP. This filter can then be applied efficiently to premeasured nanotopography maps for other wafers to predict the final oxide thicknesses. We also propose a predictive mapping of post-CMP oxide or nitride thicknesses to provide insight into the relative goodness of a wafer measured for nanotopography which is to be subjected to a CMP process. Specifically, we suggest that for post-CMP impact, maps and computation of areas having insufficient oxide clearing, or having final nitride thickness outside of required ranges, are useful and practical. Such device failure potential maps complement the fundamental nanotopography height map data and metrics based directly on that data, and enable evaluation, comparison, and development of improved wafers and STI CMP processes. I. Background Nanotopography refers to nanometer scale height variations that exist over lateral millimeter wavelengths on unpatterned silicon wafers, as illustrated in Fig. 1. Films deposited on wafers with certain nanotopography types have been shown to exhibit post-CMP film thinning, or localized deviation in the polished film thickness, with the relative length scales of the nanotopography and the CMP process serving as significant factors [3]. Wafer nanotopography effects are larger in single-sided polished wafers where the height variations are largest (~100 nm); these effects are also of concern in double-sided polished wafers but with smaller variation (~30 nm). Wafer nanotopography varies depending on the process used during raw wafer production, and can be characterized by both height and lateral extent of the surface height variation. 1
1000
500
0
−500
−1000 0
50
100 X (mm)
150
200
Figure 1: Top view and cross section of wafer nanotopography.
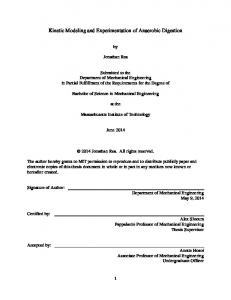
Previous work has shown that substantial film thinning can result from the polishing of films on wafers with certain underlying nanotopography signatures [1,3,4] as illustrated in Fig. 2. The interaction of the CMP process with wafer nanotopography can result in difficulty in clearing surface layers (e.g. oxide over nitride), or in excessive thinning of an underlying polish stop layer (e.g. the nitride under an oxide layer). This film thinning effect is of substantial concern in shallow trench isolation, where nitride thinning can be critical in determining device yield. An accurate method to predict post-CMP film thinning given measured nanotopography would be useful both to predict STI impact and to identify potential problem wafers. II. CMP Transfer Function Forms In general, it is possible to abstract the CMP process as a (potentially nonlinear) transfer function which converts initial wafer nanotopography to final post-CMP film thickness, as shown in Fig. 3. Many possible forms can be used for this transfer function, varying in implementation or computational complexity. Three forms are considered in this paper: linear scaling, filtering, and physical simulation. Two methods on opposite ends of the complexity spectrum will be examined first, followed by a third method of moderate complexity. As a case study, each method will be (a)
(b)
Figure 2: Experimental Data: (a) initial nanotopography (b) post-CMP oxide thickness deviation. 2
Initial Wafer Nanotopography
Scaling
CMP Transfer Function
Final post-CMP Film Thickness Physical Simulation
Filtering
Simple
Complex Figure 3: Forms for the CMP Transfer Function
demonstrated on measured wafer nanotopography data, with the results compared to post-CMP film thickness data. II.1. Scaling The first approach we consider is to approximate the oxide thickness deviation resulting from CMP by a scaled version of the original nanotopography. That is to say, oxide on top of a nanotopography bump will polish more rapidly and thus “thin” compared to the mean polish thickness; the degree of thinning is assumed proportional with factor α to the original nanotopography height (NH) deviation from the mean surface. This approach is based on the proposal by Schmolke [2] that the standard deviation of the post-CMP oxide thickness can be decomposed into a scaled portion due to nanotopography, and a “random” contribution due to oxide deposition and the CMP process. This second component is due to oxide thickness deviation that is uncorrelated with the nanotopography, or OTDUNC. In the corresponding scaling model here, this results in a “point by point” mapping of nanotopography height into oxide thickness deviation, with a random unpredicted offset or error OTDUNC as given by Eq. 1: OTD = OTDUNC + α ⋅ NH (Equation 1) The “model” for any given CMP process is thus determined by extraction of the parameter α from experimental data. Following Schmolke, we compute the following: 〈 OTD ⋅ NH〉 = 〈 [ OTD UNC + α ⋅ NH ] ⋅ [ NH ]〉 = 〈 OTD ⋅ NH〉 + α 〈 NH ⋅ NH〉 2
= 0 + α [ σ NH ] = α [ σ NH ] 〈 OTD ⋅ NH〉 α = ------------------------------2 [ σ NH ]
2
(Equation 2)
where the angled brackets indicate computation of the expectation (or average) of the quantity enclosed over spatial coordinates x and y. The final expression for α in Eq. 2 is computed using initial wafer nanotopography data and final oxide film thickness, and can be extracted separately for each individual wafer using pre-CMP nanotopography maps NH(x,y) and post-CMP oxide thickness deviation maps OTD(x,y). The functional dependence of the α parameter on wafer type and CMP process is unknown; here we estimate it separately for each wafer type (described elsewhere in this paper) and CMP process step combination. The resulting estimator for OTD is 3
given by Eq. 3, where any variation uncorrelated to nanotopography is assumed to be zero mean and is not predicted. OTD est ( x, y ) = α ⋅ NH ( x, y ) (Equation 3) II.2. Physical Simulation via Contact Mechanics The second method for prediction of oxide thinning involves physically based simulation of the CMP process. In this case, we use a contact mechanics model described by Chekina [5] and Yoshida [6]. The concept here is to relate local pressures on the wafer surface to the pad displacement, and use the local pressures to derive removal rates. As the film surface evolves through time, the pad displacement is changed, and thus local pressures and removal rates are modified. The simulation surface is discretized into elements, and a time-stepped algorithm is used to determine the final post-CMP film surface. An illustration of the pad-wafer interaction in the contact wear problem is shown in Fig. 4. The relationship between pad displacement and pad pressure is given by Eq. 4: 2 (1 – ν ) p ( ξ, η ) w ( x, y ) = -------------------- -------------------------------------------------- dξ dη (Equation 4) πE 2 2 A (x – ξ) + (y – η) where w(x,y) is the displacement of the pad at point (x, y) on the wafer surface, p(x,y) is the local pressure of the pad, ν is Poisson’s ratio of the pad, and E is the Young’s modulus of the pad. Yoshida [6] offers a boundary element method that can be used to solve the matrix form of Eq. 4. This is useful for the general case, because in normal situations the pad displacement and pad pressures are not known completely. While the method is effective in accurately computing pressures and displacements, it suffers from long computation time for large simulation domains. Here we use a subset of this method which uses Fast Fourier Transform (FFT) analysis to efficiently compute the pad pressure given the pad displacement. The fundamental assumption we make is that there is full pad-wafer contact everywhere, i.e., w(x,y) is fully specified initially and is also known at all subsequent points in time just prior to computation of the corresponding p(x,y). At each time step, Eq. 4 is then seen to be a convolution of the pressure and an inverse distance function; this convolution becomes a multiplication after Fourier transform. Because the displacement is specified everywhere, the resulting pressure can be fully determined. Oxide thickness deviation is predicted by performing a contact wear simulation to compute the oxide thickness removed, and then mean-centering the resulting data. The key model parameter that can be changed in the simulation is the Young’s modulus E.
∫
p(x,y)
CMP Pad w(x,y)
Wafer Surface Figure 4: Wafer-pad contact diagram. 4
II.3. Filtering The third idea involves implementing a one-step linear filter of the appropriate form and applying it to the initial wafer nanotopography data to approximate the final post-CMP film thickness. Such a filtering approach has been used previously to mimic the effects of a CMP process. Ouma [7] noted that an elliptical weighting filter can be used to evaluate the average or effective pattern density “seen” by a CMP process as it polishes an intentionally patterned wafer. In our application, the original nanotopography data is convolved with a two-dimensional filter and then scaled to obtain the final result. Fast Fourier Transform (FFT) analysis is again used to expedite the computational process. In the contact wear simulation described earlier, the pressure is computed at each time step and the wafer surface advanced. In the direct filtering approach, on the other hand, a single filter is used in one step to predict the final oxide thickness deviation. The filter we use here is a double Gaussian implemented in the frequency domain: H ( ω ) = 2e
ω 2 – k ---------- ω cp
–e
ω 2 – 2k ---------- ω cp
(Equation 5)
with frequency parameters ω cp = ω c ⁄ 1.331 , ω c = 2G ⁄ L c and k = ln ( 2 ) , where Lc is a filter cutoff length, and G is a discretization length. Two key parameters are used to specify this CMP transfer function: the cutoff length Lc which defines the filter width, and a scaling factor s that is used to scale the filtered nanotopography data to produce the final result. III. Experimental Description and Simulation Results Experimental data used here is taken from previously reported studies on nanotopography [1]. The experiment consists of 8 identical sets of 200 mm epi wafers, each set containing wafers with five different nanotopography signatures. Starting wafers have 1 µm of thermal oxide grown on them. Each set of wafers is polished using a different CMP process, where process here denotes a specific combination of tool, consumable set, and process conditions. For the purposes of this analysis, data from three different CMP processes is used. The planarization lengths (as defined in [8]) of these three CMP processes are 3.4 mm for process B, 9.7 mm for process F, and 6.4 mm for Process G. Four wafer nanotopography types are analyzed in this work, with example nanotopography maps as shown in Fig. 5. Three of these are singlesided polish wafers (labeled SSP1, SSP2, and SSP3), and one is a double-sided polish wafer type (labeled DSP1). As seen in Fig. 5, each nanotopography type has a distinct signature. Two wafers from most of these CMP process and nanotopography type combinations are analyzed. Initial nanotopography data (NH) is measured on a NanoMapperTM, filtered with a 20 mm double Gaussian filter to remove long range wafer geometry effects. Oxide thickness deviation (OTD) data is obtained by computations from pre- and post-CMP measurements performed on an AcuMapTM tool. Nanotopography and OTD data is interpolated onto a common grid with spacing of 0.2 mm. The OTD data is then also filtered using a 20 mm double Gaussian filter to remove wafer-scale CMP trends. In addition, the OTD data is shifted and rotated into alignment with the nanotopography data. In the simulation analyses to follow, only the central 100 mm x 100 mm region of the wafer data set is used in order to focus on the effect of nanotopography and exclude any possible effects due to wafer edge proximity.
5
DSP1
SSP1
SSP2
SSP3
Figure 5: Wafer nanotopography signatures used in this experiment
III.1. Scaling Model Results Scaling parameter α was computed for each of the data sets using Eq. 2, based on initial nanotopography data and post-CMP measured oxide thickness. The results are shown in Table 1. The scaling parameter is fairly consistent within replicate wafers for the same wafer type and process combination. Within the same process, however, we note that a variety of different α parameters are extracted for different wafer types. III.2. Contact Wear Model Results Using initial nanotopography data as the input to each contact wear simulation, the optimal value of E is determined by minimizing the root mean square (RMS) error between the final predicted oxide thickness deviation and the actual measured data. The simulated polish time is set such that the average simulated film material removed is approximately equal to the measured average film material removed. Extracted values of E are given in Table 2. We see that E tends to be larger for longer planarization length processes as expected. At medium planarization lengths, the value of E stays within a small range. At the longest planarization length process, the extracted value for E varies substantially from wafer type to wafer type, although it is fairly consistent for the same wafer type and process combination.
6
Table 1: Scaling Model - Extracted Coefficients Process
Planarization Wafer Type Length (mm)
α Wafer 1
Wafer 2
B
3.4
SSP1
0.07
0.08
B
3.4
SSP2
0.10
0.14
B
3.4
SSP3
0.13
0.11
F
9.7
DSP1
0.72
0.73
F
9.7
SSP1
0.84
0.85
F
9.7
SSP2
0.74
0.72
F
9.7
SSP3
0.71
0.69
G
6.4
DSP1
0.38
0.44
G
6.4
SSP1
0.19
0.17
G
6.4
SSP2
0.28
0.27
G
6.4
SSP3
0.27
0.25
Table 2: Contact Wear Model - Extracted Pad Modulus Process
Planarization Length (mm)
Wafer Type
B
3.4
B
E (MPa) Wafer 1
Wafer 2
SSP1
20
25
3.4
SSP2
20
30
B
3.4
SSP3
30
25
F
9.7
DSP1
250
260
F
9.7
SSP1
900
800
F
9.7
SSP2
300
280
F
9.7
SSP3
375
360
G
6.4
DSP1
75
75
G
6.4
SSP1
60
50
G
6.4
SSP2
75
60
G
6.4
SSP3
60
60
III.3. Filtering Model Results Optimal parameters for the filter based CMP model are obtained by modifying the filter cutoff length and scaling factor simultaneously to minimize the RMS error between the predicted oxide thickness deviation and the actual measured data. The extracted parameters are shown in Table 3. The extracted cutoff lengths are fairly consistent within processes. The extremely long cutoff lengths for process F (in many cases equal to the size of the simulation domain) indicates that the best approximation for this process may simply be a scaling, since filtering with such a large cutoff length will return the original data. In such cases, we also note that the scaling coefficient s is equal or extremely close to the scaling parameter α for the corresponding wafers in Table 1.
7
Table 3: Filter Model - Extracted Parameters Process
Planarization Length (mm)
Wafer Type
B
3.4
B
Lc (mm)
s
Wafer 1
Wafer 2
Wafer 1
Wafer 2
SSP1
8
9
0.45
0.42
3.4
SSP2
12
9
0.20
0.35
B
3.4
SSP3
7
100
0.48
0.10
F
9.7
DSP1
100
100
0.72
0.73
F
9.7
SSP1
92
100
0.85
0.87
F
9.7
SSP2
100
100
0.74
0.72
F
9.7
SSP3
100
61
0.71
0.71
G
6.4
DSP1
11
11
0.66
0.66
G
6.4
SSP1
18
16
0.43
0.44
G
6.4
SSP2
14
14
0.48
0.46
G
6.4
SSP3
12
13
0.56
0.51
III.4. Model Comparison To compare the results from each of the three proposed predictive methods, the RMS error between the model predictions and the measured oxide thickness deviation data is computed and the results summarized in Table 4. The RMS error of each of the prediction methods is less than the standard deviation of the measured oxide thickness deviation, indicating that the methods used capture at least some degree of relationship between nanotopography and OTD. It should be noted that there may be a 1-2 nm random post-CMP oxide thickness deviation (similar to OTDUNC) that establishes a “noise flow” for all CMP nanotopography models. The RMS error is slightly smaller for the filtering method than for the simple scaling method, except for the long planarization length process (F), where it is essentially equivalent. As previously noted, the extremely long extracted filter cutoff lengths for process F indicate that the filtering approach can offer no additional improvement over a simple scaling method. The contact wear method accuracy relative to that of the filtering method varies depending on the process. For process F, the contact wear does slightly worse than filtering in terms of RMS error. The contact wear and filtering methods appear to perform comparably for processes B and G. This suggests that the filtering approximation may be adequate and appropriate in cases where thinning of a single bulk film is to be predicted. On the other hand, the contact wear model can also be applied to more complicated CMP situations, such as the polishing of a film stack where more than one material (with different polish rates) may be undergoing CMP simultaneously, as considered in the next section. Fig. 6 shows a cross-section comparison of the predictions of the three oxide thickness deviation modeling methods, as well as the initial nanotopography data that they are generated from, for one example wafer/process combination (process B, wafer type SSP2, wafer 1). IV. Nanotopography CMP Modeling - Application The key motivation behind development of an accurate CMP modeling methodology is to identify potential yield problems in STI CMP. Two key problems can occur. First, if the polish is stopped with insufficient polish, some areas in nanotopography depressions will fail to 8
Table 4: RMS Error Comparisons Wafer Data Process
PL (mm)
Wafer Type
B
3.4
B
Prediction RMS Error (nm) σOTD (nm)
Scaling
Filtering
Contact Wear
Wafer 1
Wafer 2
Wafer 1
Wafer 2
Wafer 1
Wafer 2
Wafer 1
Wafer 2
SSP1
1.20
1.70
1.18
1.67
1.13
1.65
1.15
1.65
3.4
SSP2
1.87
3.62
1.27
2.30
1.16
1.57
1.13
1.67
B
3.4
SSP3
1.16
1.08
1.08
1.00
1.00
1.01
1.01
0.94
F
9.7
DSP1
3.51
3.21
1.91
1.95
1.91
1.96
1.98
2.04
F
9.7
SSP1
3.42
3.38
1.98
1.39
1.98
1.40
2.04
1.44
F
9.7
SSP2
13.12
11.11
2.17
2.00
2.18
2.01
2.79
2.64
F
9.7
SSP3
2.82
2.90
1.49
1.45
1.49
1.43
1.58
1.55
G
6.4
DSP1
2.01
1.70
1.23
1.03
0.90
0.82
0.97
0.88
G
6.4
SSP1
1.05
1.04
0.81
0.85
0.77
0.81
0.74
0.79
G
6.4
SSP2
5.12
4.30
2.11
2.01
1.50
1.42
1.47
1.45
G
6.4
SSP3
1.38
1.36
0.94
0.96
0.83
0.90
0.84
0.87
completely “clear” (completely remove overlying oxide). Second, if additional overpolish time is used to ensure that all of the oxide film does clear, then excessive thinning of the underlying nitride is a concern. A critical issue is whether or not an incoming wafer with particular nanotopography will give rise to potential device failure. While specifying nanotopography metric limits on incoming wafers is required, it is also useful to analyze predicted film clearing or film thinning problem locations as a function of CMP process and wafer type, as these are important causes of device failure. We thus suggest that, in addition to the fundamental measured nanotopography data, predicted maps of oxide or nitride removed during CMP are useful to identify potential device failures. An example of this methodology to identify oxide clearing failure locations, using measured nanotopography data and a contact wear prediction, is shown in Fig. 7. The methodology is also applied to identify excess nitride loss locations, assuming a 200 Å nitride loss budget, as shown in Fig. 8. V. Conclusions We have suggested three modeling methods for analyzing the effect of nanotopography on post-CMP film thickness deviation. We have compared the prediction errors between the three methods, and find that either contact wear or a single-step filter approximation give equivalent or better prediction results than a simple scaling model across a range of nanotopography wafer types and CMP processes. While the single step CMP filter model approach produces good results when only a single material polish is considered (e.g. oxide thinning), it is unclear how this approach should be applied to predict nitride thinning in the polish of an oxide over nitride STI stack. For prediction of nitride thinning in STI CMP, the contact wear model can be applied. As nitride loss budgets in STI CMP decrease with future technologies, the effect of nanotopography on the thinning of the nitride will become more important. Accurate modeling of film thinning due to nanotopography is essential for determining the impact of nanotopography on device yield. 9
Initial Nanotopography Deviation (Å)
500 0 −500 0
50
100
150
200
X (mm) Post-CMP Oxide Removed (Mean Centered) Deviation (Å)
50 0 −50 0
50
100
150
200
X (mm)
Model Simulations 50
Scaling
0 −50
Contact Wear
Deviation (Å)
0
50
100
150
200
50
100
150
200
50
100
150
200
50 0 −50 0 50
Filter
0 −50 0
X (mm) Figure 6: Comparison of the predictions of the three CMP modeling methods
10
Initial Nanotopography
CMP Model
Oxide Clearing Failure Map dark spots indicate potential device failure due to failure to fully clear oxide over nitride Figure 7: Using nanotopography CMP model to identify potential device failures due to lack of clearing of overlying oxide film.
Nitride Thinning
Initial Nanotopography
CMP Model
Nitride Budget Assume 200 Å nitride loss budget
dark spots indicate potential device failure due to excessive nitride loss Excess Nitride Thinning Failure Map Figure 8: Using nanotopography CMP model to assess potential device failure in STI due to excessive thinning of underlying nitride. 11
References 1. B. Lee, D. S. Boning, W. Baylies, N. Poduje, P. Hester, Y. Xia, J. Valley, C. Koliopoulos, D. Hetherington, H. Sun, and M. Lacy, “Wafer Nanotopography Effects on CMP: Experimental Validation of Modeling Methods,” MRS Spring Meeting, Apr. 2001. 2. R. Schmolke, R. Deters, P. Thieme, R. Pech, H. Schwenk, and G. Diakourakis, “On the Impact of Nanotopography of Silicon Wafers on Post-Chemical Mechanical Polished Oxide Layers,” J. Electrochem. Soc., vol. 149, no.4, pp. G257-G265, 2002. 3. B. Lee, T. Gan, D. S. Boning, P. Hester, N. Poduje, and W. Baylies, “Nanotopography Effects on Chemical Mechanical Polishing for Shallow Trench Isolation,” Advanced Semiconductor Manufacturing Conference, Sept. 2000. 4. S. Xu, “Effects of Silicon Front Surface Topography on Silicon Oxide Chemical Mechanical Planarization,” Electrochem. and Sol. State Lett., vol. 1, no. 4, pp. 181-182, 1998. 5. O. G. Chekina and L. M. Keer, “Wear-Contact Problems and Modeling of Chemical Mechanical Polishing,” J. Electrochem. Soc., vol. 145, no. 6, pp. 2100-2106, June 1998. 6. T. Yoshida, “Three-Dimensional Chemical Mechanical Polishing Process Model by BEM,” Proc. ECS Conf., Oct. 1999. 7. D. Ouma, Modeling of Chemical Mechanical Polishing for Dielectric Planarization, Ph.D. Thesis, MIT, Nov. 1998. 8. D. Ouma, D. Boning, J. Chung, G. Shinn, L. Olsen, and J. Clark, “An Integrated Characterization and Modeling Methodology for CMP Dielectric Planarization,” International Interconnect Technology Conference, San Francisco, CA, June 1998.
12