plane de ned by the solar and the anti-solar meridian. ... the e-vector response insensitive to uctuations of light intensity. There are .... A di erent sensory modality.
Modeling Ant Navigation with an Autonomous Agent Ralf Moller?, Dimitrios Lambrinos?, Rolf Pfeifer? Thomas Labhart?? , Rudiger Wehner??
?
Department of Computer Science, University of Zurich Winterthurerstr. 190, 8057 Zurich, Switzerland (moeller,lambri,pfeifer)@i .unizh.ch
Department of Zoology, University of Zurich Winterthurerstr. 190, 8057 Zurich, Switzerland
??
(labhart,rwehner)@zool.unizh.ch
Abstract
The ability to navigate in a complex environment is crucial for both animals and robots. Many animals use a combination of strategies to return to signi cant locations in their environment. For example, the desert ant Cataglyphis is able to explore its desert habitat for hundreds of meters while foraging and return back to its nest precisely and on a straight line. The three main strategies that Cataglyphis is using to accomplish this task are path integration, visual piloting and systematic search (Wehner et al., 1996). In this study, we use the autonomous agents approach (Pfeifer, 1996) to gain additional insights into the navigation behavior of Cataglyphis. Inspired by the insect's navigation system we have constructed mechanisms for path integration and visual piloting that were successfully employed on the mobile robot Sahabot 2. The results of the navigation experiments indicate that a combination of these two mechanisms is capable to guide the agent precisely back to the target position.
1. Introduction
Bees and ants perform impressive navigation tasks in spite of their tiny (< 1mm3) brains. For example, desert ants Cataglyphis individually perform foraging excursions that take them up to 200 m away from their nest. On nding a suitable prey, they return home unfailingly and in a straight line (Wehner, 1987). More than two decades of eld work (starting 1969, for a review see (Wehner, 1997)) have unraveled a lot of details about the behavioral repertoire that Cataglyphis employs when homing. The three main strategies used are path integration, visual piloting and systematic search (Wehner et al., 1996). Whereas in path integration compass information is primarily gained from the polarization pattern of the sky, geocentered information based on landmarks is also used in order to nally pinpoint its nest. Although there is a large number of behavioral data about the navigation behavior of Cataglyphis , and some mechanisms of peripheral signal processing have been unravelled, it is still largely unknown how the navigation
system is implemented in the insect's nervous system. In this paper we use the autonomous agents approach to gain additional insights into the navigation behavior of insects. The goal of this approach is to develop an understanding of natural systems by building a robot that mimics some aspects of their behavior. The advantages of proceeding in this way are illustrated in our recent studies, in which an autonomous agent navigated by using directional information from skylight. A polarized light compass was developed that was based on neurophysiological evidence about the insect's neuronal circuit (Lambrinos et al., 1997). In the current study we went one step further. First, we developed a path-integration system employing a polarized light compass. Second, based on biological evidence we implemented a landmark navigation system. Both systems were tested with robotic experiments.
2. Path integration Central-place foragers such as bees and ants return to important places in their environment by primarily employing path integration, i.e., by means of a home vector that they continuously update by integrating all angles steered and all distances covered. To use this navigation mechanism, both distance information, but even more important, directional information must be available. Compass direction is gained from celestial cues, primarily from the polarization pattern of the blue sky (reviewed in (Wehner, 1994)).
2.1 Polarization vision in insects
Whereas in unpolarized light the e-vector oscillation occurs equally in all planes, in plane-polarized light there is a bias in favor of a certain oscillation plane (direction of polarization). Polarization in the sky occurs when the sunlight is scattered by atmospheric molecules. The degree of polarization is greatest for light scattered at an angle of 90� to the sunlight rays. The directions of polarization (e-vectors) form a regular pattern across the
Proc. SAB'98, in press POL sensors Blue-filter Polarizer
1
2
photodiode
photodiode
normalized response
2
1
1
2
0 0
90 e-vector (degrees)
1
Log ratio amplifier
normalized response
log2 - log1
0
log2 - log1 -1 0
90 e-vector (degrees)
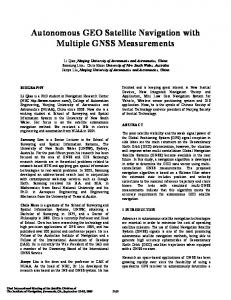
Figure 1 The pattern of skylight polarization in the sky as experienced by an observer in the center of the celestial hemisphere (C). Polarization in the sky occurs when the sunlight is scattered by atmospheric molecules. The directions of polarization (e-vector directions) form a regular pattern which is characterized by a symmetry plane formed by the solar (SM) and the anti-solar meridian (ASM). The solar meridian is the perpendicular from the zenith (Z) through the sun (S) down to the horizon. e-vector directions and degree of polarization are indicated by the orientation and the width of the black bars. In this gure, the solar elevation is 53� (from (Wehner, 1982)).
entire celestial hemisphere ( gure 1). The pattern of polarization has a mirror symmetry with respect to the plane de ned by the solar and the anti-solar meridian. Due to the daily westward movement of the sun across the sky (by some 15� per hour), the symmetry plane, and with it the whole e-vector pattern, rotates about the zenith but retains two very important characteristics: its mirror symmetry, and the property that along the symmetry line the e-vectors are always perpendicular to the solar meridian. Although the polarization pattern of the sky is invisible to humans, many insects exploit it by using the e-vector directions as a reference for compass orientation. Insects have compound eyes consisting of many ommatidia. Polarization vision is mediated by only a small group of specialized, upward-directed ommatidia situated at the dorsal rim of the eye (POL-area). Each ommatidium contains two sets of polarizationsensitive photoreceptors, which are tuned to orthogonal e-vectors (crossed-analyzer arrangement); for a review see (Wehner, 1994). In insects, polarization-sensitive neurons (POLneurons) have been found in two di�erent neural centers, the medulla of the visual lobes (crickets: (Labhart, 1988)) and the central body (locusts: (Vitzthum, 1997)). The medullar neurons receive input from photoreceptors of the POL-area. The activity of these neurons is a sinusoidal function of e-vector orientation with an excitatory and an inhibitory part and with the maxima and min-
Figure 2 Diagrammatic description of a polarization-opponent unit (POL-OP unit). A POL-OP unit consists of a pair of POL-sensors and a log-ratio ampli er. The log-ratio ampli er receives input from the two POL-sensors and delivers the difference of their logarithmized signals. The e-vector responses of the POL-sensors (1, 2) follow a cos2 -function. Ordinates: normalized response, abscissa: e-vector direction.
ima separated by 90�, indicating that they receive antagonistic input from two polarization-sensitive channels with orthogonal e-vector tuning orientations. The advantages of such a crossed-analyzer con guration is that it enhances e-vector contrast sensitivity and that it makes the e-vector response insensitive to uctuations of light intensity. There are three types of cricket POL-neurons that are tuned to di�erent e-vector orientations, i.e., approximately 10�, 60� and 130� with respect to the body axis.
2.2 Polarization vision in a robot
Recent studies have shown that a polarized light compass implemented in analog hardware provides superior means for extracting compass information as compared to traditional methods based on other sources of directional information such as proprioception (Lambrinos et al., 1997). The basic component of the POL-compass are polarization opponent units (POL-OP units) that are functionally similar to the POL-neurons found in insects. Each POL-OP unit consists of a pair of polarized light sensors (POL-sensors) followed by a log-ratio ampli er (see gure 2). The POL-sensors are photodiodes with a linear polarizer and a blue transmitting lter on top. In each POL-OP unit the polarizing axis of one POL-sensor was adjusted 90� to the polarizing axis of the other sensor, thus mimicking the crossed-analyzer con guration in the POL-area of insect eyes. The signals of each pair of POL-sensors were fed into a log-ratio ampli er. Three pairs of POL-sensors were mounted on our mobile robot Sahabot 2 (see gures 3 and 4 (center)) and adjusted such that the polarizing axis of the positive channel was 0�, 60� and 120� with respect to the robot's body axis. The visual elds of the POL-OP units were about 60�
Proc. SAB'98, in press
3 POLOP 1 POLOP 2 POLOP 3
1000
POL−OP unit output
800
600
400
200
0
Figure 3 The mobile robot Sahabot 2.
Figure 4 Left: Detailed view of the 360� camera system of the robot consisting of a camera with vertical optical axis (within the case) and a conical mirror aligned with the axis of the camera and mounted within an acrylic glass tube (top). Axial alignment and distance between mirror and camera can be adjusted. An infrared and a neutral density lter are mounted between camera and mirror. Center: Three pairs of POL-OP units were mounted on the rear part of the robot. They were tuned to 0� , 60� and 120� e-vector directions with respect to the robot's body axis. Right: One of the two ambient light sensor arrays at the sides of the robot.
and were centered around the zenith. The output of a POL sensor is described by the following equation: s(�) = KI (1 + d cos(2� ? 2�max )): (1) I is the total intensity I = Imax + Imin , with Imax , Imin being the maximum and the minimum intensity, respectively. d is the degree of polarization, �max is the value of � that maximizes s (tuned e-vector direction), and K is a constant (Bernard and Wehner, 1977). The outputs of the POL-OP units are described by: � 1 + d cos(2�) � p1 (�) = log 1 ? d cos(2�)
0
90
180 270 Robot orientation in degrees
360
Figure 5 The outputs of the POL-OP units during a rotation of 360� at two di�erent times of the day (i.e., with di�erent solar elevation), late in the afternoon (large amplitude) and early in the afternoon (small amplitude).
� 1 + d cos(2� ? 2� ) � 3 p2 (�) = log 1 ? d cos(2� ? 23� ) � 1 + d cos(2� ? 4� ) � 3 p3 (�) = log 1 ? d cos(2� ? 43� )
(2)
where p1 (�), p2 (�), p3 (�) are the outputs of the POLOP units tuned to 0� , 60� and 120� respectively, � is the current orientation with respect to the solar meridian, and d is the degree of polarization. There are two main models for using the POL-OP responses to derive compass direction: the scanning model and the simultaneous model (compare (Lambrinos et al., 1997)). With the simultaneous model, that is used in the present study, the heading direction can be determined continuously and no scanning movements are necessary during the journey. This can be done with a look-up table containing the output values of the POL-OP units and the corresponding orientation of the robot (Lambrinos et al., 1997). Although the output signals of the POL-OP units are independent of the light intensity due to the crossanalyzer con guration, they are still dependent on the degree of polarization (see equations (2)). The amplitude of the POL-OP signals is proportional to the degree of polarization which changes during the day depending on the elevation of the sun and due to clouds. Figure 5 shows the outputs of the POL-OP units during a rotation of 360� at two di�erent times of the day. Thus, the lookup table has to be updated during the course of the day. One way to overcome this problem is to use a scanning model where only the maxima of the signals are evaluated (Lambrinos et al., 1997). For the simultaneous model, however, the change in degree of polarization during the day has to be taken into account. This can be done by normalizing the outputs of the POL-OP units in the following way. First, the POL-OP signal are del-
4
(3)
1 ? 2�p1 (�) = d cos(2�) (4) 2 � (5) 1 ? 2�p2 (�) = d cos(2� ? 3 ) (6) 1 ? 2�p3 (�) = d cos(2� ? 43� ): From the above we nd: ! 2�p2(�) + p�1 (�) ? 32 1 p � = 2 atan (7) 3�p1 (�) ? 21 1 (�) ? 1 (8) d = 2�pcos(2 �) : Since p1 (�), p2 (�), p3 (�) are known (sensor readings), and p�1 (�), p�2 (�), p�3 (�) are derived from these values, we can determine the values of � and d. Notice that for this step only two POL-OP units are necessary (p1 and p2 in the above equations). Since the functions in equations (4{6) have a period of �, there will be two values of � (� and � + �) satisfying (4{6) for each triplet p�1 (�), p�2 (�), p�3 (�). This ambiguity can not be resolved by referring to the POL-OP unit signals. A di�erent sensory modality has to be involved. Disambiguation between the two candidate orientation values is done by employing the ambient light sensors of the robot. There are eight ambient light sensors arranged in two half-rings covering a visual eld of 180� each. They are mounted in two metal cases in the front part of the robot (see gures 3 and 4, right). The values from the ambient light sensors are used to obtain a rough estimate (about 90�) of the robot's heading with respect to the sun. If the robot is oriented towards the sun then the ambient light sensor with the visual eld enclosing the solar meridian will have a stronger response than the other sensors. This estimate is used to disambiguate between the two candidate orientations (�, � + �) obtained from the POL-OP units. We can now transform the current POL-OP readings to signals, that are independent of the time of the day. This is done by substituting the value of d from equation (8) in equations (4{6) instead of using equation (7). To optimize precision, the value of � can be calculated by selecting the equation of the POL-OP unit for which the signal curve is steepest at that point, i.e., POL-OP unit 1 for 30� {60�, POL-OP unit 2 for 60�{90� and POL-OP unit 3 for 90�{120�. Figure 6 shows the results of applying such a normalization process to the outputs of the POL-OP units shown in gure 5. The outputs of the POL-OP units during a rotation of 360� were recorded at two di�erent times of the day, late and early in the afternoon. The signals
0.8
POL−OP unit output
ogarithmized by applying a sigmoid function: 1 = p�(�): 10p(�) + 1 Equations (2) then become:
Proc. SAB'98, in press
POLOP 1 POLOP 2 POLOP 3
0.6
0.4
0.2
0.0
0
90
180 270 Robot orientation in degrees
360
Figure 6 The outputs of the POL-OP units shown in gure 5 after normalization. The outputs of the corresponding units in the two di�erent runs are completely overlapping in the gure.
become independent of the degree of polarization after the normalization process and are practically identical. Thus, they can be used to calculate the orientation of the robot with respect to the solar azimuth at any time of the day. As we have seen until now, it is possible to derive the orientation of the agent with respect to the solar azimuth by using the polarized light compass. To use the POL-compass over an extended period of time, however, requires compensating for the daily sun movement. Complicating this task is that the rate of change of the sun azimuth is not constant. The sun azimuth changes slowly in the morning and faster around noon. Moreover, the ephemeris function, i.e., the function that describes the change of sun azimuth over time, depends on the season and the geographical latitude. There is behavioral evidence that insects are equipped with such an ephemeris function (Lindauer, 1959). Moreover, recent studies in both bees (Dyer and Dickinson, 1994) and ants (Wehner and Muller, 1993) indicate that such an ephemeris function might be innate and that insects can re ne its precision by experience. In our study we extended the POL-compass described above by including the ephemeris function valid for the location and season of our experiments.
2.3 Path-integration experiments
The POL-compass was used in a path-integration mechanism to keep an estimate of the robots position over time (for the ants' performances see (Muller and Wehner, 1988; Hartmann and Wehner, 1995)). The position of the robot was calculated as follows: x(t + �t) = x(t) + cos(�(t)) v(t) �t (9) y(t + �t) = y(t) + sin(�(t)) v(t) �t (10) where x(t + �t), y(t + �t), x(t) and y(t) are the x and y coordinates of the robot at time t+�t and t, respectively.
Proc. SAB'98, in press
�(t) is the estimated orientation of the robot at time t, v(t) is velocity of the robot as estimated from the wheel encoders, and �t is the time step.
In order to compare the performance of the pathintegration system employing the POL-compass (POLcompass system) with a system using proprioception (proprioceptive system), the same algorithm was used to implement another path-integration system that used the robot's wheel encoders to derive orientation information. In the experiments described below, both systems were running in parallel providing independent estimates of the robot's position over time. Before each experiment, the robot was placed at the starting point and was aligned with the geographic north. During the experiments the robot had to follow a trajectory consisting of 15 \legs" of di�erent orientations and di�erent lengths (total length: 70m) by using one of the two path-integration systems, namely the POL-compass system or the proprioceptive system. During the experiments, the data from the sensors, i.e., the outputs of the POL-OP units, the light sensors and the wheel encoders were logged to the robot's on-board PC. At the end of each experiment, the nal position of the robot was recorded. The distance between the nal position of the robot and the starting position was used as an overall error measurement. The data on overall robot performance are given in table 1 and will be summarized below. The robot performed well with both systems. The largest error recorded in these experiments was just 1 m. The average errors were 13.5 cm and 51.9 cm for the POL-compass system and the proprioceptive system, respectively. Figure 7 shows the results from the experiments with the 15-leg trajectories for both systems. The POL-compass system was clearly more precise than the proprioceptive system (U-test, p > 0:0023). Both the mean deviation from the target point and the standard deviation of the error were smaller. During the experiments, the POL-compass system and the proprioceptive system produced di�erent estimates of the position of the robot. Although the di�erence between these estimates was initially zero, it increased signi cantly over time. This can be seen more clearly in another experiment where the robot had to fol-
12 10
encoders pol−compass
8
encoders pol−compass
6
real final point starting point
4 2
y [m]
Table 1 Overall performance of the robot with the two path-integration systems. Average error and standard deviations relate to deviations from the target position at the end of the experiments. n indicates the number of experiments. POL-compass Proprioception Average error [cm] 13.52 51.90 Standard deviation [cm] 6.29 28.83 5 11.18 Min [cm] Max [cm] 27.46 108.85 n 9 9
5
0 −2 −4 −6 −8 −10 −12 −2
0
2
4
6
8
10
12
14
x [m]
Figure 8 Trajectories estimated by both the POL-compass system and the proprioceptive system during an experiment with a 30 leg trajectory. The robot was controlled by the POL-compass system. The nal positions of the robot as estimated by both systems and the real nal position are also drawn. The arrow indicates the direction of the rst leg.
low a trajectory consisting of 30 randomly generated legs (total length: 255m). Figure 8 shows the trajectories as estimated from the POL-compass and the proprioceptive systems. During the experiment the robot was controlled by the POL-compass system, but estimation of the position was also derived from the proprioceptive system. Both estimates were logged in a le for later analysis. As it can be seen, the nal position of the robot as estimated with the POL-compass system is very close to the real position of the robot which was measured with a meter stick at the end of the experiment. The nal position of the robot as estimated from the proprioceptive system is about 3.39 m away from the real value. Figure 9 shows the deviation between the two estimates over time. From the results it is clear that a path-integration system employing a skylight compass will have an advantage over a system based on proprioception only. This general conclusion has been predicted, on theoretical grounds, by (Benhamou et al., 1990). The polarization pattern of the sky provides a stable frame of reference that can be used to derive the most important piece of information which such a system requires, that of the compass information. Such a system is precise enough to guide the robot close to the target position so that another system based on visual landmark information can take over to nally pinpoint the target.
6
Proc. SAB'98, in press 120 400
pol−compass encoders
6 5
100 13
200
80 0 4 8 12 15
1 14
7
y [cm]
y [cm]
0
−200
40
20
10
3
−400
60
2 9
0 pol−compass encoders
−600
−200
0
11
200
400
600
800
−20 −60
−40
−20
0
20
40
60
x [cm]
x [cm]
Figure 7 Left: Results of the experiments with a 15 leg trajectory. The trajectory is drawn starting from origin with the leg number printed at the end of each leg. Note that the trajectory passes three times through the origin. The nal points of the robot during the experiments are drawn as lled circles (wheel encoder experiments) or triangles (POL-compass experiments). Mean and standard deviation within the data in the direction of the axes in both cases are indicated by boxes. Right: Zoom into the region around the starting position. 7
deviation [m]
6 5 4 3 2 3.27 m
1 0 0
100
200
300
400
500
600
700
800
t [sec]
Figure 9 Deviation between the position estimates by the POLcompass system and by the proprioceptive system. At the beginning of the experiments both estimates are the same but the di�erence tends to increase over time.
3. Visual landmark navigation
3.1 Landmark navigation in insects
While path integration employing a skylight compass is the primary strategy that Cataglyphis ants are using to return to the vicinity of their nest, errors introduced by the path-integration process would result in a wrong estimate of the nest position (Wehner and Wehner, 1986). Since the nest entrance is an inconspicuous hole in the desert ground, which is invisible to the insect even from a small distance, alternative strategies have to be employed in order to nally locate the entrance. In the absence of visual landmarks, Cataglyphis will start a systematic search at the position where the nest is expected to be found after having reset its path-integration system (Wehner and Srinivasan, 1981). However, when landmark information is available, both bees (Cartwright and Collett, 1983) and ants (Wehner et al., 1996) will exploit
it, and they will relocate the target position directly with a remarkable precision. A number of experiments performed with bees (Cartwright and Collett, 1983) and ants (Wehner and Raber, 1979; Wehner et al., 1996) have unraveled important properties of the insect's landmark navigation system. The main conclusion from these experiments is that the animal learns a rather unprocessed visual snapshot of the scene around the goal position. By matching this snapshot to the current retinal image, the insect could derive the direction it has to move in order to relocate the target position where the snapshot was taken. There is evidence from experiments in which several parameters of the landmark con guration have been changed, that the snapshot matching strategies exploit di�erences in the bearing, apparent size and apparent height of the landmarks between snapshot and current retinal image.
3.2 Model of landmark navigation
Snapshot matching: A model for the matching of snapshot and current view was proposed by Cartwright and Collett (1983, 1987), which reproduces some aspects of the search behavior of bees; gure 10 (left) visualizes the matching process of this model. It assumes that the views on which the matching process is operating are horizontal images comprising dark and bright sectors corresponding to the landmarks and the gaps between them, respectively. A pairing between sectors in the two views is established by searching the closest sector of the same type (black or white) in the current view for each sector in the snapshot. Each pair of sectors contributes two vectors to the total home vector: a tangential vector point-
Proc. SAB'98, in press
7
ing from the snapshot sector towards the paired sector in the current view, and a radial vector, which points centrifugally, if the apparent size of the current view sector is smaller than the size of its counterpart in the snapshot, and vice versa. In principle, the model could also take into account di�erences in height, though this was not considered in the experiments described here. Averaging all contributions gives a home vector pointing approximately to the position of the target; a trajectory following these home vectors that are attached to each point of the plane will approach the location where the snapshot was taken ( gure 10, center and right). In the original model presented by Cartwright and Collett (1983), all contributing vectors have unit length. For the robot experiments described below, these unit vectors have been replaced by vectors with a length proportional to the di�erence in bearing, or apparent size, of the paired sectors. As shown in gure 11, this modi cation facilitates the use of the length of the home vector as a measure of discrepancy between current view and snapshot, called \disparity" here. This is not possible with the unit vector model, since the disparity is not decreased while approaching the snapshot position; it would only become zero if a perfect match between snapshot and current view is achieved. Using proportional contributions, the robot runs can be stopped when the disparity falls below a threshold. For the weighting of tangential and radial contributions the same ratio of 1:3 as given in (Cartwright and Collett, 1987) was used. External compass reference: An important prerequisite of the matching procedure between snapshot and current view is the alignment of both views with respect
disparity
Figure 10 Simulation of the snapshot model (with proportional vector contributions) for a con guration of three landmarks ( lled circles). Left: A snapshot (inner ring) taken at the nest position marked with a cross is matched with a current view (middle ring) taken at the position in the center of the circle. Each pair of matched sectors (both black and white) contributes with a radial and a tangential vector (attached to the outer ring in the diagram). The home vector (originating from the center) is obtained by averaging the contributing vectors. Center: A home vector can be assigned to each point of the plane. Right: Trajectories running tangentially to the home vectors. Dark courses end at the snapshot position, grey courses run into one of the landmarks.
proport. vectors
unit vectors proport. vectors
unit vectors
0 0
10
20
30
40
50
steps
Figure 11 Left: Time course of the disparity (length of the home vector) in a simulation of the original snapshot model using unit vector contributions, and of a model where vector contributions have a length proportional to di�erences in bearing and apparent size of sectors. Disparity is a relative measure that can be scaled arbitrarily. Within one simulation step, the home vector is computed and a movement with constant length in this direction is executed. Right: Corresponding trajectories running towards the snapshot position in the center (see also gure 10).
to an external compass reference. Without proper alignment, the number of mismatches between sectors | sectors in the two views that are paired, but do not correspond to the same landmark or gap | will increase signi cantly, resulting in an erroneous home vector. Bees might accomplish this alignment by maintaining a constant orientation of the body during learning and searching for a goal (Collett and Baron, 1994). For some species of Cataglyphis , body rotations interrupting the forward movement have been observed (Wehner, 1994), but it is not clear, if this behavior could also serve for the alignment of the views. An internal rotation of either snapshot or current view could be excluded for ants by experiments on intra- and inter-ocular transfer of information (Wehner et al., 1996). But even if the assumption of
8
retinotopically xed views holds and body rotation can be excluded, the alignment could be accomplished by storing a set of snapshots taken in di�erent orientations at the same location and activating them selectively according to the current compass bearing (Cartwright and Collett, 1983). Regardless of the method of alignment, ants could derive the required compass information from the polarization pattern (see section 2.2). In the robot experiments described here, we used the POL-compass to rotate the current view so that it is aligned with the snapshot.
3.3 Landmark navigation in a robot
Camera: The camera system mounted in the front part of the robot is shown in gure 4 (left). It consists of a CCD camera and a conical mirror in the vertical optical axis of the camera. The camera was mounted as low as possible on the robot within the construction constraints, which brings the mirror to a height of approximately 27 cm above the ground. The conical mirror provides a 360� horizontal view; the opening angle of the cone was determined so that the visual eld extends �10� around the horizon. In order to reduce the total light intensity, a neutral density lter is mounted between camera and mirror. An additional infrared lter was necessary to prevent an in uence of thermal radiation on the camera image. Image processing: Figure 12 illustrates the image processing steps from the camera image to a horizontal view with black and white sectors as required by the matching mechanism described in section 3.2. The same processing steps were applied to both snapshot and current views. In a rst step, the camera image (obtained from a situation similar to the one shown in gure 14) is transformed into an azimuth-altitude representation. A mean grey value is determined from the transformed image and used to adjust the brightness parameter of the camera in a way, that the mean grey value of this image is kept constant over time. This is indispensable for the subsequent thresholding operation separating dark and bright regions. The nal one-dimensional horizontal view is obtained by counting the number of black pixels within a part of each pixel column (limited by the two lines shown in the thresholded image) and applying a threshold of 50%.
3.4 Landmark navigation experiments
Figure 14 shows a typical setup for the robot experiments in the habitat of Cataglyphis. Black cylinders were used as landmarks; the same type of landmarks was also used for the ant experiments. At the beginning of each experiment, the robot was placed at the starting position within the landmark array. The landmark array used for the experiments shown in gure 13 consists of 3 black cylinders with a height of 80 cm and a diameter of 30 cm, forming an equilateral triangle whose sides are 3 m long. The starting position
Proc. SAB'98, in press Camera
Adjustment of brightness
Camera image
Polar mapping
Thresholding
Extraction of horizon
Figure 12 Image processing for landmark navigation. The image from the 360� camera (160 � 120 pixel) is transformed into a polar view (351 � 56). After applying a threshold to each pixel, the segmented horizon (351 � 1) is extracted from the area within the two lines; a pixel in the horizon will be black, if more than 50% of the pixel in the corresponding column are black. The landmark extracted in the center belongs to equipment in the vicinity, which was removed for the experiments.
was situated on a symmetry line of this triangle in a distance of 1 m from one of the landmarks. A same setup was used in the simulation described in gure 10. Data from two experiments are visualized in gure 13. A snapshot was taken at the starting position, processed as described in section 3.3, rotated by the angle obtained from the POL-compass, and stored in the form of black and white sectors ( gure 13, center). After taking the snapshot, the robot had to follow a certain direction for some distance (4 m for trajectory A, 2 m for trajectory B; see gure 13, left) corresponding to a short foraging journey (it could also have been displaced manually). At the end of this outward trip, control was handed over to the homing algorithm, which performed the extraction of a sectorized horizontal view from the camera image, the alignment of this view, and the computation of the home vector by matching the aligned view to the snapshot; transitions of the rotated current views are shown in the center of gure 13. The resulting home vector was used to set the direction of movement. As soon as the disparity became lower than a threshold, the experiment was stopped ( gure 13, right).
Proc. SAB'98, in press
9 traj. A
Time
3
final point outward journey homing
trajectory A trajectory B
y [m]
B
1 Retinal position
0
traj. B
Time
A
-1
Disparity
2
0
-2
10
-4
-3
-2
-1 x [m]
0
1
2
20 30 Time [s]
40
50
Retinal position
Figure 13 Landmark navigation experiment with the robot. Left: Two typical trajectories of the robot in an array of three landmarks ( lled circles). From the end of the preprogrammed outward journey (dashed) towards the target position (0,0) the robot is guided by landmark navigation (solid line). Center: Transitions of the rotated current view over time towards the snapshots (images underneath each trace) for the two trajectories. Right: Time course of disparity between snapshot and current view for the two trajectories. The dashed line depicts the threshold used for terminating the runs.
Figure 14 Example of a landmark array used for the navigation experiments. The grid visible on the desert ground was used for the alignment of landmarks and robot, and for registration of the nal points.
Eight runs (including trajectories A and B in gure 13) with di�erent angles and distances of the outward journey were performed with this landmark con guration and with the same starting point; the nal parts of the 8 trajectories are shown in gure 15 (left). The deviation between nal and initial position of the camera axis was between 7 cm and 20 cm. This deviation does not re ect the precision of this homing mechanism, though, since the nal points are locations where the disparity reached the termination threshold, but not locations with minimal disparity. For a visual evaluation of the data, those points on the trajectory are marked, where the disparity drops below 1.5 times the threshold. For comparison, the right part of gure 15 visualizes the disparity for points in the vicinity of the snapshot loca-
tion in a simulation. Final points as well as the points where 1.5 � threshold was passed are in accordance with the disparity plot, since they can be thought to be located on roughly elliptic bands around the snapshot position, with all nal positions on the inner band. Since these bands are not overlapping, noise induced to the disparity from the sensor signal seems to be in a range below the termination threshold. Therefore it can be assumed, that a reduction of the termination threshold will bring the nal points closer to the snapshot location. This will require a specialized control algorithm for the nal phase of the approach, that will allow the robot to locate the target point more precisely.
4. Conclusion In this paper we used the autonomous agents approach to study the navigation behavior of insects. Inspired by the insects, we have developed navigation mechanisms that were successfully employed on the mobile robot Sahabot 2. The goal of this study was to implement mechanisms of path integration and visual landmark navigation in an autonomous agent, and to test in the eld whether a combination of these mechanisms is suitable to guide the agent precisely back to a target location. Both the path integration system using the POL-compass and the visual piloting mechanism exhibited a precision comparable to that of the insect. The model of landmark navigation proposed by Cartwright and Collett (1983), in conjunction with the POL-compass used for the alignment of views, could be shown to work on a robot and produce reasonable trajectories.
10
Proc. SAB'98, in press 0.2
snapshot final point threshold x 1.5
0.1
y [m]
0
−0.1
−0.2
−0.3
−0.1
0
0.1
0.2
x [m]
Figure 15 Left: Final parts of 8 homing trajectories from landmark navigation (for the con guration in gure 13, including trajectory A and B shown there). All points relate to the position of the camera axis. Small dots are placed on the trajectories at points, where the disparity dropped below a value of 1.5 times the termination threshold. Right: Disparity in the vicinity of the snapshot location. Grey regions are restricted by equidistant iso-disparity curves; disparity decreases when approaching the snapshot position.
Acknowlegdments
This work was supported by grants from the Swiss Federal O�ce for Education and Science (VIRGO TMR network), the Swiss National Science Foundation (grant 2047257.96), and the Human Frontier Science Program. The Sahabot 2 was constructed in cooperation with Rosys AG, Hombrechtikon. Financial support by Rosys AG is kindly acknowledged. Many thanks to Christian Gfeller of Rosys for his skilled and patient cooperation, and to Marinus Maris, Hiroshi Kobayashi, and Lukas Lichtensteiger, who substantially contributed in the construction of the robot.
References
Benhamou, S., Sauv�e, J., and Bovet, P. (1990). Spatial memory in large scale movements: e�ciency and limitation of the egocentric coding process. J. Theor. Biol., 145:1{12. Bernard, G. D. and Wehner, R. (1977). Functional similarities between polarization vision and color vision. Vision Res, 17:1019{1028. Cartwright, B. and Collett, T. (1983). Landmark learning in bees. Journal of Comparative Physiology A, 151:521{543. Cartwright, B. and Collett, T. (1987). Landmark maps for honeybees. Biological Cybernetics, 57:85{93. Collett, T. S. and Baron, J. (1994). Biological compasses and the coordinate frame of landmark memories in honeybees. Nature, 368:137{140.
Dyer, F. C. and Dickinson, J. A. (1994). Development of sun compensation by honey bees: How partially experienced bees estimate the sun's course. Proc. Natn. Acad. Sci. U.S.A, 91:4471{4474. Hartmann, G. and Wehner, R. (1995). The ant's path integration system: a neural architecture. Biological Cybernetics, 73:483{497. Labhart, T. (1988). Polarization-opponent interneurons in the insect visual system. Nature, 331:435{437. Lambrinos, D., Maris, M., Kobayashi, H., Labhart, T., Pfeifer, R., and Wehner, R. (1997). An autonomous agent navigating with a polarized light compass. Adaptive Behavior, 6(1):175{206. Lindauer, M. (1959). Angeborene und erlernte Komponenten in der Sonnenorientierung der Bienen. Z. vergl. Physiol., 42:43{62. Muller, M. and Wehner, R. (1988). Path integration in desert ants, Cataglyphis fortis. In Proc. Natl. Acad. Sci. Neurobiology, volume 85, pages 5287{5290, U.S.A. Pfeifer, R. (1996). Building \Fungus Eaters": Design principles of autonomous agents. In Proceedings of the Fourth International Conference on Simulation of Adaptive Behavior SAB96 (From Animals to Animats), pages 3{12, Cape Cod, Massachusetts, USA. Vitzthum, H. (1997). Der Zentralkomplex der Heuschrecke Schistocerca gregaria: Ein mogliches Zentrum des Polarisationssehsystems. PhD thesis, Universitat Regensburg. Wehner, R. (1982). Himmelsnavigation bei Insekten. Neurophysiologie und Verhalten. Neujahrsblatt der Naturforschenden Gesellschaft Zurich, 184:1{132. Wehner, R. (1987). Spatial organization of foraging behavior in individually searching desert ants, Cataglyphis (Sahara desert) and Ocymyrmex (Namib desert). In Pasteels, J. M. and Denebourg, J. L., editors, From Individual to Collective Behavior in Social Incects, pages 15{42. Birkhauser, Basel. Wehner, R. (1994). The polarization-vision project: championing organismic biology. In Schildberger, K. and Elsner, N., editors, Neural Basis of Adaptive Behaviour, pages 103{143. G. Fischer, Stuttgart. Wehner, R. (1997). The ant's celestial compass system: spectral and polarization channels. In Lehrer, M., editor, Orientation and Communication in Arthropods, pages 145{ 185. Birkhauser, Basel. Wehner, R., Michel, B., and Antonsen, P. (1996). Visual navigation in insects: coupling of egocentric and geocentric information. Journal of Experimental Biology, 199:129{ 140. Wehner, R. and Muller, M. (1993). How do ants acquire their celestial ephemeris function? Naturwissenschaften, 80:331{333. Wehner, R. and Raber, F. (1979). Visual spatial memory in desert ants, Cataglyphis bicolor (Hymenoptera: Formicidae). Experientia, 35:1569{1571. Wehner, R. and Srinivasan, M. (1981). Searching behavior of desert ants, genus cataglyphis (formicidae, hymenoptera). J. comp. Physiol., 142:315{338. Wehner, R. and Wehner, S. (1986). Path integration in desert ants: approaching a long standing puzzle in insect navigation. Monitore Zool Ital (NS), 20:309{331.