Modeling auditory processing of amplitude modulation. II. Spectral and temporal integrationa) Torsten Daub) and Birger Kollmeier Carl von Ossietzky Universita¨t Oldenburg, Graduiertenkolleg Psychoakustik, AG Medizinische Physik, D-26111 Oldenburg, Germany
Armin Kohlrausch IPO Center for Research on User-System Interaction, P.O. Box 513, 5600 MB Eindhoven, The Netherlands
~Received 28 June 1996; accepted for publication 4 August 1997! A multi-channel model, describing the effects of spectral and temporal integration in amplitude-modulation detection for a stochastic noise carrier, is proposed and validated. The model is based on the modulation filterbank concept which was established in the accompanying paper @Dau et al., J. Acoust. Soc. Am. 102, 2892–2905 ~1997!# for modulation perception in narrow-band conditions ~single-channel model!. To integrate information across frequency, the detection process of the model linearly combines the channel outputs. To integrate information across time, a kind of ‘‘multiple-look’’ strategy, is realized within the detection stage of the model. Both data from the literature and new data are used to validate the model. The model predictions agree with the results of Eddins @J. Acoust. Soc. Am. 93, 470–479 ~1993!# that the ‘‘time constants’’ associated with the temporal modulation transfer functions ~TMTF! derived for narrow-band stimuli do not vary with carrier frequency region and that they decrease monotonically with increasing stimulus bandwidth. The model is able to predict masking patterns in the modulation-frequency domain, as observed experimentally by Houtgast @J. Acoust. Soc. Am. 85, 1676–1680 ~1989!#. The model also accounts for the finding by Sheft and Yost @J. Acoust. Soc. Am. 88, 796–805 ~1990!# that the long ‘‘effective’’ integration time constants derived from the data are two orders of magnitude larger than the time constants derived from the cutoff frequency of the TMTF. Finally, the temporal-summation properties of the model allow the prediction of data in a specific temporal paradigm used earlier by Viemeister and Wakefield @J. Acoust. Soc. Am. 90, 858–865 ~1991!#. The combination of the modulation filterbank concept and the optimal decision algorithm proposed here appears to present a powerful strategy for describing modulation-detection phenomena in narrow-band and broadband conditions. © 1997 Acoustical Society of America. @S0001-4966~97!05711-1# PACS numbers: 43.66.Ba, 43.66.Dc, 43.66.Mk @JWH#
INTRODUCTION
One of the most interesting and fundamental questions in psychophysical research is how the auditory system ‘‘trades’’ spectral and temporal resolution. One problem in this field is the question of how peripheral filtering affects the ability to detect modulation. It is often postulated that peripheral filtering does not limit the ability to detect modulation and that in ‘‘temporal resolution’’ tasks such as modulation detection the observer broadens his ‘‘effective’’ bandwidth ~e.g., Viemeister, 1979; Berg, 1996!. With such an assumption, the experimental data can be simulated by a model using a ‘‘predetection’’ filter as broad as several critical bandwidths to account for some kind of peripheral filtering ~Viemeister, 1979!. If, in contrast, peripheral filtering in terms of critical bands has any influence on modulation detection, the question arises how the applied modulation a!
Part of this research was presented at the 131th meeting of the Acoustical Society of America @T. Dau, B. Kollmeier and A. Kohlrausch, ‘‘A quantitative prediction of modulation masking with an optimal-detector model,’’ J. Acoust. Soc. Am. 99, 2565~A! ~1996!#. b! Corresponding author. Electronic mail:
[email protected] 2906
analysis depends on center frequency. In this vein, some authors have postulated that the TMTF of a broadband noise is actually determined by the information in the highest critical band excited by the stimulus ~e.g., Maiwald, 1967a, b; Van Zanten, 1980!. Eddins ~1993! examined spectral integration in amplitude-modulation detection, independently varying stimulus bandwidth and spectral region. He found that the cutoff frequency of the TMTF does not depend on carrier frequency region, but increases significantly with increasing carrier bandwidth. As recently pointed out by Strickland and Viemeister ~1997!, this latter observation might be an artifact of the stimulus generation, which included a rectangular bandlimitation after modulation of the carrier. In Dau ~1996! and Dau et al. ~1997!, experiments on amplitude-modulation detection were described using narrow-band noise as the carrier at a high center frequency ~5 kHz!. By using these conditions, effects of any peripheral or ‘‘predetection’’ filtering were minimized and, in addition, the spectral region that was being used to detect the modulation was restricted to one critical band. A model of the effective signal processing in the auditory system, including a modulation filterbank, was derived to analyze the temporal envelope of the stimuli. This model will be called the
J. Acoust. Soc. Am. 102 (5), Pt. 1, November 1997 0001-4966/97/102(5)/2906/14/$10.00 © 1997 Acoustical Society of America
2906
‘‘modulation filterbank model’’ throughout this paper. To get more insight into the processing of modulation, several experiments are described here that investigate the effects of spectral integration in amplitude-modulation detection, examining in particular the transition between narrowband and broadband conditions. To test the capabilities of the modulation filterbank model in conditions of spectral integration, some critical experiments are performed and model predictions are compared with data from the literature ~Eddins, 1993; Sheft and Yost, 1990! and the new experimental data. To compare results from experiments and simulations with as close a similarity in the experimental details as possible, the experiments by Eddins ~1993! and those by Sheft and Yost ~1990! were replicated in our laboratory with a slightly different threshold estimation procedure. Another aspect of modulation perception is the phenomenon of temporal integration in amplitude-modulation detection. Temporal integration or temporal summation refers to the well-known fact that over a range of durations thresholds decrease with increasing signal duration. Several models have been suggested in the literature to describe this phenomenon. However, differences in the modeling strategies occur that reflect the ‘‘resolution-integration conflict’’ ~de Boer, 1985!. In the case of temporal integration in modulation detection, Sheft and Yost ~1990! found that time constants associated with temporal integration are much larger than those indicated by the ‘‘resolution data.’’ The present study examines the ability of the modulation filterbank model to account for these long effective time constants found in the data. As before, both our own experimental data from ‘‘critical’’ experiments as well as data from the literature were compared with model predictions. It should be emphasized at this point that the same parameter set was used for all model predictions throughout this paper. These parameters and in particular the scaling of the modulation filters were also the same as in the accompanying paper ~Dau et al., 1997!, where the filterbank parameters were adjusted to predict amplitude modulation-detection thresholds for narrow-band noise carriers.1 I. MULTI-CHANNEL MODEL
All simulations discussed here were performed on the basis of the modulation filterbank model that was initially developed as a single-channel model, as described in Dau et al. ~1997!. Figure 1 shows the structure of the multichannel model which was extended from the single-channel model by performing the modulation analysis in parallel on the output of each stimulated peripheral auditory filter. This is motivated in part by results from physiological studies of the representation of amplitude modulation within the inferior colliculus ~IC! of the cat, where it was found that modulation frequencies are represented in a systematic way orthogonally to the tonotopical organization of the IC ~Schreiner and Langner, 1988!. The model contains the same stages of signal processing along the auditory pathway as proposed in the single-channel model. The main features are described briefly here; for further details see Dau et al. ~1996a, 1997!. To simulate the 2907
J. Acoust. Soc. Am., Vol. 102, No. 5, Pt. 1, November 1997
FIG. 1. Block diagram of the psycho-acoustical model for describing modulation detection data with an optimal detector as the decision device. The signals are preprocessed, subjected to adaptation, filtered by a modulation filterbank and finally added to internal noise; this processing transforms the signals into their ‘‘internal representations.’’
peripheral bandpass characteristics of the basilar membrane, the gammatone filterbank of Patterson et al. ~1987! is used. The filters overlap at the 23-dB points of their transfer functions. The summation of all filter transfer functions would result in a flat transfer characteristic across frequency. The stimulus at the output of each peripheral filter is half-wave rectified and low-pass filtered at 1 kHz. This stage essentially preserves the envelope of the signal for high center frequencies. Effects of adaptation are simulated by nonlinear adaptation circuits ~Pu¨schel, 1988; Dau et al., 1996a!. The parameters for these circuits were the same as in Dau et al. ~1996a, b!. The adapted signal is further analyzed by a linear modulation filterbank. The parameters of the modulation filters agree with those in Dau et al. ~1997! and we refer to that paper for a detailed description. It is assumed within the present study that these parameters do not vary across frequency, i.e., the same modulation filterbank is applied to analyze the signal’s envelope at the output of each critical band. Limitations of resolution are simulated by adding internal noise with a constant variance to each modulation filter output. The decision device is realized as an optimal detector in the same way as described in Dau et al. ~1996a, 1997!. Within the multi-channel model, the internal representation of the stimuli has four dimensions, namely amplitude, time, modulation center frequency ~as before in the single-channel model!, and ~audio! center frequency as the additional axis. In the simulations the internal representations of the different peripheral channels are appended one after another in one large array. The decision process works exactly in the same way as described in the single-channel analysis, with the extension that all auditory filters with cenDau et al.: Spectral and temporal integration
2907
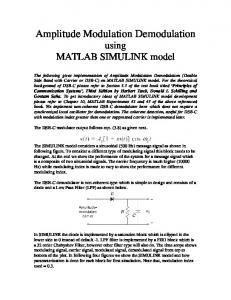
FIG. 2. Modulation-detection thresholds of a 5-Hz modulation as a function of the carrier bandwidth. Open symbols indicate measured data of three subjects ~same in the left and the right panel!. Simulated thresholds with the single-channel model are represented in the left panel by the filled circles. Simulated thresholds with the multi-channel model are shown in the right panel ~filled circles!. The filled box represents the simulated threshold for D f 510 kHz, where the modulation analysis was performed using the highest critical band excited by the stimulus. Center frequency: 5 kHz; Carrier and modulation duration: 500 ms. Level: 65 dB SPL. Subjects: JV ~h!; TD ~s!; PD ~L!; optimal detector ~d,j!.
ter frequencies within the spectral range of the stimulus were included in the analysis. Decisions were then based on the cross correlation between the ~four-dimensional! actual internal representation of the stimulus and the normalized suprathreshold ~four-dimensional! template representation. Using such a model, a prediction of the average subject’s performance is possible on a trial-by-trial basis. Simulations of the experimental runs can thus be performed by implementing on the computer the same threshold estimating procedures within the model as those being used in the experiments with human observers. II. METHOD
Modulation thresholds were measured and simulated using an adaptive 3-interval forced-choice ~3IFC! procedure. The experimental procedure and stimulus generation were the same as described in the accompanying paper ~Dau et al., 1997!. Also, the same five subjects participated in this study. Several experiments on modulation detection were performed. The subject’s task was to detect a sinusoidal test modulation of a Gaussian noise carrier. The test modulation was applied with zero onset phase. Unless explicitly stated, a carrier level of 65 dB SPL was used. During the experiments with a noise carrier, an independent sample of the noise was presented in each interval. Filtering of the noise stimuli was done in the frequency domain by Fourier transforming the whole noise waveform, setting the respective frequency samples to zero, and transforming the signal back into the time domain. Unless stated otherwise, the filtering was applied prior to modulation. The rms level of the modulated signal was always equated to the rms level employed in the unmodulated trials. III. RESULTS A. Modulation analysis within and beyond one critical band
In the first experiment, the effect of carrier bandwidth on the detectability of a certain signal modulation was examined 2908
J. Acoust. Soc. Am., Vol. 102, No. 5, Pt. 1, November 1997
for bandwidths within and beyond one critical band. In the accompanying study by Dau et al. ~1977! only carrier bandwidths smaller than a critical band were applied and in the corresponding simulations the modulation analysis was performed only in one peripheral channel. The present experiment was designed to illustrate the limitations of the ‘‘singlechannel’’ model in conditions of spectral integration in modulation detection, and to show the necessity of the extention of the model towards a ‘‘multi-channel’’ model. A noise carrier centered at 5 kHz was sinusoidally modulated with a modulation rate of 5 Hz. Modulation depth at threshold was measured as a function of the carrier bandwidth, which had one of the following values: 10, 25, 50, 100, 250, 500, 1000, 1500, 2500, 5000, or 10 000 Hz. The duration of the carrier and the modulation was 500 ms including 50-ms cosine-squared rise and decay ramps. The bandwidths cover the range from less than the critical bandwidth at 5 kHz to much greater than the critical bandwidth. The left panel of Fig. 2 shows the experimental results of three subjects ~open symbols!. The ordinate indicates modulation depth at threshold and the abscissa shows the carrier bandwidth. Thresholds decrease monotonically with increasing bandwidth. This decrease is due to changes in the spectrum of the inherent fluctuations, which, for low modulation frequencies, decreases with increasing bandwidth of the carrier ~Lawson and Uhlenbeck, 1950; see Dau et al., 1997!. As a consequence, less energy of the random envelope fluctuations of the carrier leaks into the transfer range of the modulation filters near the test modulation frequency. In the model, this leads to decreasing thresholds with increasing carrier bandwidth. Simulated thresholds obtained with the single-channel model as described in Dau et al. ~1997! are plotted in the left panel of Fig. 2 ~filled symbols!. In this single-channel simulation, the modulation analysis was carried out using the peripheral filter tuned to 5 kHz. In conditions with carrier bandwidths D f ,1000 Hz, simulated and measured data are in good agreement. For bandwidths D f >1000 Hz, however, systematic differences between simulations and experimental data occur, which increase with inDau et al.: Spectral and temporal integration
2908
FIG. 3. Modulation-detection thresholds for one subject ~BG! as a function of modulation frequency with upper cutoff frequency as the parameter. Each panel represents a different bandwidth condition: upper left: 200 Hz, upper right: 400 Hz, lower left: 800 Hz, lower right: 1600 Hz. The upper cutoff frequency is either 4400 Hz ~n!; 2200 Hz ~L!; or 600 Hz ~s!.
creasing bandwidth. For the bandwidth D f 510 kHz, for example, the difference between the experimental results and simulations amounts to more than 5 dB. Of course, this discrepancy is expected, since the simulations were carried out using only the information about the signal modulation available at the output of one peripheral filter. The filled box in the left panel of Fig. 2 represents the simulated threshold for a carrier bandwidth of 10 kHz, where the modulation analysis was performed using the highest critical band excited by the stimulus. Even in this ‘‘optimized’’ single-channel simulation, there remains a discrepancy of nearly 5 dB between the simulated and the measured threshold. This does not support the hypothesis by Maiwald ~1967a, b! and Van Zanten ~1980! that sufficient information about the signal modulation is available in the highest excited frequency region and that the detection strategy of the subject is to monitor the ‘‘internal’’ filters in this high-frequency region.2 The right panel of Fig. 2 shows the simulated data from the multichannel filterbank model together with the experimental data already shown in the left panel. By combining information from all excited peripheral channels, the model can account for the continuing decrease in thresholds over the whole range of carrier bandwidths. B. Effects of bandwidth and frequency region
In the next experiment, effects of absolute bandwidth and frequency region on spectral integration in modulation 2909
J. Acoust. Soc. Am., Vol. 102, No. 5, Pt. 1, November 1997
detection were studied in the same way as by Eddins ~1993!. Modulation thresholds for narrow-band noise carriers were measured as a function of modulation frequency for the following conditions: The stimulus bandwidth was either 200, 400, 800, or 1600 Hz and the frequency region was varied by adjusting the high-frequency cutoff of the noise to be either 600, 2200, or 4400 Hz. The purpose was to determine TMTFs by independently varying stimulus bandwidth and stimulus frequency to determine the influence of these parameters on modulation detection. As in Eddins ~1993!, the modulated stimuli were generated by bandpass filtering after amplitude modulation of wide-band noise to avoid the possibility that the detection of modulation would be based on spectral cues in the signal interval rather than changes in the temporal waveform. In this way, the bandwidth of the narrow-band stimuli was the same in the presence or absence of modulation. In addition, the stimuli were adjusted to have equal energy in each interval of the forced-choice trial to prevent detection of modulation based on overall level rather than on the presence or absence of modulation. Figures 3 and 4 show the experimental data of two subjects for several stimulus conditions. Modulation depth m at threshold is plotted as a function of modulation frequency. The transfer functions reflect a bandpass characteristic that is similar to data from previous studies ~Rodenburg, 1972, 1977; Viemeister, 1977, 1979; Formby and Muir, 1988!. The data are in very good agreement with the results of Eddins, Dau et al.: Spectral and temporal integration
2909
FIG. 4. Same as Fig. 3 for subject TD.
in spite of slight differences in the threshold estimation procedure between both studies. Increasing stimulus bandwidth results in a corresponding increase in sensitivity to modulation. This systematic increase is seen for each of the three cutoff frequencies tested. Eddins fitted his data—for each subject and condition—with the transfer function of a simple low-pass filter and derived the time constant associated with the 23-dB cutoff frequency of the specific transfer function. Two interpretations emerged from his analysis: First, the time constants associated with the TMTFs do not vary with changing frequency region. Eddins ~1993! concluded from the data that temporal acuity is independent of frequency region, assuming that temporal acuity and derived time constants from the data are directly related. Second, the time constants associated with TMTFs decrease monotonically with increasing stimulus bandwidth. Figure 5 shows the corresponding model predictions obtained with the modulation filterbank model. Modulation depth at threshold is plotted as a function of modulation frequency. Modulation analysis was performed using those peripheral channels with center frequencies within the spectral width of the noise carrier. The shape of the simulated threshold patterns agrees well with the corresponding data, but there is a constant absolute deviation of 2–5 dB between model predictions and individual experimental data. That is, the form of the simulated TMTF does not depend on the frequency region of the stimuli but depends on the stimulus bandwidth. In some—extreme—conditions, e.g., for D f 5400 Hz at the upper cutoff frequency of 600 Hz and for D f 5800 Hz at the upper cutoff frequency of 2200 Hz, the 2910
J. Acoust. Soc. Am., Vol. 102, No. 5, Pt. 1, November 1997
slope of the simulated TMTF between the penultimate and the last modulation frequency is steeper than in case of other cutoffs at these bandwidths. The same tendency is seen in most of the corresponding experimental conditions, e.g., in Fig. 3 for 800 Hz and in Fig. 4 for 400 and 800 Hz. Within the model the ‘‘low-frequency’’ and the ‘‘highfrequency’’ conditions require quite different decision strategies to determine the detection threshold. Consider, for example, the bandwidth of D f 5400 Hz and the upper cutoff frequencies of 600 and 4400 Hz, representing the lowfrequency and the high-frequency conditions, respectively. In the low-frequency condition, the modulation analysis is performed in parallel in several peripheral filters. In the highfrequency condition, the modulation analysis is carried out in only one peripheral channel because of the poor spectral resolution of the auditory system at high frequencies. The results of the simulations in the modulation detection task are the same for both conditions ~except for the highest modulation frequency!, indicating that, apparently, the poor temporal resolution in the low-frequency condition is somehow compensated for by the greater number of ‘‘observations’’ across frequency compared to the high-frequency condition. This compensation will break down at high modulation frequencies, because these will be strongly attenuated, if many narrow auditory filters cover the carrier spectrum. In this case, a second limitation for detecting modulation comes into play, namely the absolute threshold for modulation detection. Such a threshold was introduced within the present model by the addition of internal noise to the output of each modulation filter. For a sinusoidal carrier this internal noise Dau et al.: Spectral and temporal integration
2910
FIG. 5. Simulated modulation-detection thresholds as a function of modulation frequency for the same conditions as in Figs. 3 and 4. Thresholds are indicated by filled symbols.
results in a threshold of detectability for a low-frequency amplitude modulation of about 227 dB. If, in the case of a noise carrier, the imposed modulation is strongly attenuated within one or more peripheral filters, the detectability of the modulation is not determined solely by the inherent statistics of the noise carrier but is also determined by the internal noise. As a consequence, in such a condition, some of the ~low-frequency! peripheral filters do not contribute to the information about the signal modulation leading to an increased detection threshold. Therefore, in an ‘‘extreme’’ condition as described above, namely in the case of the highest imposed modulation frequency in the lowest-frequency region, the width of the peripheral filter has an influence on modulation detection. This influence is indeed seen in the model predictions and in the experimental data for some, but not all, subjects. C. Influence of filter shape and spacing on spectral integration
In some additional simulations we investigated the influence of filter shape and filter spacing on spectral integration. These simulations were performed for a low modulation frequency of 8 Hz and involved high-frequency auditory channels of a broadband running noise carrier. Thresholds are based on 20 repeated estimates of the model. The gain resulting from the analysis of coherent modulation in several filters is a consequence of combining ~partially! independent observations. As long as external fluctuations are the limiting factor for detection, the independence 2911
J. Acoust. Soc. Am., Vol. 102, No. 5, Pt. 1, November 1997
of these observations will depend on the correlation between the carrier waveforms in these channels. The correlation depends in turn on the shape and spacing of the filters. In a first simulation, we implemented nonoverlapping rectangular filters in the model instead of filters with a Roex shape. In this situation, the carrier waveforms in the various filters are completely independent. This condition results in a threshold decrease with 3 dB per doubling of the number of analyzed filters. This is the same amount which will later be described and discussed in the context of temporal integration ~see Sec. IV B!. In a similar simulation with Roex filters overlapping as in the present model, the gain was somewhat smaller and amounted to about 2.5 dB per doubling of the number of filters ~8-dB threshold change by going from one to nine filters!. This result shows that the remaining correlation between adjacent Roex filters has a small, but ‘‘measurable’’ effect on the threshold prediction. In a second simulation, we compared predictions for a single high-frequency filter with those for the combination of five adjacent Roex filters. These five filters either had a spacing as in the present model ~narrow spacing! or they were separated twice as much ~wide spacing!. In agreement with the previous simulation, the combination of narrower spaced filters resulted in a threshold 5.5 dB below the prediction for a single filter. In the wide-spaced condition, thresholds were an additional 1.25 dB lower. Compared with the single-filter result, the combination of widely spaced Roex filters led to a 3-dB effect per doubling of the number of filters. We thus can conclude that by allowing some overlap between adjaDau et al.: Spectral and temporal integration
2911
FIG. 6. Modulation thresholds for a sinusoidal test modulation and a pink noise ranging from 1 to 4 kHz as carrier. The lower curve in both panels shows the unmasked modulation detection thresholds as a function of modulation frequency. Each of the three peaked curves show the masked-modulation threshold 1 pattern for one of the 2-octave-wide masker-modulation bands centered at 4 Hz ~n!, 8 Hz ~L!, or 16 Hz ~,!. The left panel shows data from Houtgast ~1989!. The right panel shows predictions with the multi-channel model.
cent filters, the observations in these filters are not statistically independent. By using a wider spacing, the information gain from combining a certain number of filters is larger. However, with a wider spacing, the number of filters that could be placed within a given spectral range would decrease. This decrease in the number of observations would affect thresholds more strongly than the gain from the statistical independence, so that the spacing used in the present model makes better use of the available information than a wider spacing would. Finally, we checked whether an even narrower spacing of filters would change the model predictions. This was done for one of the conditions from Eddins ~1993! described in the previous section. The carrier was a bandlimited noise ranging from 2800 to 4400 Hz. In the first simulation, modulation analysis was performed with Roex filters overlapping at their 23-dB points. In a second simulation, the spectral density and thus the total number of analyzed filters was increased by a factor of 3. Both simulations led to the same threshold prediction. In summary, the additional simulations show that the chosen overlap between adjacent filters allows a close to optimal detection of modulation imposed on a broadband noise carrier with a minimal computational load ~i.e., the smallest number of analyzed auditory channels!. D. Predictions for modulation masking using broadband noise carriers
Houtgast ~1989! adopted a classical masking paradigm for investigating frequency selectivity in the modulationfrequency domain: the detectability of test modulation in the presence of masker modulation, as a function of the spectral difference between test and masker modulation. The carrier in all his experiments was a pink noise with a spectrum level in the 1-kHz region of about 25 dB SPL. After applying the modulation, the carrier was bandpass filtered between 1 and 4 kHz and added to unmodulated pink noise with a complementary ~bandstop! spectrum. The masking patterns ~of the first experiment! were obtained for each 2912
J. Acoust. Soc. Am., Vol. 102, No. 5, Pt. 1, November 1997
of three 21-octave-wide bands of noise as the modulation masker. The carrier noise was multiplied both with the masker and the target modulator waveform. Center frequencies for the masker modulation were 4, 8, or 16 Hz. The left panel of Fig. 6 shows the resulting masking patterns from that study. The three curves show a peaked characteristic: The amount of masking decreases for increasing frequency difference between test modulation and masker modulation. The lower curve in the figure shows the unmasked modulation detection threshold level as a function of modulation frequency. For details about the experimental setup, stimuli and procedure, see Houtgast ~1989!. The right panel of Fig. 6 shows results from simulations obtained with the multi-channel version of the modulation filterbank model. Instead of using notched noise surrounding the carrier, we forced the model to only analyze auditory filters with center frequencies between 1 and 4 kHz, which should have the same effect with respect to off-frequency listening. The simulated thresholds for the unmasked condition are systematically lower than the experimental data from Houtgast. This might be caused by the different presentation of the masker and by differences in the applied threshold estimation procedure. Besides this systematic difference of about 2–5 dB, both the unmasked thresholds and the masked threshold in both panels agree very well with each other. The simulated masked patterns show the same peaked characteristic, with less masking for increasing frequency difference between test and masker modulation. An additional observation can be made from the unmasked modulation threshold data in Fig. 6. The difference between the experimental thresholds at 4 and 64 Hz amounts to about 11 dB. This is much more than observed in corresponding measurements with a white-noise carrier ~cf. Figs. 3 and 4 in Sec. III B!. Interestingly, a similar difference between white and pink noise is also observed in simulations. When the experimental condition of Houtgast is simulated with a white-noise carrier, thresholds at 4-Hz modulation are the same as for pink noise. The increase between 4 and 64 Hz is, however, smaller for white noise and amounts to about Dau et al.: Spectral and temporal integration
2912
FIG. 7. 8-Hz modulation-detection thresholds as a function of the relative masker-modulation level with the masker-modulation band centered at 8 Hz. Left panel: data from Houtgast ~1989!. Right panel: corresponding predictions of the modulation filterbank model. The dashed lines represent the unmasked detection threshold of the test modulation.
7 dB. At present there is no simple explanation for this influence of the masker’s spectral shape on the TMTF. As in the study of Houtgast ~1989!, the effect of a reduction of the masker-modulation level was investigated for one of the conditions from Fig. 6 ~the 8-Hz modulation frequency for the noise band centered at 8 Hz!. The maskermodulation level used to obtain the middle threshold function in Fig. 6 was reduced by 5 and 10 dB, respectively. The effect on the model prediction is shown in Fig. 7 ~right panel!. The reduction of the threshold level amounts to 9 dB and is slightly smaller than the reduction of the maskermodulation level ~10 dB! and 2 dB smaller than the effect observed in the data by Houtgast ~11 dB!. To further test the ability of the modulation filterbank model to account for modulation masking data, the effect of varying the bandwidth of the modulation masker was investigated. Thresholds were obtained for a test modulation frequency of 8 Hz for various values of the bandwidth of the masker modulation. The center frequency and the spectral density within the passband were kept constant. Figure 8 shows results from the study of Houtgast ~1989! ~left panel!
and model predictions obtained with the present model ~right panel!. Houtgast ~1989! found that for small bandwidths, the modulation thresholds increased by 3 dB for each doubling of the masker-modulation bandwidth, whereas for large bandwidths, the threshold remained constant. He proposed that the modulation-detection threshold is associated with a constant signal-to-noise ratio within a filter centered on the test-modulation frequency. To a first approximation, indicated by the two straight lines in the left panel of Fig. 8, he suggested a width of the modulation filter of 21 –1 oct.3 In the present model, the modulation filter centered at 8 Hz has a bandwidth of 5 Hz. This bandwidth lies exactly in the range of 21 –1 octave that was suggested by Houtgast. The model predicts an increase in threshold of about 6 dB between 81 and 12 octave of modulation-masker bandwidth. For modulation-masker bandwidths larger than a 21 oct, it predicts an almost constant threshold. This is in agreement with the data of Houtgast. Thus modulation masking is only effective within a ‘‘critical’’ band around the test-modulation frequency.
FIG. 8. 8-Hz modulation-detection thresholds as a function of the bandwidth of the masker-modulation noise centered at 8 Hz. Left panel: data from Houtgast ~1989!. Right panel: corresponding predictions of the modulation filterbank model. 2913
J. Acoust. Soc. Am., Vol. 102, No. 5, Pt. 1, November 1997
Dau et al.: Spectral and temporal integration
2913
FIG. 9. Measured TMTFs of two subjects using broadband noise as a carrier. Parameter is the duration of the imposed test modulation. Carrier: 0–6 kHz; Level: 65 dB SPL; Modulation duration: s: 400 ms; L: 200 ms; n: 100 ms; h: 50 ms; ,: 25 ms; : 12.5 ms; 3: 6.25 ms; Subjects: TD ~left panel!; AS ~right panel!.
The results from these simulations support the hypothesis that the envelope fluctuations of the stimuli are processed by modulation-frequency selective channels. E. Temporal integration in modulation detection
Thresholds for detecting sinusoidal amplitude modulation of a wide-band noise carrier ~low-pass filtered at 6 kHz! were measured and simulated as a function of the duration of the modulating signal. The experimental design was chosen according to the study of Sheft and Yost ~1990!. The carrier was gated with a duration that exceeded the duration of modulation by the combined stimulus rise and fall times. Stimuli were shaped by a 25.6-ms rise–fall time. The combinations of modulation frequency and numbers of modulation cycles for each condition are listed in Table I in Sheft and Yost ~1990!. Because modulation was restricted to the constant-amplitude portion of the carrier ~thus excluding the ramps!, stimulus duration was always 51.2 ms longer than the modulation duration listed in the table ~see Sheft and Yost, 1990!. Figure 9 shows the experimental data of two subjects. The modulation depth at threshold is plotted as a function of the modulation frequency. The parameter is the modulation duration. The data agree very well with those from Sheft and Yost ~1990!. The curves represent the ‘‘classical’’ broadband TMTF often described in other studies ~e.g., Viemeister, 1979; Formby and Muir, 1988!. The data show somewhat increased thresholds for the two lowest modulation frequencies, f mod52.5 and 5 Hz. This is caused by the ‘‘gating’’ of the carrier in this experiment in contrast to experiments where the carrier was presented continuously, as discussed in previous studies ~e.g., Viemeister, 1979; Sheft and Yost, 1990!.4 For modulation frequencies between 5 and 40 Hz, the thresholds are roughly constant. They increase slightly between 40 and 80 Hz and at a rate of approximately 3 dB/octave for higher modulation frequencies. Figure 10 shows the corresponding simulated thresholds obtained with the modulation filterbank model. The ordinate indicates modulation depth at threshold and the abscissa rep2914
J. Acoust. Soc. Am., Vol. 102, No. 5, Pt. 1, November 1997
resents modulation frequency. The simulated threshold pattern is in very good agreement with the pattern found in the measured data. It shows increased thresholds for the two lowest modulation frequencies, 2.5 and 5 Hz, leading to a bandpass characteristic of the threshold function for the two greatest durations of 200 and 400 ms. This is caused by the dynamic properties of the adaption model ~Pu¨schel, 1988; Dau et al., 1996a!. The feedback loops of the adaptation model produce a considerable overshoot at the carrier onset that decreases the detectability of the signal modulation especially at very low modulation rates ~see discussion in Viemeister, 1979; Sheft and Yost, 1990!.5 The time constants derived from temporal integration per unit duration are in very good agreement with those found in the measured data. The model therefore accounts for the long effective integration time constants whose values are much larger than the time constants indicated by the ‘‘resolution data’’ ~Sheft and Yost, 1990; Viemeister, 1979!. IV. DISCUSSION
In this study the performance of the modulation filterbank model was described with respect to spectral and tem-
FIG. 10. Simulated TMTFs obtained with the current model for the same conditions as in Fig. 9. Dau et al.: Spectral and temporal integration
2914
poral integration in amplitude modulation detection. Several ‘‘critical’’ experiments were performed or taken from the literature and model predictions were compared with experimental data. As an extension to the single-channel model proposed in Dau et al. ~1997!, in which the concept of the modulation filterbank was established and the parameters of the modulation filters were fitted to data for narrow-band carriers, the modulation analysis was applied to broadband conditions. In this multi-channel version of the model, the temporal envelopes of the stimuli were processed by the same modulation filterbank in parallel at the output of each stimulated peripheral filter and the decision device combined all filter outputs linearly. A. Spectral integration
In the modulation-detection conditions considered in this study using stochastic noise carriers and signal modulation, which is coherent across auditory filters, peripheral filtering generally does not limit the ability to detect modulation. This has been interpreted in some former studies as the observers’ ability to increase their effective bandwidth in detecting wideband signals ~Green, 1960; Bos and de Boer, 1966; Schacknow and Raab, 1976!. As already discussed by Viemeister ~1979!, the mechanism behind such a combination and the stage of processing where it occurs are still unclear. It has been suggested in the literature ~Green and Swets, 1966! that in detection experiments with multicomponent signals, combination probably occurs at a high level: The observer can combine information nearly optimally from widely spaced critical bands. This model approach was adopted within the current study and may be denoted as an ‘‘auditory-filter-based approach.’’ In contrast, in models for modulation-detection conditions, it has been previously assumed that the combination of peripheral filter outputs occurs at a very early stage of processing ~Viemeister, 1979; Berg, 1996!. In this context, the model proposed by Viemeister ~1979! that includes a wide predetection bandpass filter (D f 52000 Hz) followed by a nonlinearity and a low-pass filter, can account for modulation detection data using ~broadband! noise as the carrier. This model approach may be denoted as ‘‘predetection-filter approach.’’ For low modulation frequencies and broadband carriers, it is difficult to discriminate between such a predetection-filter approach and the auditory-filter-based approach. Furthermore, it is not possible to discriminate whether there is one ‘‘large’’ modulation filterbank behind the combined outputs of all peripheral channels ~cf. Yost et al., 1989! or, alternatively, whether there is a modulation filterbank that separately analyzes the output of each peripheral channel before the information is combined. An argument in favor of the auditory-filter-based approach is that the bandwidth of the predetection filter of the Viemeister model is larger than the critical band estimates for most of the auditory range. This latter approach therefore fails to describe the data in an appropriate way for conditions in which spectral resolution of the auditory system plays any role. The present model gives a more general description of the processing of modulation in the auditory system and is also applicable to 2915
J. Acoust. Soc. Am., Vol. 102, No. 5, Pt. 1, November 1997
spectral-masking conditions, as was shown in Verhey and Dau ~1996!. One of the main results of this study is that all the data could be described in terms of masking phenomena in the modulation-frequency domain. Analogous to the results described in Dau et al. ~1997!, thresholds are mainly determined by the amount of the inherent modulation power of the specific noise carrier that falls into the transfer range of the modulation filter tuned to the test modulation frequency. The model can therefore account for the experimental findings of Eddins that time constants derived from the TMTF do not vary with changing frequency region and decrease with increasing stimulus bandwidth. Note, however, that this model does not support the notion of one resolution time constant derivable from the data because the low-pass characteristic in the modulation data for broadband noise is not caused by a corresponding ‘‘low-pass weighting’’ of fast envelope fluctuations by the auditory system. Instead, the data are explained in terms of the interaction of stimulus power in the modulation-frequency region and the scaling of the modulation filters.6 We want to add that, recently, Strickland and Viemeister ~1997! have pointed out that the effective change of time constant with carrier bandwidth in Eddins’ experiment might be an artifact caused by the stimulus generation procedure. They showed experimentally that without the bandlimitation after filtering the dependence of the time constant on the carrier bandwidth is strongly reduced. B. Temporal integration
The phenomenon of temporal integration refers to the fact that, over a range of durations, thresholds decrease with increasing signal duration. Several models have been suggested in the literature that describe the phenomenon of temporal integration. For example, to describe the threshold function observed in typical test-tone integration data, an integration process is assumed that occurs over relatively long time periods, i.e., of the order of several hundred milliseconds. The most prominent approach is the energy detection model ~Green, 1960; Green and Swets, 1966! in which decisions are based on the power of the input integrated over a fixed time period. Another class of models assumes a shorter integration time to account for temporal resolution, such as modulation detection ~Viemeister, 1979!, gap detection ~Forrest and Green, 1987!, and temporal aspects of nonsimultaneous masking ~Moore et al., 1988; Oxenham and Moore, 1994!. The discrepancy between these two modeling strategies is often described as illustrating the ‘‘resolutionintegration’’ paradox ~de Boer, 1985!. In recent studies, however, it has been argued that the disparity between the integration and the resolution time constants is not a real problem ~Viemeister and Wakefield, 1991!. They pointed out that the observation of a 3-dB decrease in threshold for each doubling of duration—as seen in typical test-tone integration data—means that the auditory system behaves as if perfect power integration occurs but that the system is not necessarily performing the operation of mathematical integration. Therefore it might be important to distinguish between the phenomenon of temporal integration and the process that accounts for the phenomenon. ViemeisDau et al.: Spectral and temporal integration
2915
FIG. 11. Thresholds of a pair of tones separated by 100 ms as a function of the relative level of the intervening noise ~cf. Viemeister and Wakefield, 1991!. Thresholds for either the first or the second tone pulse alone are included for comparison. Squares: first pulse only; circles: second pulse only; triangles: pulse pair. Pulse~s!: 10 ms, 1 kHz, presented during 10-ms gaps in a steady-state noise masker. During the 50-ms interval centered between the gaps, the noise level was either incremented by 6 dB, decremented by 6 dB, or left unchanged. Noise level: 40-dB spectrum level ~measured at 1 kHz!. Left panel: experimental data from Viemeister and Wakefield ~1991!. Right panel: corresponding simulated thresholds on the basis of the present model.
ter and Wakefield ~1991! provided evidence that integration with a long time constant, such as proposed by the classical models, does not occur in all situations of auditory processing. They showed that the threshold for a pair of short pulses yields classic power integration only for pulse separations of less than 5–10 ms. For longer separations, the thresholds did not change with separation and the pulses appeared to be processed independently ~cf. Zwislocki et al., 1962!. In a second experiment, Viemeister and Wakefield ~1991! showed that the threshold for a pair of tone pulses was lower than for a single pulse, indicating some type of integration, but was not affected by level changes of the noise which was presented between the two pulses. The experimental results from that study are plotted in the left panel of Fig. 11. It shows the average thresholds for the first pulse alone ~squares!, the second pulse alone ~circles!, and for the pulse pair ~triangles! as a function of the relative level of the intervening noise. The thresholds for the first pulse alone do not depend on the noise level. There is a slight increase in threshold for the second pulse reflecting forward masking. The thresholds for the pulse pair are about 2.5 dB lower than those for either pulse alone and do not depend on the level of the intervening noise ~for details see Viemeister and Wakefield, 1991!. These data cannot be explained by long-term integration. Furthermore, as discussed by Viemeister and Wakefield ~1991!, the results of this second experiment are also inconsistent with the model proposed by Penner ~1978!. Penner showed that a compressive nonlinearity followed by a shorttime constant integration can result in long effective integration. However, such a model—as an example of the class of ‘‘single-look’’ integration models—would predict a certain change in threshold depending on the energy of the noise between the two pulses, since the lower threshold for a pulse pair compared to that for the single pulse requires integration at least over the time of separation of the two pulses. To account for the data, Viemeister and Wakefield ~1991! proposed a ‘‘multiple-look’’ model. With such a 2916
J. Acoust. Soc. Am., Vol. 102, No. 5, Pt. 1, November 1997
model, ‘‘looks’’ or samples from a short-time constant process are stored in memory and can be processed ‘‘selectively,’’ depending on the task. The short-time constant allows the model, in principle, to account for temporal resolution data. The combination of a short-time constant and selective processing allows the model to also account for the data from the pulse pair experiment described above. The authors suggested that in temporal integration tasks, the long effective time constants may result from the combination of information from different looks, not from true long-term integration. However, there are some open questions with regard to the multiple-look model proposed by Viemeister and Wakefield ~1991!. A very basic question is concerned with what is meant by a ‘‘look.’’ The authors discuss the question of whether a look may be considered as a sample from the envelopelike waveform from the short temporal window that defines a look. But what is the shape of such a window? What about the correlation between successive looks or samples and how are these looks or samples combined to arrive at a decision statistics? The predicted temporal integration function described in the study of Viemeister and Wakefield ~1991! depends strongly on how the looks are weighted and combined. Nevertheless, the basic concept of the multiple-looks approach is to take into account that the observer attempts to use all the samples from the observation interval. For the detection of a tone, for example, an increase in the duration of the tone increases the number of samples and results in an improvement in performance. The model proposed in the present study contains an optimal detector as a decision device. The detection process can be considered as a ‘‘matched filtering’’ process as already described in Dau et al. ~1996a!. This implies that a variable time constant is available that is matched to the signal duration, dependent on the specific task, i.e., the model has at its disposal a continuum of time constants. The integration of the cross correlator is similar to the classic notion of temporal integration, but no fixed integration time constant is necessary for long-term integration. Dau et al.: Spectral and temporal integration
2916
It is the temporal extension of the template which automatically determines the weighting of stimuli across time. Thus our implementation is effectively close to the ‘‘multiplelook’’ strategy discussed by Viemeister and Wakefield ~1991!. Time constants that are related to the ‘‘hard-wired’’ part of signal processing within the model represent a lower limit of temporal acuity. ~The term ‘‘hard-wired’’ is used in the sense that this part of signal processing is assumed to be independent of the specific experimental task.! The modulation filterbank represents a set of time constants that are, however, too short to account for the long-term integration data. Thus it is the decision device that inherently accounts for the long effective time constants. This agrees well with the considerations by Viemeister and Wakefield ~1991! that different strategies are probably being employed, and different capabilities tapped, in resolution and integration tasks. The resolution task seems to use more ‘‘peripheral’’ processes whereas temporal integration may require higher level processes such as multiple sampling and probability summation. To that extent, assuming that the decision process occurs at a higher level of auditory processing, there is a certain correspondence between the modeling strategy of the present model and that suggested in the ‘‘multiple-look’’ model. The current approach may therefore be considered as an alternative strategy to the multiple-look model. This correspondence is supported by the model predictions for the experiment of Viemeister and Wakefield, which are shown in the right panel of Fig. 11. Our model predicts a 3-dB decrease in threshold for the pulse pair compared to the threshold for a single pulse. Such a result is expected if the psychometric function for detection of pure tones in noise and in quiet can be described by: d 8 5m(E/N 0 ) k , where d 8 is the normalized sensitivity index, E is signal power, N 0 is the spectral noise power density, and k and m represent ‘‘individual’’ parameters. For ideal observers, the parameter k has the value 0.5 ~cf. Green and Swets, 1966!, leading to a 3-dB decrease in threshold for the pulse pair compared to that for a single pulse. According to Egan et al. ~1969!, the psychometric function for normal hearing subjects can be described more accurately with a value k'1 instead of 0.5. Such a value would lead to a 1.5-dB instead of 3-dB lower threshold for the pulse pair than for a single pulse, as was discussed by Viemeister and Wakefield ~1991!. Long effective time constants occur both in typical testtone integration and in the modulation integration examined in the present study. Whereas the decision device is responsible for the shift of the TMTF with changing signal duration, from which an integration time constant can be derived, it is the scaling of the modulation filterbank that determines the form of the TMTF, from which a resolution time constant is commonly derived. As discussed in the section about spectral integration in modulation detection, the threshold is determined mainly by the portion of the modulation power of the broadband noise carrier that is processed by the modulation filters tuned to the signal modulation frequency. C. Future extensions of the model
Generally, all predicted thresholds shown in this paper lie between 2 and 5 dB lower than the experimental data. 2917
J. Acoust. Soc. Am., Vol. 102, No. 5, Pt. 1, November 1997
This shift indicates that there must be a certain loss of information in the auditory processing of modulation ~independent of modulation rate! that is not at present accounted for in the model. Further modeling efforts are required to understand this discrepancy, that cannot be explained by simply increasing the variance of the internal noise, since thresholds are mainly determined by the external statistics of the stimuli.7 The present model does not cover conditions which require some processes of across-channel comparison. Such across-critical-band processing of temporally modulated complex stimuli might occur in, for instance, comodulation masking release ~CMR! ~Hall, 1987!, comodulation detection difference ~CDD! ~McFadden, 1987; Cohen and Schubert, 1987!, and modulation detection interference ~MDI! ~Yost and Sheft, 1989!. In these cases the auditory system seems to be looking across frequency channels that contain temporally modulated stimuli. Concerning conditions of MDI, Yost et al. ~1989! suggested a ‘‘large’’ modulation filterbank in which information about modulations of comparable rates are combined across the whole frequency range. Such an approach appears interesting. However, to simultaneously ensure the possibility of predicting spectral masking, it appears necessary to process a certain low-frequency part of the modulation spectrum including the dc-component separately within each peripheral channel, because this component represents the energy. Higher rate modulation may be combined within one large modulation filterbank. This, of course, should be tested in further studies in this field. In order to predict performance for these types of experiments ~as well as binaural masking experiments!, additional stages would have to be included that calculate, for instance, the correlation between the envelopes of different frequency regions ~or the two ears!. Such stages have not been systematically evaluated within the framework of this study ~for a first result on binaural masking, see Holube et al., 1995a, b!. However, using the present model as a preprocessing circuit, it might be easier to find realistic across-channel processing stages that also allow correct prediction for conditions in which across-channel processing is not needed.
V. CONCLUSIONS
The multi-channel modulation filterbank model described in this study can predict a wide variety of experimental conditions, including spectral and temporal integration of modulation detection and modulation masking with broadband carriers. ~1! Spectral integration is accounted for by combining the detection cues from all auditory filters with an optimal decision statistic. ~2! Temporal integration is accounted for by the variable length of the template that forms the basis of the optimal detector incorporated in the model. ~3! The combination of the modulation filterbank concept and the optimal decision algorithm presents a powerful strategy for describing modulation detection phenomena in narrow-band and broadband conditions. Dau et al.: Spectral and temporal integration
2917
ACKNOWLEDGMENTS
We would like to thank all our colleagues of the Graduiertenkolleg Psychoakustik at the University of Oldenburg for fruitful discussions on the content of this paper. We also thank Brian Moore, Jesko Verhey, Andrew Oxenham, Stefan Mu¨nkner, and Ralf Fassel for their comments and suggestions concerning this study and for their critical reading of earlier versions of this paper. The two anonymous reviewers also provided very constructive criticism. 1
The implementation described in this paper represents one of two slightly different modulation filterbank models that were developed and tested in parallel at the universities of Oldenburg and Go¨ttingen. While this paper concentrates on conditions relevant in the context of modulation perception, the paper by Mu¨nkner and Kohlrausch ~1997! focuses on other measures of temporal processing such as gap detection and forward masking. 2 This statement from Maiwald ~1967b! is in contrast to some data shown in his thesis ~Maiwald, 1966, Fig. 26!. This figure shows that modulationdetection thresholds obtained with a noise carrier ranging from 0 to 16 kHz are about 3 dB lower than those for a carrier ranging from 6.5 to 16 kHz @modulation-detection thresholds expressed as 20 log(m)#. 3 These results of Houtgast are in contrast with data from a later study by Grantham and Bacon ~1991! who were not able to replicate Houtgast’s bandwidening results, despite increasing the bandwidth by two octaves. The authors concluded from their study that the effects observed in modulation-masking experiments may be explained on the basis of some kind of temporal pattern discrimination and not on a critical modulation band filtering process. As the authors state, however, it is possible that different methods of producing the noise modulators and of combining noise and signal may account for the discrepancy between their results and those of Houtgast ~1989!. 4 It is assumed that adaptation effects are responsible for this effect, reflecting the temporal relationship between the carrier onset and the onset of modulation. The carrier onset produces a change in the level of the internal representation that is large relative to the changes produced by the sinusoidal modulation and might therefore interfere with the detection of the modulation, especially at low modulation frequencies ~Viemeister, 1979!. 5 Sheft and Yost ~1990! found that even when presenting the carrier with a fixed duration that included a 500-ms carrier fringe preceding the onset of modulation, threshold patterns exhibit a bandpass characteristic. The adaptation model of Pu¨schel ~1988! would not account for such a long-term adaptation effect. 6 If frozen-noise carriers were used simulated thresholds obtained with the present model would be mainly determined by the statistics of the internal noise ~added after the nonlinear processing!. This would lead to significantly lower thresholds than for running-noise carriers. Threshold differences between both types of carriers observed in our own experimental data appear to depend on carrier bandwidth, with a large effect at very small bandwidths and a decreasing difference with increasing bandwidth. Studies on capabilities and limitations of the present model in conditions with frozen-noise carriers are currently in progress. 7 The amount of the variance of the internal noise was determined in a simulation on intensity discrimination with deterministic stimuli to satisfy Webers law. A simple increase of the amount of internal noise necessary to compensate the observed 2–5 dB discrepancy in the present study would lead to a completely unrealistic threshold prediction in the calibration condition. Berg, B. G. ~1996!. ‘‘On the relation between comodulation masking release and temporal modulation transfer functions,’’ J. Acoust. Soc. Am. 100, 1013–1024. Boer, E. de ~1985!. ‘‘Auditory Time Constants: A Paradox?’’ in Time Resolution in Auditory Systems, edited by A. Michelsen ~Springer-Verlag, Berlin!, pp. 141–158. Bos, C. E., and Boer, E. de ~1966!. ‘‘Masking and discrimination,’’ J. Acoust. Soc. Am. 39, 708–715. Cohen, M. F., and Schubert, E. T. ~1987!. ‘‘The effect of cross-spectrum correlation on the detectability of a noise band,’’ J. Acoust. Soc. Am. 81, 721–723. Dau, T. ~1996!. ‘‘Modeling auditory processing of amplitude modulation,’’ Doctoral thesis, University of Oldenburg. 2918
J. Acoust. Soc. Am., Vol. 102, No. 5, Pt. 1, November 1997
Dau, T., Pu¨schel, D., and Kohlrausch, A. ~1996a!. ‘‘A quantitative model of the ‘‘effective’’ signal processing in the auditory system: I. Model structure,’’ J. Acoust. Soc. Am. 99, 3615–3622. Dau, T., Kollmeier, D., and Kohlrausch, A. ~1997!. ‘‘Modeling auditory processing of amplitude modulation: I. Detection and masking with narrowband carriers,’’ J. Acoust. Soc. Am. 102, 2892–2905. Dau, T., Pu¨schel, D., and Kohlrausch, A. ~1996b!. ‘‘A quantitative model of the ‘‘effective’’ signal processing in the auditory system: II. Simulations and measurements,’’ J. Acoust. Soc. Am. 99, 3623–3631. Eddins, D. ~1993!. ‘‘Amplitude modulation detection of narrow-band noise: Effects of absolute bandwidth and frequency region,’’ J. Acoust. Soc. Am. 93, 470–479. Egan, J. P., Lindner, W. A., and McFadden, D. ~1969!. ‘‘Masking-level differences and the form of the psychometric function,’’ Percept. Psychophys. 6, 209–215. Formby, C., and Muir, K. ~1988!. ‘‘Modulation and gap detection for broadband and filtered noise signals,’’ J. Acoust. Soc. Am. 84, 545–550. Forrest, T. G., and Green, D. M. ~1987!. ‘‘Detection of partially filled gaps in noise and the temporal modulation transfer function,’’ J. Acoust. Soc. Am. 82, 1933–1943. Grantham, D. W., and Bacon, S. P. ~1991!. ‘‘Binaural modulation masking,’’ J. Acoust. Soc. Am. 89, 1340–1349. Green, D. M. ~1960!. ‘‘Auditory detection of a noise signal,’’ J. Acoust. Soc. Am. 32, 121–131. Green, D. M., and Swets, J. A. ~1966!. Signal Detection Theory and Psychophysics ~Wiley, New York!. Hall, J. W., III ~1987!. ‘‘Experiments on comodulation masking release,’’ in Auditory Processing of Complex Sounds, edited by W. A. Yost and C. S. Watson ~Erlbaum, Hillsdale, NJ!. Holube, I., Colburn, H. S., van de Par, S., and Kohlrausch, A. ~1995a!. ‘‘Model simulations of masked thresholds for tones in dichotic noise maskers,’’ J. Acoust. Soc. Am. 97, 3411–3412. Holube, I., Colburn, H. S., van de Par, S., and Kohlrausch, A. ~1995b!. ‘‘Simulationen der Mitho¨rschwellen von Testto¨nen in dichotischen Rauschmaskierern,’’ Fortschritte der Akustik, DAGA ’95, pp. 783–786. Houtgast, T. ~1989!. ‘‘Frequency selectivity in amplitude-modulation detection,’’ J. Acoust. Soc. Am. 85, 1676–1680. Lawson, J. L., and Uhlenbeck, G. E. ~1950!. Threshold Signals, Volume 24 of Radiation Laboratory Series ~McGraw-Hill, New York!. Maiwald, D. ~1966!. ‘‘Zusammenhang zwischen Mitho¨rschwellen und Modulationsschwellen,’’ Doctoral thesis, Technical University of Mu¨nchen. Maiwald, D. ~1967a!. ‘‘Ein Funktionsschema des Geho¨rs zur Beschreibung der Erkennbarkeit kleiner Frequenz- und Amplitudena¨nderungen,’’ Acustica 18, 81–92. Maiwald, D. ~1967b!. ‘‘Die Berechnung von Modulationsschwellen mit Hilfe eines Funktionsschemas,’’ Acustica 18, 193–207. McFadden, D. ~1987!. ‘‘Comodulation detection differences using noiseband signals,’’ J. Acoust. Soc. Am. 81, 1519–1527. Moore, B. C. J., Glasberg, B. R., Plack, C. J., and Biswas, A. K. ~1988!. ‘‘The shape of the ear’s temporal window,’’ J. Acoust. Soc. Am. 83, 1102–1116. Mu¨nkner, S., and Kohlrausch, A. ~1997!. ‘‘Simulations of temporal resolution and integration experiments using a modulation filterbank model’’ ~in preparation!. Oxenham, A. J., and Moore, B. C. J. ~1994!. ‘‘Modeling the additivity of nonsimultaneous masking,’’ Hearing Res. 80, 105–118. Patterson, R. D., Nimmo-Smith, I., Holdsworth, J., and Rice, P. ~1987!. ‘‘An efficient auditory filterbank based on the gammatone function,’’ in Paper presented at a meeting of the IOC Speech Group on Auditory Modelling at RSRE, 14–15 December. Penner, M. J. ~1978!. ‘‘A power law transformation resulting in a class of short-term integrators that produce time-intensity trades for noise bursts,’’ J. Acoust. Soc. Am. 63, 195–201. Pu¨schel, D. ~1988!. ‘‘Prinzipien der zeitlichen Analyse beim Ho¨ren,’’ Doctoral thesis, University of Go¨ttingen. Rodenburg, M. ~1972!. ‘‘Sensitivity of the auditory system to differences in intensity,’’ Doctoral thesis, Medical Faculty of Rotterdam. Rodenburg, M. ~1977!. ‘‘Investigations of temporal effects with amplitude modulated signals,’’ in Psychophysics and Physiology of Hearing, edited by E. F. Evans and J. P. Wilson ~Academic, London!, pp. 429–437. Schacknow, P. N., and Raab, D. H. ~1976!. ‘‘Noise-intensity discrimination: Dau et al.: Spectral and temporal integration
2918
Effects of bandwidth conditions and mode of masker presentation,’’ J. Acoust. Soc. Am. 60, 893–905. Schreiner, C., and Langner, G. ~1988!. ‘‘Periodicity coding in the inferior colliculus of the cat. I. Neuronal mechanism,’’ J. Neurophysiol. 60, 1799– 1822. Sheft, S., and Yost, W. ~1990!. ‘‘Temporal integration in amplitude modulation detection,’’ J. Acoust. Soc. Am. 88, 796–805. Strickland, E. A., and Viemeister, N. F. ~1997!. ‘‘The effects of frequency region and bandwidth on the temporal modulation transfer function,’’ J. Acoust. Soc. Am. 102, 1799–1810. van Zanten, G. A. ~1980!. ‘‘Temporal modulation transfer functions for intensity modulated noise bands,’’ in Psychophysical and Behavioral Studies in Hearing, edited by G. van den Brink and F. A. Bilsen ~Delft U.P., Delft, The Netherlands!, pp. 206–209. Verhey, J. L., and Dau, T. ~1996!. ‘‘Simulations of spectral masking with a model incorporating an optimal decision strategy,’’ in Psychoacoustics,
2919
J. Acoust. Soc. Am., Vol. 102, No. 5, Pt. 1, November 1997
Speech, and Hearing Aids, edited by B. Kollmeier ~World Scientific, Singapore!, pp. 29–34. Viemeister, N. F. ~1977!. ‘‘Temporal factors in audition: a system analysis approach,’’ in Psychophysics and Physiology of Hearing, edited by E. F. Evans and J. P. Wilson ~Academic, London!, pp. 419–427. Viemeister, N. F. ~1979!. ‘‘Temporal modulation transfer functions based upon modulation thresholds,’’ J. Acoust. Soc. Am. 66, 1364–1380. Viemeister, N. F., and Wakefield, G. H. ~1991!. ‘‘Temporal integration and multiple looks,’’ J. Acoust. Soc. Am. 90, 858–865. Yost, W. A., and Sheft, S. ~1989!. ‘‘Across critical band processing of amplitude modulated tones,’’ J. Acoust. Soc. Am. 85, 848–857. Yost, W. A., Sheft, S., and Opie, J. ~1989!. ‘‘Modulation interference in detection and discrimination of amplitude modulation,’’ J. Acoust. Soc. Am. 86, 2138–2147. Zwislocki, J. J., Hellman, R. P., and Verillo, R. T. ~1962!. ‘‘Threshold of audibility for short pulses,’’ J. Acoust. Soc. Am. 34, 1648–1652.
Dau et al.: Spectral and temporal integration
2919