b) Analysis of the propagation in high and medium voltage cables by measurement and FDTD calculation. c) Simulation of the PD propagation in a cable joint.
497
ELECTROMAGNETIC FINITE DIFFERENCES TIME DOMAIN (FDTD) MODELING OF PARTIAL DISCHARGE COUPLING APPLIED TO HIGH VOLTAGE CABLES AND CABLE JOINTS 1
D. Pommerenke ,R. Jobava
2
, R. Heinrich 3
1
Hewlett Packard,USA 2Tbilisi State University, Rep. of Georgia 3Technical University Berlin, Germany
A cascade of breakdowns in a series of 150 kV terminations on one day in 1993 caused a major blackout in the Netherlands (1). Recently 240 kV cable joints failed in Singapore. In most every case, partial discharge is a predecessor to breakdown of polymer insulation and monitoring critial cable links will significantly reduce the risk of such event. For monitoring cable systems, PD detection needs to be sensitive and reliable. Hereby, reliability is defined as the ability to distinguish between noise (e.g., PD from GIS) and PD internal to the cable accessory, to detect PD independent of its location within the monitored accessory and to quantify PD in such a way that a standard measurement system would detect similar quantities. Different methods like capacitive, inductive, galvanic or directional coupling have been applied for sensoring PD signals in HV cables and their accessories (2,3,4). But their abilities and drawbacks for achieving sensitive and reliable measurements has not been evaluated in sufficient detail. In spite being used in on-line cable systems, sensoring methods for PD on cable joints probably never have been systematically analyzed. Based on conversations with users, we realized that the users were satisfied if some output signal was measured while injecting artificial PD and little attention was given to the response of the sensor to PD internal to the joint and possible problems associated. This poses a significant risk of not detecting PD or confusing external noise (PD from a GIS system) with PD from within the cable joint. This paper helps closing this gap. It analyses the dependence of output signals from different sensors as a function of PD location using FDTD and compares their ability to quantify signals to the standard PD measurement method. Due to the complexity of the sensoring geometry, cables and cable joints and the presence of semicon layers, such an analysis can not be done with sufficient accuracy by equivalent circuits or analytically as by Judd for GIS (5). A numerical electrodynamical analysis is more promising to handle the complexity. The following steps were taken: a) Measurements of the dielectric parameters of high voltage cable semicon layers (6). b) Analysis of the propagation in high and medium voltage cables by measurement and FDTD calculation. Dielectric Materials, Measurements and Applications Conference Publication No. 473,OIEE 2000
c) Simulation of the PD propagation in a cable joint. d) Parameter optimisation and verification of the numerical model by measurement. e) Comparison of PD sensoring methods. Pulses which travel along cables are mainly attenuated by the semiconducting layers. On one hand, this diminishes the ability to detect PD at larger distances, on the other it suppresses noise and allows to monitor limited lengths of cables if the detection frequencies are high enough. For simulating the propagation the dielectric parameters of the semicon materials were measured as in ( 6 ) and using an HP8753D network analyzer. Simulation was done using Cartesian coordinates (7) and to a lesser extend, in cylindrical coordinates with and without taking dispersion (Debye model implemented as recursive convolution) into account. With reasonable accuracy the attenuation is simulated up to 500 MHz if the semicon layer is gridded by at least three grid elements. Table 1 shows results for a 15 kV XLPE cable which has been used for the following simulation and measurement results. FDTD results are shown in fig. 1.
Frequency IMHz] 10 30 100 200 500 1000
Er
Sigma
120 80 50 40 30 25
0.2 0.25 0.4 0.5 0.7 1
Ish]
498
-10
-20 -30 dB
-40
-50 -60 -70 I
-80 0
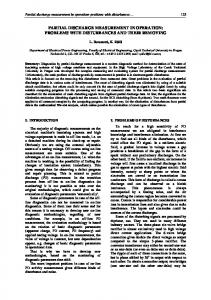
500 1000 1500 2000 frequency [MHz] Figure 1: Measured and calculated attenuation in a I 5 kV XLPE cable using FDTD (7) having an AI-foil shield. In addition, attenuations curves are shown for 1 GHz and 1.5 GHz parameters. They indicate, that an acceptable match can be achieved over a rather large frequency range without taking dispersion into account. This is important, as the cable joint simulation did use a fixed parameter set. The transition between the 50 Ohm measurement system and the high voltage cable (about 21 Ohm) was achieved by resistive networks. Some imperfections in these networks cause multiple reflections seen as ripple above 1500 M z .
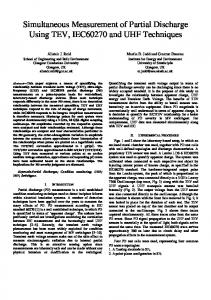
DIRECTIONAL COUPLING SENSOR Different sensor concepts have been investigated. Most of them attach directly on the cable joint. They have been modelled as part of the cable joint. In contrast, the directional coupling sensors attach to the high voltage cable. For that reason a transfer function between the high voltage PD current and the sensor output can be established without modelling the cable joint. As example, results for a directional coupling PD sensor attached to the 15 kV cable and modelled by FDTD are shown in figs. 2 and 3 . The forward coupling of the sensor can be predicted well (fig. 2), but it is much harder to predict its directivity. Negative infinity dB would indicate perfect directivity. Directivity is caused by perfect cancellation between forward and backwards travelling waves. Obviously, small errors will effect the cancellation significantly leading to a better match between simulation and measurement for the forward coupling than for the directivity.
I
I
200
I
I
400 600 800 frequency [MHz]
Figure 2: Forward coupling of a directional coupling sensor attached to the 15 kV cable having a 100 mm long, 30 mm wide electrode. Simulations are shown for different semicon material parameter sets. 10 5
dB 0 -5 -10
-15
-20 I
-25 0
I
200
400 600 frequency [MHz]
800
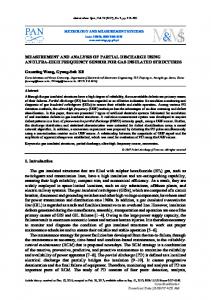
Figure 3: Directivity (ratio between forward and unwanted reverse coupling) of the directional coupling sensor. Positive numbers do not indicate gain. Instead the preferred coupling direction is inverted
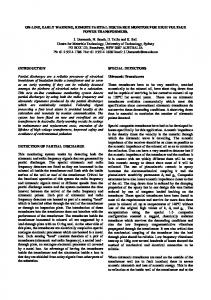
CABLE JOINT MODELED The cable joint (8) modeled is a silicon rubber 110 kV slip on joint made by Pirelli for 500 mm2 conductors. Dimensions are 865 x 172 mm. It is part of a cable joint family for up to 550 kV XLPE cables. A cross section is shown in fig. 4. Silicon rubber conductive silicon rubber
stress cone
electrostatic'shield €or the conductor connection Figure 4: Cross section of the 110 kV silicon rubber slip on cable joint shown without the cable.
DIELECTRIC PARAMETERS USED IN THE CABLE JOINT FDTD CALCULATION The following parameters were used for modeling the cable joint.
499
TABLE 2 - Dielectric parameter used for modeling the cable ioint. Epsilon Sigma I [S/m] cable PE I 2.3 I 0 semicon of the cable 1 30 I 2 silicon 1 3.2 I 0 I 90 [ 0.5 conductive silicon 5 1 0.0055 Epoxy (reference (8)) For PE and silicon manufacturers dielectric constants were used. For the epoxy a typical value (Eps 4-5) was used and the dielectric parameters of the conductive silicon were adjusted for best match between simulation and measurements. This needed to be done, as the algorithm did not take dispersion into account and an "average" parameter value was needed. Due to the short lengths of the high voltage cables in the numerical model, there is only a weak influence (1 dB) by the semiconducting PE layers for signals propagating through the cable joint. The joint was not modeled in a cross-over configuration. The joint is enclosed in metal which connects to both cable shields.
I
I
I
I
I
I
VERIFICATION OF THE NUMERICAL MODEL Trust in the simulation results has been established in two ways: 1) The transmission though the cable joint was measured in the time and frequency domain. This was compared to simulation. For the frequency domain the result is shown in fig. 5 and for the time domain in fig. 6 . Both indicate a good match. 2 ) The influence of different discretization was tested to verify that sufficient fine discretization was used. (fig. 6).
used The resonance at ISOMHz is caused by perticularities of the inner conductor connection and its shield Although no dispersion is taken into account, it was possible to reproduce the measured attenuation up to 400 h4Hz quite well. The deviation at about 30 MHz is an artifact of the FFT. After 16000 time steps the signal had not setteled completly.Three reasons are possibly causing the deviations above 420 MHz: Silicon losses. No losses within the insulating silicon were taken into account. Dispersion. Most of the losses within the joint are caused by the semiconducting silicon. Typically (6), such materials show an increase of the conductivity and a decrease of the dielectric constant with frequency. Leading to increasing losses with frequency. Thus, if dispersion would have been modeled, losses would have increased at higher frequencies. High voltage cables in the measurement. At each side of the the cable joint measured, there were about 1.7 m of high voltage cable attached. These cables cause additional losses at higher frequencies not taken into account within the simulation. To avoid errorous conclusions from the simulation by modelling errors above 400 MHz, all data were low pass filtered at 300 MHz whch still is conceived as a rather high upper cutoff frequency for most PD measurement systems. 2c 15
3 10 Y
*
5
t : 5
e
0 -5
0
0
100
200 300 frequency [MHz]
400
500
Figure 5: Measured and simulated attenuation of the cable joint. For the measurements the mismatch between the 50 Ohm measurement system and the approximately 38 Ohm 110 kV cable was taken into account by using resistive impedance matching networks. All mechanical dimensions have been modeled as good as possible within the discretization
5
10
15
20
25
time Ins] , Figure 6: Measurement compared to simulation for an impulse travelling through the cable joint using different discretization. Fig. 6 indicates sufficient discretization although full conversion may not have taken place. The simulated waveforms have some more ringing and a shorter risetime than the measured waveform. Most likely this is a result of the slightly broader pulse used in the measurement than in the simulation and by the 1.7 m high voltage cable attached to each side of the joint measured.
500
COMPARISON OF SENSORING METHODS FOR CABLE JOINT PD In addition to the directional coupling sensors at the cables, the sensoring configurations as shown in fig. 7 were investigated. Configuration A is based on (9), Configuration B is similar to the one used in the BEWAG prequalification of 400 kV XLPE cables in CESI, C is derived from A to reduce the dependence of the coupled signal from the Phi location of the PD. D is derived from B to suppress noise which propagates along the cable by taking the difference between both outputs. For each sensoring method, some individual optimization of their sensitivity (e.g. thickness of the insulating layer above the sensor) and their ability to detect PD (e.g., disruption of symmetry by asymmetric attachment of coax lines) was done prior to comparing results. Two capacitive sensors at the side
A 3 0 Ohm cables
’
One capacitive electrode
B
U electr e
Two capacitive sensors, radial split
C
h electrodes
Two capacitive sensors, longitudinal split
simulates a faulty outer semicon layer. An assembly problem experienced at a 400 kV XLPE cable system.
Figure 8: Locations of the simulated PD.
For sensor style A the PDs were close to the sensor and 180 deg away (herein named “crossed” leading to a total of 8 locations. Configuration D was treated in a similar fashion. To test the influence of symmetry on the sensor output signals PDs were located within the plane of the electrode split (configuration D) and 90 deg. to it. Note that in some situations, the electrodes are symmetric to the PD, such that no output voltage (difference of both coax cables) would be expected. As such an arrangement would be non-practical, the coax cables were placed, fig.7, such that they disturb the symmetry to provide an output signal in every situation tested. Obviously, there are infinite possible PD locations. Showing that a sensor does not fail on all positions investigated does not prove that it will work on all possible locations. But failing on one of the PD locations investigated is sufficient to rule out a sensoring concept as implemented.
RESULTS The importance of specific results depends on the users
D
interest but some examples illustrate the kind of information obtainable by this method. eiectrodes’
Estimation of the PD location by delay Figure 7 Configuration of the electrodes attached to the cable joint. In addition to this four configurations directional coupling sensors (configuration E) were attached to the high voltage cables.
PD LOCATIONS PD can occur at almost any location within the cable joint. Field distribution and practical experience guided in locating the PD sources. The interface between the PE of the cable and the silicon (Location 3) is a very critical interface. It is not only stressed by a parallel electric field but in addition, it is mounted on site. At a number of incidents PDs at this interface lead to a breakdown (1). The largest field strength occurs at the edge of the conductor connection shield (location 1). Location 4
With the knowledge of the propagation velocity through the cable joint and the time delay between the signals observed to the left and to the right of a cable joint, an estimate of the PD location can be given. The accuracy of such an estimate can be evaluated by this simulation.
501 known charge is injected into the high voltage cable and the peak voltage delivered by the sensor is measured. 1 .L
c E O
3 2.8 ns Figure 9: Currents to the left and to the right of the cable joint for PD at location 2 (left) and I (right). Currents are normalized to their peak value as this section of the paper only analyzes the delay.
... .
2.6 n s
Fig. 9, left shows the currents to the left and to the right of the cable joint for PD location 2. Knowing the average propagation velocity being 53 YO of the velocity of light and the measured delay of 2.6 ns the PD location will be estimated quite close to the actual source. But this picture changes if PD location 1 is analyzed (Fig. 9, right). Now a delay of 2.8 ns is seen. If one estimates the PD location using this delay a location on the outer stress cone is obtained, although the PD is at the conductor shield. It shows that the cable joint is too complex to understand the pulse propagation by intuition.
PD-noise discrimination A variety of methods has been proposed to distinguish between noise (herein, pulses which travel along the cable) and PD. Pulse shape or width analysis is an example which operates on the assumption that PD shows up as a single pulse, while noise tends to be, oscillating. But the simulation showed that the pulse shape seen at an output of a sensor may be totally different if the PD location is changed, fig. 10. PDnoise discrimination may fail to detect PD if based on the assumption above. All methods which tried to suppress noise by taking the difference from two sensor (Conf. A, C and D) outputs failed to detect PD in one or many PD locations. The only method which reliably distinguished between noise from the outside of the joint and PD from within the joint were the directional couplers attached to the cables (none withstanding that other methods which attach sensors to the cable may also be as efficient).
Charge estimation In a standard PD measurement, the charge injected by the PD is measured from the low (e.g., 400 kHz) component. VHF PD measurement methods need further considerations for calibrating them. Not in every case a calibration comparable to the standard measurement can be achieved. Typically a pulse of
... .
... .
-1
0
10 20 30 time [ns] Figure 10: Normalized current pulse for sensor conjiguration A caused by PD location 2 in the plane of the sensor and I80 deg. away. A meaningful calibration factor is obtained by the ratio of injected charge to the peak voltage as long as the injected pulse is narrow enough such that the waveshape of the voltage at the sensor output is the impulse response of the sensoring system. To obtain the data shown in table 3, the sensoring concepts were calibrated as outlined above obtaining a calibration factor having the unit pC/V. Next PD were simulated inside the joint and the charge they inject into the high voltage cable was calculated cable (column 2 in tab. 3). To analyze how well the different sensors estimate these charges, their output voltage was multiplied by the calibration factor obtaining a charge value. The largest value (by magnitude) was taken as the charge estimate. Table 3 normalizes these values to the charge injected into the high voltage cable (columns 37) obtaining a relative charge error. Cells having a relative charge error of more than 3 or less than 0.33 are highlighted by a grayish background. Only measurements taken at the cable (Conf E) show errors of less than 3 for all PD locations investigated. In addition, it is worth noting that all other methods estimate a wrong polarity for PD location 4 (In some cases this was a near miss, as the positive and the negative peak values were of nearly the same magnitude). Relative charge error for the sensoring methods. PD locations marked by a 'x' in column 1 are moved by 90 or 180 deg to investigate potential influence of symmetries. Besides typical results shown regarding noise suppression and the ability to calibrate sensoring concepts, the sensitivity of coupling methods and its dependence on the PD location were investigated.
502 TABLE 3 - Relative charge error for the sensoring concepts
0
0
7
Charge injected into high voltage cable
PD loc.
Charge error relative to the charge in the high voltage cable Configurations E D B A C
2.2pC
0.42
1.3
1.3
1.7
1.3
select a sensor by its best ability to distinguish between noise and PD, analyse the sensitivity as a function of PD location, possibly: determine the PD location by the detected waveforms.
ACKNOWLEDGEMENTS Dr. Weissenberg from Pirelli in Berlin, Germany supported this work in many ways. We thank him very much.
1.45
0.45
REFERENCES
I
1 pC
I
4x
0.37
1
0.63
-3
I
0.67
I
3
I
1.2
-0.6
7
DISCUSSION The simulation used gaussian shaped current pulses along a line source as excitation having a flat spectral density up to 500 MHz. Most, but not all PD currents in polymers will rise as fast. Slower pulses will effect the wavefrom observed. Presently there is not an sufficient data base on pulse shapes as a function of the electrical tree age, its location and 50 Hz field strength to take this effects within the simulation into account. No frequency dependent material parameters were used. Instead 'average' dielectric parameters described the conducive silicon rubber. Handling dispersion would allow to extend the frequency range and to use measured dielectric parameters for all materials. Most likely, similar simulation will help to solve the problem of PD monitoring on cable terminations which is further complicated by distinguishing between acceptable outer corona and destructive inner PD.
CONCLUSIONS Although the results obtained are specific to the cable joint modelled, it is to expect that the general characteristics of the sensors investigated will hold true for other cable joints with similar construction and general conclusion can be drawn. The paper indicates: In spite of the complexity, the cable joint pulse propagation can be analysed numerically. FDTD is a powerful tool to uncover problems in PD sensoring schemes and to optimise PD sensoring. It allows to determine the the optimal coupling in the desired frequency range,
I
(1) R.Ross, 'Dealing with Interface Problems in Polymer Cable Terminations', DEIS, Julv/Aue. 1999, V01.15. No.4, pp.5-9 (2) C.G.Henningsen, K.Polster, B.A.Fruth, D.W.Gross, 'Experience with an On-line monitoring system for 400 kV XLPE Cables', Proc. IEEE Power Ene. Soc. Trans. and Distr. Conf. 1996, pp.1099-1102 (3) E.Pultrum,M.J.M. Van Riet, 'HF partial discharge detection of HV extruded cable accessories', Jicable 1995, Versailles, France (4) D.Pommerenke, T.Streh1, R.Heinrich, W.Kalkner, F.Schmidt, W.Weissenberg, 'Discrimination between internal PD and other pulses using directional coupling sensors on high voltage cables', IEEE Trans. on Diel Insul, Vol. 6, No.6, 1999, pp. 814-824 (5) M.D.Judd, O.Farish, 'Transferfunctions for UHF partial discharge signals in G I s , Int. Svmu. High Voltage, London 1999, pp74-77,Vo1.5 (6) R.Heinrich, S.Boenisch, D.Pommerenke, R. Jobava, W .Kalkner, 'Broadband measurement of the conductivity and the permitivity of semiconducting materials in high voltage XLPE cables', 8th IEE 1nt.Conf. on Diel. Materials, Meas. and AUUS.,Edinburgh, UK, Sep.17-21, 2000 (7) Fidelity FDTD code from Zeland software, Version 1.2, Fremont, CA, USA (8) Parmigiani, Bruno, Lanfranconi, Patent WO 86/02210, class H02G 15/184, 10.April 1986 (9) G.Katsuta, A.Toya, K.Muraoka, T.Endoh, Y.Sekii, C.Ikeda, 'Development of a method of partial discharge detection in extra-high voltage cross-linked polyethylene insulated cable lines', IEEE Trans. Power Delivery, ~01.7, no.3, pp. 1068-79