Mar 31, 2016 - Stained. Long. Reddish-Bu on. Square-pa ern. Shirts. Jeans. Jack ..... R., Donahue, J., Darrell, T., Malik, J.: Rich feature hierarchies for accu-.
arXiv:1604.00036v1 [cs.CV] 31 Mar 2016
1
Modeling Visual Compatibility through Hierarchical Mid-level Elements Jose Oramas M., Tinne Tuytelaars KU Leuven, ESAT-PSI, iMinds
Abstract. In this paper we present a hierarchical method to discover mid-level elements with the objective of modeling visual compatibility between objects. At the base-level, our method identifies patterns of CNN activations with the aim of modeling different variations/styles in which objects of the classes of interest may occur. At the top-level, the proposed method discovers patterns of co-occurring activations of baselevel elements that define visual compatibility between pairs of object classes. Experiments on the massive Amazon dataset show the strength of our method at describing object classes and the characteristics that drive the compatibility between them. Keywords: compatibility modeling, mid-level representations, retrieval
Introduction
With the popularity and high proliferation of camera-capable mobile computing devices, the amount of images being collected and uploaded to the Internet has increased exponentially in recent years. These images cover different types of content, e.g. events, locations, consumer products, that are of interest to the user. Given an image with a content of interest, a common problem is to find or retrieve images with related content. The solution to this problem has several applications. For tourism, given a set of images taken by the user on a previous holiday, visual similarity can be used to find and suggest alternative destinations where the user may find similar settings than the ones of his interest. For shopping, pictures of a specific product, e.g. a car, can be used to find accessories that are not only adequate for that car model but also that match its style. Likewise, given an image of a specific piece of clothes, e.g. a shirt, pants and shoes matching the style of the presented shirt can be suggested. Over the years, this retrieval/recommendation problem has been approached mostly from a text-oriented perspective: compatibility between the query image and the set of images is determined by analyzing text captions or other types of metadata associated to the images. This procedure has the weakness of not being applicable to images where such text captions or metadata are not available. This weakness is usually referred to in the literature as the “cold start” problem [1,2]. Different from images published by online shops on the Internet where detailed text descriptions are usually available, images taken or uploaded by users are
2
Oramas & Tuytelaars
not necessarily accompanied by such text captions. This makes the ’cold start’ problem relevant for the proposed applications. To address this problem, we propose to do the analysis at the visual level, that is, by comparing visual features between the content of the images. In this work we focus on measuring the visual compatibility of objects depicted in different images. Inspired by the success of representations based of mid-level elements [3,4,5,6,7,8,9,10], we propose a hierarchical method to learn visual representations in a data-driven fashion. At the base-level we discover a set of informative class-specific elements by mining activations of Convolutional Neural Networks (CNN). These base-level elements are effective at describing images of the classes of interest. At the top-level we exploit co-occurrences of base-level elements between images of compatible objects. This produces a set of “rules” which “explain” the compatibility of such objects. We conduct experiments on the clothes-related classes from the massive Amazon-based dataset collected in [11]. We focus on the compatibility estimation problem assuming the classes of the objects depicted in the images are known. This is a reasonable assumption given the recent impressive advances that have been achieved in the image classification task [12]. Moreover, there are significant efforts focusing on the task of clothes segmentation [13,14,15,16,17] which can benefit the proposed method. The main contributions of this work are: i) a novel hierarchical method that not only estimates compatibility between objects depicted in images but also provides an insight on the features that drive the compatibility, and ii) a modular method that is highly parallelizable, therefore, it can be trained in a relatively short period of time. This paper is organized as follows: in Section 2 we position our method wrt. existing work. In Section 3 we give a brief introduction to Association-Rule Mining for completeness. Section 4 goes into the details of the proposed method to model object appearance and visual compatibility while Section 5 provides implementation details. In Section 6 we present the evaluation protocol followed to validate our method accompanied by a discussion of the results. Finally, we draw conclusions in Section 7.
2
Related Work
The method proposed in this paper has the objective of modeling visual compatibility between objects depicted in images by performing a hierarchical extraction of mid level elements. For this reason, we position our work w.r.t. efforts going in the directions of visual style modeling and visual representations based on mid-level elements. Visual Style Modeling: Recent work has addressed the problem of visual style modeling by focusing on clothing-related objects. In [18], a method is proposed to perform clothing description from natural images. To this end, face and upper body detectors are used to localize regions of interest. Then, an ensemble of Random Forests and Support Vector Machines (SVMs) are used to classify
Modeling Visual Compatibility via Mid-level Elements
3
the clothing type and describe the clothing style, respectively. In [15], a multimodal approach is proposed in which a Conditional Random Field model jointly reasons about several factors, e.g. outfits, user, setting, image text metadata, etc. to predict “fashionability”. In parallel, in [19], visual compatibility between clothes is modeled by learning a distance metric from CNN activations based on a vanilla ImageNet AlexNet between images of compatible clothes. Just recently the method proposed in [20], extends [19] by removing the logistic regression step and fine-tuning the entire network by integrating a Siamese architecture. Different from [18], which focuses mostly on the description of upper-body clothing, in this work we model the appearance of a wider a range of clothing classes that are not exclusive to the upper-body, e.g. shoes, sunglasses, hats, pants, etc. In addition, since our method aims at discovering informative features for modeling visual appearance and compatibility, it does not require a set of attributes, e.g. colors, materials, etc., or classes of style to be pre-defined. Similar to [19,20] our method uses CNN activations as a low-level feature from which a more informative representation is learned. Different from them, we obtain such representation by a hierarchical mining of mid-level elements. This has the advantage of providing an insight on the elements, or features, that drive the link between compatible objects. Finally, different from [15], our method models compatibility between objects by lifting features from the image space exclusively. Representations Based on Mid-Level Elements: In recent years, midlevel visual elements have been proposed as a bottom-up means to represent visual information. These mid-level elements are both representative, i.e. they can be adapted to describe different images, and discriminative, i.e. they can be detected with high precision and recall. Given these properties, mid-level visual elements have proven to be very effective for several computer vision tasks such as image classification [21,22,10], action recognition [7,23], geometry estimation [24], etc. More recently, mid-level visual elements were successfully applied to summarize large sets of images [9]. In addition, their performance was further improved by exploiting more advanced features at the lower level, combinations of activations of Convolutional Neural Networks, and association rule mining [8]. In this work we propose a hierarchical method based on mid-level elements to model visual compatibility between objects depicted in images. At the base-level, our method gets closer to existing work by extracting mid-level elements in a class-specific fashion. Different from existing work at the top-level, our method exploits co-occurrences of base-level elements between images of compatible objects in order to discover a set of patterns or rules that link such objects.
3
Background
Following the original definition by Agrawal et al. [25], the problem of association rule mining is defined in the following terms. Let I = {i1 , i2 , . . . , in } be a set of n attributes called items and D = {t1 , t2 , . . . , tm } be a set of m transactions called
4
Oramas & Tuytelaars
the database with m >> n. Each transaction in D has a unique transaction id and contains a subset of the items in I. A rule is defined as an implication of the form X ⇒ Y , where X, Y ⊆ I and X ∩ Y = ∅. Every rule is composed by two different sets of items, also known as itemsets, X and Y , where X is called antecedent or left-hand-side (LHS) and Y consequent or right-hand-side (RHS). The goal of association rule mining is to identify strong rules between items in D using some measures of interestingness. In order to select interesting rules from the set of all possible rules, constraints on various measures of significance and interest are used. The best-known constraints are thresholds on support supp(X ⇒ Y ) and confidence conf (X ⇒ Y ). Formally speaking, |{X ∪ Y } ∈ D| , (1) m where |.| is the cardinality operator and supp(X ⇒ Y ) ∈ [0, 1] The support supp(X ⇒ Y ) of a rule, corresponds to the proportion of transactions in which the itemset {X ∪ Y } occur. Similarly, the confidence of the rule conf (X ⇒ Y ) is defined as: supp(X ⇒ Y ) = supp({X ∪ Y }) =
conf (X ⇒ Y ) =
4
supp({X ∪ Y }) supp(X)
(2)
Proposed Method
In this section we take a deeper look at the parts that constitute the proposed method to model visual compatibility. This method can be summarized in three steps. First, given a set images of the class of interest (Figure 1.a), initial features are computed from image regions sampled from the images (Figure 1.c). In the second step. these initial features are mined in order to obtain a subset of baselevel elements that can be used to describe each object class (Figure 1.d). In the third step, given a set of image pairs of (in)compatible objects (Figure 1.b), base-level elements with high co-occurrence on the image pairs are discovered (Figure 1.e). These discovered pairs constitute top-level relational elements that can be use to describe visual compatibility between objects. Now we will provide a deeper presentation of the proposed method. 4.1
Modeling Object Appearance
Given a set of object classes C = {c1 , c2 , ..., cn }, at the base-level, the proposed method aims at modeling the appearance of different instances one class at a time. Until recent years, a traditional method to model visual appearance was by using low-level local features [26] such as SIFT [27] or HOG [28]. In recent years, a novel paradigm has emerged where mid-level visual elements are used as an intermediate representation between low-level features and high-level classrelated semantics. Inspired by the success of this new paradigm, at the base-level, our method discovers a set of elements that can be used to describe different instances of a specific object class ci .
Modeling Visual Compatibility via Mid-level Elements Image patch extraction
5
Class-specific patch mining
Image collection
c
d
Compatible elements sets
compatible
a incompatible
compatible
b Sets of (in)compatible objects
e Compatible elements discovery
Fig. 1. The proposed method consists of three steps. Given a set of object images (a) accompanied with object-class labels, and links between them describing the (in)compatibility between them (b), we proceed as follows. First, we extract image patches for each image in the collection and compute CNN activations from each patch (c). Second, we perform mining on the CNN activations from images corresponding to each object class (d), producing a set of activation patterns (base-level elements) that describe each of the classes of interest. Third, given a set of image pairs, the base-level elements are detected in each image and sets of compatible base-level elements are discovered (e) via association-rule mining [25].
Mining CNN Activations: Given an image of an object, we uniformly sample a set of regions R = {r1 , r2 , . . . , rm } and for each region ri we compute CNN activations as an initial feature. The main motivation behind the use of CNN activations as initial feature is their high performance [12] in challenging classification tasks such as the ILSVRC image classification challenge [29]. Furthermore, in recent years there is clear evidence that these features, initially trained for classification, can be fine-tuned to be used for object detection [30,31] and instance retrieval [32]. This makes CNN features a strong means to describe appearance. Given a set of image regions R sampled from the image collection, with their corresponding CNN activations F , we mine CNN activation patterns P 0 in a class-specific fashion. To this end, given a set of regions Rc , from a set of images depicting objects of class c, we define the transaction-item matrix where the transactions correspond to the image regions ric ∈ Rc and the items are defined by each of the dimension indices from the CNN activations (see Figure 2). Following its construction, this matrix is further binarized by taking the subset consisting of the top-k activations per transaction. As presented in [8,33,34], no relevant information is lost during the binarization step, since discriminative information from the CNN activations is mostly embedded in the dimension indices of the largest magnitudes. We recommend reading [8] for a deeper analysis on this aspect. A set of class-specific CNN activation patterns P 0c is obtained as an outcome of this mining procedure.
6
Oramas & Tuytelaars
Fig. 2. Transaction-Item Matrix construction for mining patterns of CNN activations that describe the object classes of interest.
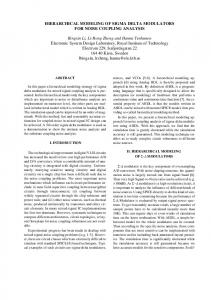
Retrieving Base-level Visual Elements: Starting from the set of activation patterns P 0c , discovered in the previous step, we perform the following two steps. First, we remove redundant patterns that fire on the same set of items (CNN activation indices), thus, producing a reduced set of patterns P 0c . Then, the next step consists of extracting a set of visual elements V 0c ∈ P 0c . The visual elements 0c vi0c ∈ V 0c cover all the image patches that contain the pattern p0c i ∈ P . This can be retrieved effectively via an inverted file index. As a result, we obtain a set of base-level visual elements V 0c which describe different visual characteristics of instances of class c. Please see Figure 3 for some groups of images clustered by their base-level elements. Notice how some of these elements effectively describe “style” features of the classes of interest. Finally, for each base-level element vi0c we train a LDA classifier θi0c using all the image patches covered by vi0c , producing a set of LDA classifiers Θ0c = {θ10c , θ20c , . . . , θn0c } for object class c. 4.2
Modeling Visual Compatibility
In a nutshell, our method to model visual compatibility consists of discovering patterns of co-occurring activations of the base-level elements extracted in Section 4.1, and considers the level to which they occur in a pair of test images in order to measure their compatibility. Base-level Data Encoding: Given a set of image pairs (I(a) , I(b) ) accompanied with binary compatibility labels l ∈ {0, 1}, for each image, we sample a set of regions R and compute CNN activations following a similar procedure as stated in Section 4.1. Then, each image from the pair is re-encoded using the LDA classifiers Θ0c corresponding to the class c of the object of interest. To this end, we compute the response θi0c (r) of each classifier θi0c ∈ Θ0c for each image region r ∈ R and store the maximum responses and the corresponding ids of the regions that produced them. This produces a new representation defined over base-level elements V 0c with dimensionality equal to the number of classifiers θi0c (r) for each image. Mining Base-level Activations: In order to discover co-occurring activations of the base-level elements, we perform association-rule mining [25] by con-
7
Shirts
Modeling Visual Compatibility via Mid-level Elements
Hawaiian
Tank-top
Jeans
Text
three-quarters
Skinny / �ght
Jacktes
Stained
Long
Reddish-Bu�on
Sweaters
Square-pa�ern
Striped
Open
diamond-pa�ern
Fig. 3. Some of the clusters defined by the base-level visual elements for the shirts, jeans, coats & jackets, and sweaters product classes. For each of the clusters we have added a text caption (in blue) of the style that they seem to encode. Furthermore, each image within each cluster is marked with the patch that encodes such style.
sidering the base-level representation of the image pairs and their respective compatibility labels l. At this part of the algorithm, we construct a new the transaction-item matrix (see Figure 4) where each transaction is defined by the concatenated base-level representations from the image pairs. Each transaction is further extended with two additional bins which are used to indicate whether the objects are compatible or not. Moreover, the image pairs defining the transactions cover both compatible and incompatible pairs. The items of this matrix are defined by the set of base-level elements defined in the previous section. Following the association-rule mining [25] approach we mine rules of the form [Θ0ca (Ra ), Θ0cb (Rb )] ⇒ (lab = 1). The antecedent of these rules are the concatenated responses of the base-level elements from object images (Ia , Ib ) of class ca and cb , respectively. The consequent lab is the binary compatibility label of object pair (Ia , Ib ), which we require to be positive (lab = 1) . This mining process is performed, independently, for all the combinations of object classes (ci , cj ) ∈ C. Hence, the transactions of the transaction-item matrix only considers image pairs where images from both classes are involved. Furthermore, the items from such matrix only cover base-level elements {V 0ci , V 0cj }. Finally, this matrix is binarized by selecting the top-k activations within the base-level representation of each object on each pair. For all class combinations (ci , cj ) ∈ C, a set of co-occurring activation patterns P 00(ci ,cj ) covering examples of classes (ci , cj ) is obtained as a result of this mining step.
8
Oramas & Tuytelaars
Fig. 4. Transaction-Item Matrix construction for mining patterns of co-occurring baselevel element activations that describe links between objects of specific classes.
Retrieving Top-level Visual Elements: Starting from the set of activation patterns P 00(ci ,cj ) , discovered in the previous step, the next step consists of extracting a reduced set of top-level visual elements V 00(ci ,cj ) ∈ P 00(ci ,cj ) . These top-level elements are retrieved in a similar fashion as for the base-level elements V 0c (Section 4.1), i.e. via an inverted file index. As a result, we obtain a set of top-level visual elements V 00(ci ,cj ) which describe links between base-level visual elements V c for compatible objects. Hence, their occurrence on a given pair of images can be used to indicate whether the objects depicted on such images are compatible or not. Finally, for each top-level element V 00(ci ,cj ) we train a LDA classifier θ00(ci ,cj ) using all the image pairs covered by v 00(ci ,cj ) , producing a set of 00(c ,c ) 00(c ,c ) 00(c ,c ) classifiers Θ00(ci ,cj ) = {θ1 i j , θ2 i j , . . . , θn i j } for object pairs belonging to classes (ci , cj ). Each of these classifiers is used to estimate the level to which a specific top-level element occurs on a pair of images.
4.3
Inference
Having the sets of base-level Θ0c and top-level Θ00(ci ,cj ) classifiers, inference is a straight forward process (Algorithm 1). Given a pair of test images (Ia , Ib ) depicting object of classes (ca , cb ), respectively. As a first step we uniformly sample regions ra and rb from each image producing the respective sets Ra and Rb . Then, we compute CNN activations fa = f (ra ) and fb = f (rb ) for each for each region in the sets Ra and Rb . Then using the base-level classifiers (Θ0ca , Θ0cb ), for classes ca and cb , we compute the encoding Γab for the image pair (Ia , Ib ) by taking the maximum response for each classifier over the different CNN activations in Fa and Fb corresponding to the image regions ra ∈ Ra and rb ∈ Rb , respectively. Hence Γab = [max(Θ0ca (Fa )), max(Θ0cb (Fb ))]. Finally, using the top-level LDA classifier Θ00(ca ,cb ) , we compute the compatibility score between Ia and Ib by taking the maximum response from the set of responses 00(c ,c ) 00(c ,c ) 00(c ,c ) defined by Θ00(ca ,cb ) ( Γab ) = [θ1 a b (Γab ), θ2 a b (Γab ), . . . , θn a b (Γab )].
Modeling Visual Compatibility via Mid-level Elements
9
Algorithm 1 Visual Compatibility Estimation Given – A pair of images (Ia , Ib ) of classes (ca , cb ), respectively. Steps 1. Region Sampling: uniformly sample regions Ra and Rb on each image. 2. Initial Feature Encoding: compute CNN activations fa ∈ Fa and fb ∈ Fb for each region ra ∈ Ra and rb ∈ Rb . 3. Base-level Scoring: compute the responses θ0ca (fa ) and θ0cb (fb ) using the baselevel LDA classifiers (Θ0ca , Θ0cb ) for classes ca and cb , respectively. 4. Base-level Encoding: concatenate the maximum response for each classifier (Θ0ca , Θ0cb ) producing the joint response Γab = [max(Θ0ca (Fa )), max(Θ0cb (Fb ))]. 5. Top-level scoring: using the top-level LDA classifier Θ00(ca ,cb ) compute the compatibility score between Ia and Ib by taking the maximum response from the set of responses Θ00(ca ,cb ) ( Γab ).
5
Implementation Details
Modeling Object Appearance: When modeling object appearance (Section 4.1), each of the images is resized proportionally so that their smaller dimension is 256 pixels. Then, image patches are extracted by using a sliding window approach with window size 128x128 pixels and a stride of 32 pixels. On average, a set of 40 windows are extracted per image. We compute CNN activations using Caffe [35] in combination with the CaffeRef model [35]. During mining, we binarize the CNN activations of each transaction by selecting the top 20 activations (k = 20). We look for patterns P c composed of 3 to 6 items, i.e. 3 ≤ length(pc ) ≤ 6, ∀pc ∈ P c . Finally, we aim to extract at most 4000 base-level visual elements vic per class. Modeling Visual Compatibility: When modeling visual compatibility (Section 4.2), the transaction-item matrix is binarized by selecting the top 10 activations (k = 10) of the base-level representation of each object prior to their concatenation to define a transaction. During mining, we search for patterns composed of 3 to 6 items, i.e. 3 ≤ length(p00(ci ,cj ) ) ≤ 6. Moreover, we enforce that the items defining each of the patterns p00(ci ,cj ) cover base-level visual elements from both classes. At this level, we perform association-rule mining with support supp(p00(ci ,cj ) ) ≥ 0.05% and confidence conf (p00(ci ,cj ) ) ≥ 75%. Finally, similar to the case of base-level elements, we aim at extracting at most 4000 top-level visual elements in total.
6
Evaluation
We conduct experiments on the dataset1 collected in [11] which is based on the Amazon web store. This dataset was collected between May 1996 and July 2014, 1
http://jmcauley.ucsd.edu/data/amazon/
10
Oramas & Tuytelaars
thus producing a large scale set of 9.4 million product images. Each product is accompanied by an image and metadata covering product ID, sales-rank, brand, and co-purchasing product links. These links, e.g. “also bought”,“bought together”, “also viewed”, are defined by users of the web store while interacting with such products. In our experiments we focus on the subset of this dataset defined in [20] which covers around 1 million products belonging to the parent class “Clothing, Shoes and Jewelry”. This subset includes a set of ∼2.5 million product pairs with compatibility labels defined from product co-purchase links covering the relations “bought together” and “also bought”. These compatibility labels are binary labels stating whether two specific products are compatible or not. Since the proposed method is focused on modeling visual compatibility, we limit ourselves to only consider the image and the class label for each product and ignore any additional metadata. We focus our experiments considering the classes accessories, jeans, pants, shirts, shoes, shorts, skirts, and tops & tees covering ∼500K images. Total training time took below 12 hours. Following the evaluation protocol from [20], we use as performance metric the area under the curve (AUC) defined by the False Positive Rate (FPR) vs. the True Positive Rate (TPR) on the compatibility estimation task. We report qualitative results in Figures 5, 6 and 7 . 6.1
Quantitative Results
In this section we analyze the quantitative performance of the proposed method and compare w.r.t. the method proposed in [20]. For this purpose, given the testing set of image pairs, we run the method from [20] using the publicly available code2 . The method from [20] has clearly superior performance (0.804 AUC) than the one proposed in this paper (0.655 AUC). However, despite its high performance, since the method from [20] operates at the image level it has a reduced output in terms of “explaining” the reasons that make the compared objects compatible. On the contrary, while still being able to estimate the compatibility up to some level, our method has the advantage of providing some insights related to the object characteristics that drive such compatibility (see Section 6.2).
6.2
Qualitative Results
In Figure 5 we present some examples where object compatibility has been predicted accurately. For each example we draw the regions representing the top-3-scoring baselevel elements corresponding to each image. Moreover, we extend each example by showing a random subset of training image regions that define such base-level elements. Notice how for some of the examples, some of the base-level elements provide details regarding the features that characterize each object and drive the compatibility. For example, Dark colorful logo shirt with dark loose pocketed shorts (Figure 5.a), reddish loose skirt with blue/greenish tee without sleeves (Figure 5.b). In addition, in Figure 6 we show a larger set of qualitative examples. For clarity, for each of the images of the figures, we show a reduced set base-level elements which have the highest response when measuring compatibility between the objects. Please refer to the supplementary material for an extended list of examples 2
http://vision.cornell.edu/se3/projects/clothing-style/
Modeling Visual Compatibility via Mid-level Elements
11
Fig. 5. Some examples of accurately predicted compatible objects. For each object the regions of the top-3 base-level elements are indicated with their scores color-coded in jet scale. In addition, for each base-level element, we present a subset of random examples that compose it. Note how some base-level elements effectively describe some of the features that define the link between the objects (a-b), while for others (object#1 on (e)) this information is not so clear.
6.3
Encoding Context Cues
A deeper visual inspection to the mid-level elements, at both the base and top levels, reveals that the proposed method is taking into account information from “external” regions that do not directly overlap with the object of interest. As Figure 7 shows, these external regions are used for different purposes. That is, at the base-level, they are used to describe extrinsic features from the products, such as that some types of tops & tees as well as skirts are products exclusively for women (Figure 7.a). Likewise, wearing a three-quarter jeans reveals the feet of the user, while shirts and some type of
12
Oramas & Tuytelaars Skirts - Tees
Accessories - Pants
Shirts - Shorts
Accessories - Skirts
Pants - Shirts
Shoes - Shorts
Fig. 6. Some examples of accurately predicted compatible objects. For clarity, for each object the regions of only the top-3 base-level elements are indicated with their scores color-coded in jet scale. Please refer to the supplementary material for an extended list of examples.
(mini) skirts reveal the arms and the knees, respectively (Figure 7.b-d). Furthermore this information seems to play an important role when linking products via compatibility relations (see Figure 7.e-h). For example, in Figure 7.e, the occurrence of a female face produces a high response when measuring the compatibility between skirt and tops & tees products. This strongly suggests that the proposed method is able to lift contextual information from the images of the products. In the current setting, the Amazon dataset, almost all the images have an uniform-color background. Thus, the only source of contextual cues are the persons that are wearing the clothes in some
Modeling Visual Compatibility via Mid-level Elements
13
images. Given the fact that clothing style is driven by several factors (e.g. shorts, tops, sandals, and t-shirts are usually worn on summer-like locations like beaches, suits and long dresses are commonly worn indoors, etc.) the capability of lifting contextual information embedded in the images, is a feature with promising potential when operating on images in the wild.
Tops & Tees
Skirts
a
Female item
Jeans
b
Lower leg occurrence
e
f
Shirts
c
Arm occurrence
Skirts
d
Knee occurrence
g
h
Fig. 7. Examples of mid-level elements encoding contextual information at both the base (a-d) and top (e-h) levels, respectively. The top row shows the region (blue) of the base-level element. The bottom row shows comparisons between images with the top scoring base-level elements that describe the compatibility color-coded in jet scale. Note how the method is able to encode that skirts and some tops are female products (a) , and that wearing 3/4 jeans, shirts and mini skirts, leave the feet, arms and knees, exposed, respectively (b-d) . Moreover, detecting a female face can produce a strong link when comparing skirts and some tops products (e). Similarly, other base-level elements that encode context information can serve as a strong indicator of compatibility (f-h).
6.4
Discussion
In this paper we presented a hierarchical method to discover mid-level visual elements with the objective of modeling visual compatibility between objects. The main features of the proposed method can be divided into two groups. On the one hand, the proposed method extracts a meaningful representation that not only describes different variations, or style, in which the objects of interest may occur (see Figure 3), but it also reveals the features from the objects that define the compatibility between them. On
14
Oramas & Tuytelaars
the other hand, there is some evidence (Section 6.3) that the proposed method is able to take advantage of contextual information embedded in the images when modeling both object appearance and compatibility. In addition, since the proposed method follows a class-driven processing approach, the whole pipeline can be divided into sub-processes focusing on specific object classes. As a result, each sub-process operates on a smaller volume of data which results in faster processing times. In the event that new object classes are needed to be taken into account, a total of |C|+1 processes should be launched. From this total, one process focuses on modeling the appearance of the new class, while the other |C| (number of existing classes) processes focus on modeling the compatibility of the new class w.r.t. the existing classes in the system. Moreover, there are some object classes which are never linked, e.g. swimming pants & tuxedos, watches & underwear, etc., for which modeling compatibility is not required. This sets our method apart w.r.t class agnostic methods which require the whole process, which operates over the whole volume of data, to be repeated each time new classes need to be considered. Despite the notable descriptive strength of the proposed method, there are several areas in which the proposed method can be improved. First, as mentioned in Section 5, during the region sampling step at the base-level processing, an average of 40 fixedsize regions are sampled per image. Performing a denser sampling at different scales will improve the alignment of base-level elements. Moreover, the method would be able to inspect low-resolution object characteristics which are currently un-reachable. This should produce more informative base-level elements which benefit compatibility modeling at the top-level. Furthermore, there is clear evidence [31] that this dense sampling and CNN feature computations can be performed efficiently. Second, in its current state, the method computes the compatibility score between images by taking the maximum response from the LDA classifiers based on the top-level elements (Section 4.3). This removes the possibility of different top-level classifiers operating on a coordinated fashion, which is a likely possibility given the fact that top-level classifiers are derived from base-level elements which encode different aspects (e.g. color, texture, shape, context, etc.) of the objects being compared. Moreover. these last top-level classifiers, i.e. the ones used for making the final decision about compatibility scoring, are trained by only considering positive examples, thus having reduced discrimination against negative examples. For this reason, we proposed first to train each top-level classifier in discriminative approach in which examples of incompatible objects are also considered. Furthermore, in order to take advantage of the descriptive strength of the top-level classifiers, we propose to compute the compatibility score as a combination of their responses.
7
Conclusion
In this paper we presented a hierarchical method to discover mid-level visual elements with the objective of modeling visual compatibility between objects. Although, on the quantitative side, the proposed method achieves subpar performance, on the qualitative side, the method shows strong descriptive capabilities. In this regard,the proposed method not only effectively models different styles in which the objects of interest may occur, but it also provides an insight on the characteristics of the objects that define compatibility between them. Moreover, there is evidence that suggests that the proposed method is able to encode and effectively exploit contextual information when modeling object classes and the compatibility between them.
Modeling Visual Compatibility via Mid-level Elements
8
15
Acknowledgements
This work is supported by the SBO Program IWT project “Personalised AdveRtisements buIlt from web Sources (PARIS)” (IWT-SBO-Nr. 110067), and a NVIDIA Academic Hardware Grant.
References 1. Schein, A.I., Popescul, A., Ungar, L.H., Pennock, D.M.: Methods and metrics for cold-start recommendations. In: Proceedings of the 25th Annual International ACM SIGIR Conference on Research and Development in Information Retrieval. (2002) 2. Zhou, K., Yang, S.H., Zha, H.: Functional matrix factorizations for cold-start recommendation. In: Proceedings of the 34th International ACM SIGIR Conference on Research and Development in Information Retrieval. (2011) 3. Doersch, C., Gupta, A., Efros, A.A.: Mid-level visual element discovery as discriminative mode seeking. In: NIPS. (2013) 4. Doersch, C., Gupta, A., Efros, A.A.: Context as supervisory signal: Discovering objects with predictable context. In: ECCV. (2014) 5. Doersch, C., Gupta, A., Efros, A.A.: Unsupervised visual representation learning by context prediction. In: ICCV. (2015) 6. Doersch, C., Singh, S., Gupta, A., Sivic, J., Efros, A.A.: What makes paris look like paris? Communications of the ACM 58(12) (2015) 103–110 7. Jain, A., Gupta, A., Rodriguez, M., Davis, L.: Representing videos using mid-level discriminative patches. In: IEEE conference on Computer Vision and Pattern Recognition (CVPR). (2013) 8. Li, Y., Liu, L., Shen, C., van den Hengel, A.: Mining mid-level visual patterns with deep CNN activations. CoRR abs/1506.06343 (2015) 9. Rematas, K., Fernando, B., Dellaert, F., Tuytelaars, T.: Dataset fingerprints: Exploring image collections through data mining. In: CVPR. (2015) 10. Singh, S., Gupta, A., Efros, A.A.: Unsupervised discovery of mid-level discriminative patches. In: European Conference on Computer Vision. (2012) 11. McAuley, J.J., Pandey, R., Leskovec, J.: Inferring networks of substitutable and complementary products. In: KDD. (2015) 12. Krizhevsky, A., Sutskever, I., Hinton, G.E.: Imagenet classification with deep convolutional neural networks. In: NIPS. (2012) 13. Kalantidis, Y., Kennedy, L., Li, L.J.: Getting the look: Clothing recognition and segmentation for automatic product suggestions in everyday photos. In: ICMR. (2013) 14. Simo-Serra, E., Fidler, S., Moreno-Noguer, F., Urtasun, R.: A High Performance CRF Model for Clothes Parsing. In: ACCV. (2014) 15. Simo-Serra, E., Fidler, S., Moreno-Noguer, F., Urtasun, R.: Neuroaesthetics in fashion: Modeling the perception of fashionability. In: CVPR. (2015) 16. Yamaguchi, K., Kiapour, M.H., Ortiz, L.E., Berg, T.L.: Retrieving similar styles to parse clothing. TPAMI (5) (2015) 1028–1040 17. Yang, W., Luo, P., Lin, L.: Clothing co-parsing by joint image segmentation and labeling. In: CVPR. (June 2014) 18. Bossard, L., Dantone, M., Leistner, C., Wengert, C., Quack, T., Van Gool, L.: Apparel classification with style. In: ACCV. (2012)
16
Oramas & Tuytelaars
19. McAuley, J.J., Targett, C., Shi, Q., van den Hengel, A.: Image-based recommendations on styles and substitutes. In: SIGIR. (2015) 20. Veit, A., Kovacs, B., Bell, S., McAuely, J., Bala, K., Belongie, S.: Learning visual clothing style with heterogeneous dyadic co-occurrences. In: ICCV. (2015) 21. Bossard, L., Guillaumin, M., Van Gool, L.: Food-101 – mining discriminative components with random forests. In: ECCV. (2014) 22. Li, Q., Wu, J., Tu, Z.: Harvesting mid-level visual concepts from large-scale internet images. In: Proceedings of the 2013 IEEE Conference on Computer Vision and Pattern Recognition. CVPR ’13 (2013) 23. Wang, L., Qiao, Y., Tang, X.: Motionlets: Mid-level 3d parts for human motion recognition. In: IEEE Conference on Computer Vision and Pattern Recognition. (2013) 24. Fouhey, D.F., Gupta, A., Hebert, M.: Data-driven 3D primitives for single image understanding. In: ICCV. (2013) 25. Agrawal, R., Imieli´ nski, T., Swami, A.: Mining association rules between sets of items in large databases. In: SIGMOD. (1993) 26. Tuytelaars, T., Mikolajczyk, K.: Local invariant feature detectors: A survey. Found. Trends. Comput. Graph. Vis. 3(3) (July) 177–280 27. Lowe, D.G. 28. Dalal, N., Triggs, B.: Histograms of oriented gradients for human detection. In: CVPR. (2005) 29. Russakovsky, O., Deng, J., Su, H., Krause, J., Satheesh, S., Ma, S., Huang, Z., Karpathy, A., Khosla, A., Bernstein, M., Berg, A.C., Fei-Fei, L.: ImageNet Large Scale Visual Recognition Challenge. IJCV 115(3) (2015) 211–252 30. Girshick, R., Donahue, J., Darrell, T., Malik, J.: Rich feature hierarchies for accurate object detection and semantic segmentation. In: CVPR. (2014) 31. Kaiming, H., Xiangyu, Z., Shaoqing, R., Sun, J.: Spatial pyramid pooling in deep convolutional networks for visual recognition. In: ECCV. (2014) 32. Razavian, A.S., Azizpour, H., Sullivan, J., Carlsson, S.: CNN features off-the-shelf: An astounding baseline for recognition. In: CVPRW. (2014) 33. Dosovitskiy, A., Brox, T.: Inverting convolutional networks with convolutional networks. CoRR abs/1506.02753 (2015) 34. Agrawal, P., Girshick, R., Malik, J. In: ECCV. (2014) 35. Jia, Y., Shelhamer, E., Donahue, J., Karayev, S., Long, J., Girshick, R., Guadarrama, S., Darrell, T.: Caffe: Convolutional architecture for fast feature embedding. arXiv preprint arXiv:1408.5093 (2014)
Modeling Visual Compatibility via Mid-level Elements
9
17
Supplementary Material
This Section constitutes supplementary material to the manuscript presented above. This document extends the original manuscript in the following directions: – Figures 8 and 9, extend Figure 3 of the previous manuscript by presenting additional examples of the extracted base-level visual elements (Section 4.1 of the previous manuscript). These base-level elements are extracted from the Amazon dataset [11,19] for each of the classes of interest (accessories, jeans, pants, shirts, shoes, shorts, skirts, and tops & tees). Figure 10 and 11 present examples of these classes clustered based on their respective visual base-level elements. Note how these base-level elements effectively describe some of the variations or ’styles’ in which the objects of interest may occur. – In Figures 10 -19 we present outfits generated based on the visual compatibility predicted by the proposed method (Section 4.3 of the previous manuscript). We generate these outfits by defining a subset of three classes from which a query class is selected. Then, the visual compatibility w.r.t. to the other classes is computed for every example within each class. This procedure is performed for the examples on the image test set from the Amazon dataset [11,19] defined in [20]. In Figures 10-15 we show examples of generated outfits with high visual compatibility score (Section 4.3 of the previous manuscript). For reference, in Figures 16-19 we present less-compatible outfits, i.e. outfits with the lowest compatibility score. Note that when generating outfits, we only measure visual compatibility between the query example and the examples from the other classes, one example and class at a time. At this point, no compatibility between the retrieved examples is estimated.
18
Oramas & Tuytelaars
Fig. 8. Some of the clusters defined by the base-level visual elements for the shirts, jeans, coats & jackets, and sweaters product classes. Note how some of the clusters seem to encode some variations or ’style’ in which the objects of interest may occur. Furthermore, each image within each cluster is marked with the patch that represents the base-level element.
Modeling Visual Compatibility via Mid-level Elements
19
Fig. 9. Some of the clusters defined by the base-level visual elements for the shirts, jeans, coats & jackets, and sweaters product classes. Note how some of the clusters seem to encode some variations or ’style’ in which the objects of interest may occur. Furthermore, each image within each cluster is marked with the patch that represents the base-level element.
20
Oramas & Tuytelaars
Compatible Outfilts
Fig. 10. Outfits composed of three products from different classes predicted with high compatibility based on the proposed method. Based on the query product (marked in blue) compatible products of other classes are selected.
Modeling Visual Compatibility via Mid-level Elements
21
Compatible Outfilts
Fig. 11. Outfits composed of three products from different classes predicted with high compatibility based on the proposed method. Based on the query product (marked in blue) compatible products of other classes are selected.
22
Oramas & Tuytelaars
Compatible Outfilts
Fig. 12. Outfits composed of three products from different classes predicted with high compatibility based on the proposed method. Based on the query product (marked in blue) compatible products of other classes are selected.
Modeling Visual Compatibility via Mid-level Elements
23
Compatible Outfilts
Fig. 13. Outfits composed of three products from different classes predicted with high compatibility based on the proposed method. Based on the query product (marked in blue) compatible products of other classes are selected.
24
Oramas & Tuytelaars
Compatible Outfilts
Fig. 14. Outfits composed of three products from different classes predicted with high compatibility based on the proposed method. Based on the query product (marked in blue) compatible products of other classes are selected.
Modeling Visual Compatibility via Mid-level Elements
25
Compatible Outfilts
Fig. 15. Outfits composed of three products from different classes predicted with high compatibility based on the proposed method. Based on the query product (marked in blue) compatible products of other classes are selected.
26
Oramas & Tuytelaars
Less-compatible Outfilts
Fig. 16. Outfits composed of three products from different classes predicted with the l owest compatibility score based on the proposed method. Based on the query product (marked in blue) compatible products of other classes are selected.
Modeling Visual Compatibility via Mid-level Elements
27
Less-compatible Outfilts
Fig. 17. Outfits composed of three products from different classes predicted with the l owest compatibility score based on the proposed method. Based on the query product (marked in blue) compatible products of other classes are selected.
28
Oramas & Tuytelaars
Less-compatible Outfilts
Fig. 18. Outfits composed of three products from different classes predicted with the l owest compatibility score based on the proposed method. Based on the query product (marked in blue) compatible products of other classes are selected.
Modeling Visual Compatibility via Mid-level Elements
29
Less-compatible Outfilts
Fig. 19. Outfits composed of three products from different classes predicted with the l owest compatibility score based on the proposed method. Based on the query product (marked in blue) compatible products of other classes are selected.