Journal of Mechanical Science and Technology 30 (11) (2016) 1~12 www.springerlink.com/content/1738-494x(Print)/1976-3824(Online)
DOI 10.1007/s12206-016-0913-y
Modelling and experimental investigation of process parameters in EDM of Si3N4-TiN composites using GRA-RSM† Selvarajan L1, M. Manohar2 and A Udhaya kumar3 and P. Dhinakaran4 1
Research Scholar, Department of Production Engineering, National Institute of Technology (NIT), Tiruchirappalli. 2 Materials and Mechanical Entity Vikram Sarabhai Space Centre (ISRO), Trivandrum 3 M.E. Manufacturing Engineering, Coimbatore, 641062, 4 Assistant professor, Dhanalakshmi srinivasan engineering college, Perambalur (Manuscript Received 000 00, 2016; Revised 000 00, 2016; Accepted 000 00, 2016) ----------------------------------------------------------------------------------------------------------------------------------------------------------------------------------------------------------------------------------------------------------------------------------------------
Abstract Electric Discharge Machining (EDM) is a highly promising machining process of ceramics. This research is an out of the paradigm investigation of EDM on Si3N4-TiN with Copper electrode. Ceramics are used for extrusion dies and bearing balls and they are more efficient, effective and even have longer life than conventional metal alloys. Owing to high hardness of ceramic composites, they are almost impossible to be machined by conventional machining as it entirely depends on relative hardness of tool with work piece. Whereas EDM offers easy machinability combined with exceptional surface finish. Input parameters of paramount significance such as current(I), pulse on(Pon) and off time(Poff), dielectric pressure(DP) and gap voltage(SV) are studied using L25 orthogonal array. With help of mean effective plots the relationship of output parameters like Material Removal Rate(MRR), Tool Wear rate(TWR), Surface Roughness(Ra), Radial overcut(ROC),Taper angle (α),Circularity(CIR), Cylindricity(CYL) and Perpendicularity (PER) with the considered input parameters and their individual influence were investigated. The significant machining parameters were obtained by analysis of variance (ANOVA) based on Grey Relational Analysis(GRA) and value of regression coefficient was determined for each model. The results were further evaluated by using confirmatory experiment which illustrated that spark eroding process could effectively be improved. Keywords: Electric discharge machining; Surface roughness; Radial over cut; Taper angle; Geometrical tolerances; Ceramic composites ----------------------------------------------------------------------------------------------------------------------------------------------------------------------------------------------------------------------------------------------------------------------------------------------
1. Introduction Ceramic matrix composite materials find their application in high temperature environments. Experimental investigations on various ceramic materials found that these materials have high strength and hardness. Hence traditional machining processes cannot be employed for the production of complex shapes and may cause cracks on the machined surface. It is also found that their properties lead to less machinability and forms built up edge on the tool. Therefore, at the time of machining, the cutting tool is worn out and it leads to exorbitant tool cost. Eventually, Electrical Discharge Machining (EDM) process is considered as an ideal method to machine ceramic composites. This underlined the fact that an un-conventional machining process is the best for this kind of application [1-3]. EDM is less expensive and widely used unconventional machining method for good dimensional tolerance in all electrically conductive material even if the materials possess high hardness [4-6]. Though most of the ceramic based composites are non-conductive in nature, conductive ceramic composite *
Corresponding author. Tel.: +91 9500040295, Fax.: + E-mail address:
[email protected] † Recommended by Associate Editor © KSME & Springer 2016
materials are also manufactured. Bhduri et al. have proved that the EDM is possible in Titanium nitride-aluminum oxide of ceramic composites. Another such ceramic based composite material is syalon which is composite of Si3N4-TiN [7]. Bucciotti et al. investigated the suitability of electro conductive silicon/titanium nitride composite for biomedical implantable devices with particular attention on the processing route that allows the net-shaping of complex components by electrical discharge machining [8]. Ahmad et al. have studied the outcome of electrical and mechanical properties of Si3N4-TiN composites. The composites prepared by plasma sintering at 1250-1350ºC possessed low electrical resistivity and it could be machined by Electrical Discharge Machining (EDM). In the recent years, the conductive ceramic composites were used in some special applications like level sensors in molten metals, air craft engine and complex moulds for metal forming. From the above literatures, it is clear that the Si3N4-TiN ceramic composite together with the EDM manufacturing process might potentially play a key role in the application of engineering materials [9-11]. The selection of suitable electrode plays important role in the EDM process for machining the ceramic composites. San-
2
Selvarajan L et al. / Journal of Mechanical Science and Technology 30 (11) (2016) 1~9
dies and press work operations. From the literatures available it is observed that only few number of work has been conducted on geometrical tolerance in EDM of ceramic composites hence, in the present work the authors are focused on the geometrical tolerances during electrical discharge machining [15, 16]. Ramanujam et al. used Taguchi technique as an experimental method to reduce the number of experimental trials based on design of experiments. Orthogonal array and optimization techniques are employed to find out the best parameter combinations [17]. Singh et al. used the grey relational analysis method for optimization of the EDM process. Most of the applications of Taguchi method concentrate on the optimization of single response [18]. Chinnaiyan et al. employed the Taguchi method and the Grey relational analysis to optimize the turning operations with multiple response characteristics [19]. So Grey relational analysis can be recommended as a method for optimizing the complicated interrelationships among multiple performance characteristics. By meticulous study of literature in the field of electric discharge machining of composites it is evident that there has been study about nature of electrodes and work piece affecting the process. Thus the research further focused into investigating each input parameters influence on the hole characteristics. This investigation was possible with help of mean effective plots of each output parameters against all input parameters which were plotted using Minitab. Though many studies have been carried out on EDM process, there is limited experimental works carried out on geometrical tolerances. Thus, this experimental work is attempted to analyze geometrical tolerances in EDM of Si3N4-TiN composites.
2. Materials and methods Fig. 1. Research plan.
2.1 Experimental setup chez et al. used solid tool copper electrodes in EDM of TiN– Al2O3, Si3N4-TiN, B4C, SiC and found that there was significant improvement in MRR, reduction in tool wear and surface roughness [12]. EDM is usually used to machine any electrically conductive components with less MRR. In EDM, solid cu electrode has been used in machining of ceramic composites for improved efficiency [13]. Therefore, the copper electrode was chosen for this present study. The dimensions of features that are machined by EDM is important to decide the part accuracy, Patel et al. have studied the influence of EDM parameters such as current, pulse-on time, and dielectric pressure on performance criteria such as MRR, EWR, Overcut and Taper angle during the machining of aluminum-based composites. They concluded that machining performances are affected mostly by current and pulse-on time during the EDM of composite [14]. Recently, Selvarajan et al. conducted an experimental work to evaluate geometrical tolerance in EDM of composites. Standardized design and close tolerances are necessary in manufacturing of parts for applications such as tools, moulds,
Electrical discharge machining (EDM) was carried out on Si3N4 using different processing conditions. The work piece was prepared using powder metallurgy techniques. OSCARMAX Spark EDM 600 x 300 series machine was used for experimentation. OSCAR EDMs has high reputation in market for its performance, reliability quality and machining accuracy. The experiments were performed with five factors and five levels as shown in Fig. 2. The work piece material was hot-pressed Si3N4-TiN; a composite-grade sialon developed as an electrically conductive ceramic comes from Titanium Nitride. Table 1 elucidates the properties of Si3N4TiN composite materials.
3. Measurements and calculations There are two kinds of outputs to be measured, process measuring outputs viz. MRR, TWR, SR and dimensional characteristic outputs viz. radial overcut, Taper angle, Circularity, Cylindricity, Perpendicularity.Reduction in weight of the workpiece is calculated by obtaining the weight difference
Selvarajan L et al. / Journal of Mechanical Science and Technology 30 (11) (2016) 1~9
3
Table 1. Properties of Si3N4-TiN composite. Properties
Si3N4-TiN
Tensile strength
350
MPa
Young’s modulus of elasticity
341
GPa
RT hardness (HRA)
90.5
-
Fracture toughness K C
5.7
MPam1/2
Poison’s ratio
0.31
-
Density
4.01
g/cc
1
Specific heat
630
J/kg/K
RT thermal conductivity
19.1
W/(mK)
Electrical resistivity
7.24 x 10⁻⁶
Ohm m
Fig. 4. Surface roughness.
Fig. 2. OSCARMAX spark EDM machine.
Fig. 5. Video measuring machine.
3.1 Mechanism and evaluation of surface roughness Surface Roughness was measured by surface roughness test machine with an accuracy ±5.5 µmas shown in Fig. 4. 3.2 Mechanism and measurement of over cut Top and bottom diameter of the drilled hole was measured by Video Measuring Machine (VMM) with accuracy of 3 microns as shown in Fig. 5. 3.3 Measurements and calculations of dimensional characteristics Fig. 3. Precision electronic balance.
of workpiece, before and after machining using weighing scale as shown in Fig. 3. Machining time is actual time measured for each experiment and reading is taken from the Spark EDM machine. Precision balance was used to measure the weight of the work piece and tool. This machines accuracy is 0.001 grams.
Circularity, cylindricity and perpendicularity were measured by CMM using GEOMET universal CMM software with an accuracy of 4.5 microns as shown in Fig. 6. 3.4 Experimental responses The Material Removal Rate was determined using the Eq. (1).
4
Selvarajan L et al. / Journal of Mechanical Science and Technology 30 (11) (2016) 1~9
Table 2. EDM factors and levels of Si3N4-TiN composites. Parameter
Units Level 1 Level 2 Level 3 Level 4
Level 5
Current
A
3
4
5
6
Pulse on time
µs
4
5
6
7
7 8
Pulse off time
µs
8
9
10
11
12
Dielectric pressure
kg/cm2
14
15
16
17
18
Spark gap voltage
V
30
32.5
35
37.5
40
Table 3. Work piece and electrode weight of Si3N4-TiN ceramic composites. Input parameter Exp Pulse on Pulse off Dielectric Spark gap No Current time time pressure voltage
Fig. 6. Coordinate measuring machine.
Fig. 7. Geometrical tolerance measurement of Si3N4-TiN composites.
MRR (g/min) =
Wjb - Wja t
(1)
where Wjb : Weights of the work piece before machining (g) Wja : Weights of the work piece after machining (g) The tool wear rate (TWR) was determined using Eq. (2). TWR (g/min) =
Wtb - Wta t
(2)
where Wtb : Weights of the tool before machining (g) Wta : Weights of the tool after machining (g) t : Machining time (min)
µs
µs
kg/cm2
1
3
4
8
2
3
5
9
3
3
6
4
3
5
3
6
V
min
14
30
27.334
15
32.5
22.351
10
16
35
19.301
7
11
17
37.5
14.284
8
12
18
40
12.884
4
4
9
16
37.5
13.451
7
4
5
10
17
40
11.484
8
4
6
11
18
30
20.484
9
4
7
12
14
32.5
16.934
10
4
8
8
15
35
12.201
11
5
4
10
18
32.5
12.917
12
5
5
11
14
35
11.851
13
5
6
12
15
37.5
9.184
14
5
7
8
16
40
9.751
15
5
8
9
17
30
13.834
16
6
4
11
15
40
9.517
17
6
5
12
16
30
14.901
18
6
6
8
17
32.5
10.984
19
6
7
9
18
35
11.184
20
6
8
10
14
37.5
7.484
21
7
4
12
17
35
12.851
22
7
5
8
18
37.5
6.767
23
7
6
9
14
40
10.251
24
7
7
10
15
30
8.851
25
7
8
11
16
32.5
4.067
Radial overcut, ì D - D electrode ü ROC = í top ý 2 î þ
Taper angle was determined using Eq. (3). ì D - D bottom ü θ = tan -1 í top ý 2t î þ
A
Machining time
(3)
where Delectrode : Diameter of a electrode Dtop : Top diameter of a drilled hole Dbottom : Bottom diameter of a drilled hole
(4)
Selvarajan L et al. / Journal of Mechanical Science and Technology 30 (11) (2016) 1~9
5
Table 4. Experimental response for EDM of Si3N4-TiN composite. Exp MRR No. g/min
EWR
Ra
ROC
CIR
CYL
g/min
mm
mm
deg
mm
mm
PER mm
0.062
1
0.0068 0.0014 0.349
1.313
0.072
0.072
0.021
2
0.0083 0.0013 0.432 0.0605 0.812
0.063
0.08
0.05
3
0.0091 0.0015 0.478 0.0675 0.726
0.059
0.059
0.025
4
0.0126 0.0017 0.593
0.783
0.072
0.076
0.033
5
0.0136 0.0016 0.445 0.0595 0.783
0.052
0.059
0.032
6
0.0127 0.0017 0.572 0.0625 0.998
0.073
0.077
0.029
7
0.0152 0.0016 0.349 0.0595 0.697
0.044
0.069
0.044
8
0.0091 0.0013 0.375 0.0575 1.012
0.042
0.072
0.019
9
0.068
0.0102 0.0018 0.917 0.0625 1.084
0.054
0.075
0.023
10 0.0141 0.0019 0.441 0.0665 0.955
0.074
0.078
0.036
11 0.0131 0.0015 0.496 0.0655 1.213
0.065
0.066
0.022
12 0.0151 0.0021 0.264
0.071
1.198
0.083
0.104
0.026
13 0.0155 0.0022 0.336
0.064
1.041
0.045
0.057
0.016
14 0.0174 0.0023 0.292
0.172
4.028
0.097
0.123
0.04
15 0.0139 0.0018 0.373
0.074
1.256
0.068
0.05
0.037
16 0.0183 0.0035 0.373 0.1525 3.928
0.05
0.08
0.056
17 0.0113 0.0023 0.629
0.071
1.356
0.096
0.112
0.03
18 0.0165 0.0023 0.222
0.176
3.7
0.076
0.18
0.055
19 0.0163 0.0026 0.593 0.2965 6.824
0.147
0.197
0.181
20
0.411
0.059
0.147
0.087
21 0.0143 0.0036 0.205 0.0665 0.783 22 0.0248 0.005
0.023 0.0033 0.133
0.044
0.112
0.144
0.053
0.574
0.085
2.3
0.103
0.215
0.138
23 0.0183 0.0039 0.448
0.252
6.598
0.173
0.172
0.094
24 0.0192 0.0028 1.257
0.073
2.114
0.067
0.059
0.015
25 0.0428 0.0059 0.345
0.081
-0.792
0.05
0.076
0.211
Fig. 9. Main effects plot of material removal rate in Si3N4-TiN composites.
Fig. 10. Main effects plot of electrode wear rate in Si3N4-TiN composite.
4. Results and discussions of Si3N4-TiN ceramic composites 4.1 Taguchi’s analysis for material removal rate In Fig. 9 the general trend of increase of material removal rate current and pulse on time is shown. Material removal rate can be increased by increasing discharge current, gap voltage and pulse on time. The material removal rate is most significantly affected by discharge current and pulse on time. Whereas there is no significant changewith respect to dielectric pressure. 4.2 Taguchi’s analysis for electrode wear rate
Fig. 8. Si3N4-TiN work piece with spark EDM hole.
Video measuring machine was used to capture image of top and bottom diameter and a coordinate measuring machine used for measurement of geometrical tolerance of the drilled hole. The VMM image of all holes are furnished below and their corresponding experimental responses are furnished in the Table 4.
In Fig. 10 the general trend of increase of electrode wear with increase in current is shown. Wear rate could be minimized by reducing the discharge current, pulse on time and gap voltage. For any change in di electric pressure and pulse off time there is no significant change in electrode wear rate for this composite material. 4.3 Taguchi’s analysis for surface roughness In Fig. 11 the general trend of decrease in surface roughness
6
Selvarajan L et al. / Journal of Mechanical Science and Technology 30 (11) (2016) 1~9
Fig. 11. Main effects plot of surface roughness in Si3N4-TiN composites.
Fig. 13. Main effects plot of taper angle in Si3N4-TiN composites.
Fig. 12. Main effects plot of radial over cut in Si3N4-TiN composites.
Fig. 14. Main effects plot of circularity in Si3N4-TiN composites.
with increase in gap voltage is shown. With increase in gap voltage surface roughness decreases in this composite material. Surface roughness can be reduced by moderate discharge current and application of high gap voltage. 4.4 Taguchi’s analysis for radial over cut In Fig. 12 the general trend of increasing radial overcut with increasing current is shown. With respect to gap voltage there is an overall increase in radial overcut. Top radial could be minimized with application of low discharge current, low gap voltage and increasing di electric pressure. 4.5 Taguchi’s analysis for taper angle
Fig. 15. Main effects plot of cylindricity in Si3N4-TiN composites.
In Fig. 13 the general trend of increasing taper angle with increasing current is shown. Taper angle could be minimized by reducing discharge current and moderate dielectric pressure.
less gap voltage and high pulse off time. 4.7 Taguchi’s analysis for cylindricity
4.6 Taguchi’s analysis for circularity In Fig. 14 elucidates the general trend of circularity increasing with increasing current. Circularity could be minimized by application of low discharge current, low di electric pressure,
In Fig. 15 shows the general trend of cylindricity increasing with increasing current. Cylindricity could be minimized by application of low discharge current, moderate pulse off time and low di electric pressure.
7
Selvarajan L et al. / Journal of Mechanical Science and Technology 30 (11) (2016) 1~9
number of responses and j = number of experiments. Lower values of the EWR, surface roughness, Radial overcut, Taper angle, circularity, cylindricity and Perpendicularity are advantageous. Therefore, Eq. (6) is used to evaluate the S/N ratio values of the experimental results. The results are given in Table 5. Normalisation of the experimental data for each response is completed. Normalisation is often considered a transformation that is carried out by individual data that is entered and can be circulated and measured by a greater analysis, where yij is normalised as Xij (0 ≤ Xij ≤ 1) by applying the equation.
Fig. 16. Main effects plot of perpendicularity in Si3N4-TiN composites.
X ij =
(
yij - min yij ,i = 1, 2,¼¼n
(
)
)
(
max yij ,i = 1, 2,¼¼n - min yij ,i = 1, 2,¼¼n
4.8 Taguchi’s analysis for perpendicularity
(S/N ratio in which a higher value is better)
In Fig. 16 shows the general trend of increase in perpendicularity with increasing current. Perpendicularity could be minimized by application of low discharge current, low gap voltage and with less pulse on time.
X ij =
4.9 Results of optimsation by grey relational analysis The grey-based Taguchi technique is widely used in different fields of engineering to solve multi-response optimization problems. In order to apply the grey-based Taguchi method for multi-response optimization, the following steps are followed:
(5)
where η = the resultant S/N ratio, n = the number of replications, k = number of experiments and yij = the observed response value, where i = 1, 2... n and j = 1, 2... k. i is the response value in the jth experiment. i=number of responses and j = number of experiments. In this research, a higher MRR is advantageous. Therefore, Eq. (5) is used to calculate the S/N ratio values of the MRR. ii) A lower S/N ratio is better: æ1 n 2ö åyij ÷ è n i=1 ø
S/N ratio ( h ) = -10log10 ç
(
(6)
where η = the resultant S/N ratio, n = the number of replications, and yij= the observed response value, where i = 1, 2... n and j = 1, 2... k. i is the response value in the jth experiment. i =
)
)
(
(S/N ratio in which a lower value is better)
) (8)
In this work, for maximizing the performance characteristics and for minimizing the performance characteristic Eqs. (7) and (8), respectively, were used to calculate the normalized values of experimental results. Calculate the grey relational coefficient (GRC) in normalization experimental results.
(
The signal-to-noise (S/N) ratio for the relating experimental results is calculated via Eqs. (5) and (6). i) A higher S/N ratio is better:
(7)
max yij ,i = 1, 2,¼¼n - yij max yij ,i = 1, 2,¼¼n - min yij ,i = 1, 2,¼¼n
)
γ y 0 ( k ) , yi ( k ) =
4.10 Detailed optimization steps using GRA
æ1ö n 1 S/N ratio ( h ) = -10log10 ç ÷ å 2 è n ø i=1 yij
(
)
Dmin + ξDmax D oj ( k ) + ξDmax
(9)
The defined range of 0 £ x £ 1 determines the differentiate of coefficient. The value can be adjusted on the basis of the functional demand in this technique. The results are given in Table 6. The grey relational grade g j is calculated by averaging the grey relational coefficients corresponding to each experiment.
gj=
1 m å g ij k i=1
(10)
where g j the grey relational grade for the jth experiment and ‘k’ is the number of performance characteristics. The values for the grey rank provided in Table 6 are plotted at Fig. 12. Considering the maximisation of the grey rank values, the optimal parameter conditions, A5B4C2D5E5 are obtained. From the value of grey relational grade in Table 6, using Eqs. (9) and (10), the main effects are tabulated in Table 7 and the factor effects are plotted in Fig. 13. The optimal parameter for performance are calculated form Grey Relational analysis and the result are Current = 7A, Pulse on time = 7 μs, Pulse off time = 9 μs, Dielectric Pressure = 18 kg/cm2 and Spark Gap voltage = 40 V.
8
Selvarajan L et al. / Journal of Mechanical Science and Technology 30 (11) (2016) 1~9
Table 5. S/N ratios values of silicon nitride -titanium nitride composites.
Exp. No 1 2 3 4 5 6 7 8 9 10 11 12 13 14 15 16 17 18 19 20 21 22 23 24 25
MRR max -44.7068 -42.7428 -41.7942 -38.7477 -38.011 -38.6023 -36.9584 -41.8792 -40.769 -37.6458 -38.3611 -37.021 -36.7837 -35.6987 -37.8109 -35.2204 -39.7709 -36.2064 -36.3122 -33.1328 -37.5191 -32.4711 -35.256 -34.8033 -27.5754
EWR min 67.1511 71.4235 65.7121 63.0974 64.1395 63.4906 64.3001 69.3269 61.6531 60.9003 65.3216 59.1965 58.4328 57.5022 61.9915 51.9659 57.4441 57.8929 55.8667 52.8735 51.8088 47.9804 50.6731 54.8575 46.1637
Ra min 9.397 7.494 6.596 4.687 7.231 5.006 9.397 8.755 0.848 7.311 6.268 11.904 9.736 10.996 8.802 8.802 4.167 13.474 4.687 18.202 14.2 4.975 7.171 -1.916 9.5
S/N ratio ROC min 25.6809 25.9352 24.8076 24.7324 26.1089 25.5978 26.1089 26.4671 25.5978 24.96 25.1151 24.2944 25.3531 15.8107 23.8774 16.9247 24.2944 15.5988 10.8585 29.3714 24.96 22.4998 12.3247 24.0142 22.9758
θ deg -2.299 1.916 2.9 2.232 2.232 0.103 3.255 -0.021 -0.62 0.489 -1.604 -1.5 -0.266 -12.08 -1.909 -11.861 -2.581 -11.34 -16.667 7.936 2.232 -7.198 -16.374 -6.462 1.916
CIR min 24.1532 23.099 26.1971 24.1532 27.536 24.0142 24.584 24.1532 23.7427 23.3508 25.0372 22.7345 26.559 18.9394 27.9598 23.099 19.829 15.392 14.5642 17.2666 17.4589 13.7659 15.7572 24.8835 23.6101
CYL min 24.1532 25.5155 26.1971 23.6101 26.1971 23.4795 29.3714 29.898 27.1319 23.8774 25.1937 20.5384 29.1196 21.2106 24.7324 27.9598 21.311 23.6101 17.2666 26.1971 19.829 20.6313 15.8107 26.1971 27.9598
PER min 39.1731 27.9598 36.4792 32.7664 33.1525 34.4259 29.3714 40.9161 37.7221 31.7015 38.4174 35.9186 44.438 30.4586 31.3737 26.7458 33.9804 26.9367 15.3411 22.2712 27.3316 17.8568 21.5154 46.0216 13.9371
Table 6. Grey relational co efficient of different trails in Si3N4-TiN composites.
Exp. No 1 2 3 4 5 6 7 8 9 10 11 12 13 14 15 16 17 18 19 20 21 22 23 24 25
MRR 0.3343 0.3619 0.3769 0.435 0.4518 0.4382 0.4782 0.3755 0.3947 0.4606 0.4436 0.4766 0.4829 0.5143 0.4566 0.5294 0.4136 0.4991 0.4961 0.6075 0.4638 0.6373 0.5282 0.5434 1.0000
EWR 0.3767 0.3343 0.3935 0.4282 0.4137 0.4226 0.4115 0.3539 0.4502 0.4625 0.3983 0.4932 0.5082 0.5279 0.4448 0.6862 0.5292 0.5195 0.5665 0.6541 0.6921 0.8753 0.7379 0.5933 1.0000
Ra 0.471 0.517 0.542 0.604 0.524 0.593 0.471 0.486 0.785 0.522 0.552 0.422 0.4643 0.438 0.485 0.485 0.624 0.396 0.604 0.334 0.385 0.594 0.526 1.0000 0.469
Grey relational co-efficient ROC θ 0.3854 0.462 0.3814 0.399 0.3999 0.387 0.4012 0.395 0.3787 0.395 0.3868 0.424 0.3787 0.382 0.3733 0.426 0.3868 0.434 0.3973 0.418 0.3947 0.45 0.4089 0.448 0.3907 0.429 0.6525 0.729 0.4165 0.455 0.6051 0.72 0.4089 0.467 0.6623 0.698 1.0000 1.0000 0.3343 0.334 0.3973 0.395 0.4439 0.566 0.8643 0.977 0.414 0.547 0.4341 0.399
CIR 0.4069 0.4329 0.3644 0.4069 0.3411 0.4102 0.3971 0.4069 0.4167 0.4264 0.3874 0.4427 0.3578 0.5794 0.3343 0.4329 0.5403 0.8146 0.8999 0.6707 0.6587 1.0000 0.7819 0.3906 0.4199
CYL 0.4588 0.4216 0.4051 0.4755 0.4051 0.4798 0.3429 0.3343 0.3845 0.4671 0.4298 0.5994 0.3471 0.567 0.4422 0.368 0.5625 0.4755 0.8297 0.4051 0.6377 0.5947 1.0000 0.4051 0.368
PER 0.3896 0.5346 0.4168 0.461 0.456 0.4401 0.5107 0.3739 0.4038 0.4755 0.3969 0.4229 0.3457 0.4936 0.4802 0.557 0.4456 0.5534 0.9205 0.6591 0.546 0.8046 0.6802 0.3343 1.0000
Grey grade
Rank
0.4122 0.494 0.4418 0.4787 0.4592 0.468 0.4797 0.4316 0.4504 0.4702 0.465 0.4667 0.4214 0.5486 0.4655 0.5197 0.4832 0.5744 0.7511 0.5095 0.5078 0.6229 0.6865 0.4927 0.683
25 10 22 14 20 16 13 23 21 15 19 17 24 6 18 7 12 5 1 8 9 4 2 11 3
9
Selvarajan L et al. / Journal of Mechanical Science and Technology 30 (11) (2016) 1~9
Table 7. Factor effects on grey grade values of Si3N4-TiN composites. Grey relational grade
Parameter 1
2
3
4
5
Optimum level
Difference
Rank
Current
0.4572
0.4598
0.4734
0.5676
0.5986
5
0.1424
1
Pulse on time
0.5257
0.5159
0.4776
0.5862
0.511
4
0.1096
2
Pulse off time
0.5051
0.546
0.5249
0.501
0.4796
2
0.0674
5
Dielectric pressure
0.4745
0.5091
0.5111
0.5175
0.5443
5
0.0708
4
Voltage
0.4571
0.5334
0.5275
0.5001
0.5385
5
0.0825
3
Table 8. ANOVA Analysis of Si3N4-TiN ceramic composites. Factor
SS
DOF
MS
F value
% Contribution
Current
0.0565
4
0.0141
3.810
29.289
Pulse on time
0.0382
4
0.0095
2.567
19.803
Pulse off time
0.0292
4
0.0053
1.432
10.990
Dielectric pressure
0.0260
4
0.0065
1.756
13.478
Gap voltage
0.0362
4
0.0090
2.432
18.766
Error
0.0151
4
0.0037
Total
0.1929
24
7.827
Table 9. Comparison of optimsation techniques.
Sl. No.
Response parameter
Machining parameters in 19 trial of OA
Optimsation techniques Grey relational analysis
Setting level
A4B4C2D5E3
A4B4C2D5E3
1
Machining time (min)
11.184
9.040
2
Material removal rate (g/min)
0.0163
0.2022
3
Electrode wear rate (g/min)
0.0026
0.0012
4
Surface roughness (µm)
0.593
0.585
6
Radial over cut (mm)
0.296
0.234
7
Taper angle (α˚)
6.824
6.558
9
Circularity (mm)
0.147
0.142
10
Cylindricity (mm)
0.197
0.155
11
Perpendicularity (mm)
0.181
0.085
12
Improvement in grade values
0.7511
0.7988
100
4.13 Geometry and roundness of the hole Fig. 18. Factor effects on grey grade values of Si3N4-TiN composite.
4.11 Analysis of variance (ANOVA) ANOVA is performed to identify the significant parameters. The results are given in Table 8. Using the grey grade value, ANOVA is formulated for identifying the significant factors. From ANOVA, it is clear that current (29.289%) influences more on sparking followed by pulse on time (19.803%), spark gap set voltage (18.766%), di electric pressure (13.478%) and pulse off time (10.990%). 4.12 Verification test The Grey grade values for multiple performance characteristics in the Sparking EDM process was greatly improved from 0.7511 to 0.7988. Therefore, the exploratory outcome is confirmed by the optimisation of the EDM parameters using the GRA. Grey grade values corresponding to optimal setting selected by Optimsation techniques like GRA is listed in Table 9.
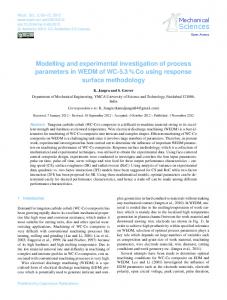
The image of entry holes and exit holes were captured for the purpose of measuring the form error and they are presented in the figures below. The various images, the value of form error for different holes and the optimized form errors are found to be in a good correlation. Under different process parameter conditions 25 holes were machined on Si3N4-TiN with Spark EDM technique. Image of copper electrode used for each hole after machining is furnished as Fig. 19. The furnished image shows the image of EDM drilled holes on work piece with different parametric combination for 25 holes in Si3N4-TiN ceramic composite. These images where obtained by Video Measuring Machine. The top and bottom images of each set shows geometry of the hole at entry (white shaded) and exit (black shaded). Geometrical tolerances are the major element for fitting any component in assembly. To produce leak proof assembly, the machining process is facing a challenge to produce zero out of circularity. The result of optimization coincides with the video measuring machine image which elucidates that 19th hole is the best parametric combination of top and bottom view of hole image and 24th is the worst hole in parametric combina-
10
Selvarajan L et al. / Journal of Mechanical Science and Technology 30 (11) (2016) 1~9
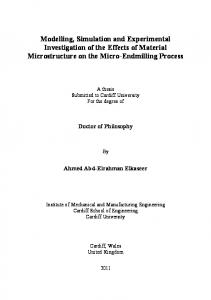
and dielectric pressure 14 kg/cm2. When current, gap voltage, pulse on time and pulse off time and dielectric pressure decreases low MRR is obtained. The circularity, cylindricity and perpendicularity are also not maintained from the entry to exit of the hole. Good circularity, surface finish, cylindricity, taper angle and minimum top and bottom Radial over cut can be clearly seen in the Fig. 20(c). This is because high current rate of the order of 7 amperes, gap voltage of the order of 40V, high pulse on time of the order of 7 µs, pulse off time 9µs and Dielectric pressure 18 kg/cm2 were used during spark EDM. When current, gap voltage, di electric pressure and pulse on time increases and pulse off time decreases high MRR and less electrode wear is obtained thereby improving the accuracy of the drilled holes. 4.14 Regression analysis
Fig. 19. Top and bottom view of the holes by VMM.
Fig. 20. VMM image of best, worst and optimum hole.
tion of top and bottom view taken by Video Measuring Machine. The top and bottom surface diameters are measured using VMM and diameters at intermediate positions are measured with the help of Coordinate Measuring Machine (CMM). Good circularity, surface finish, cylindricity, taper angle, less electrode wear and minimum top and bottom Radial over cut can be clearly seen in the Fig. 20(a). This is because moderate current rate of the order of 6 ampere, pulse on time of the order of 7 micro second, pulse off time 9 micro second, di electric pressure 18 kg/cm2 and gap voltage of the order of 35 V. When current, pulse on time, dielectric pressure and gap voltage increases and pulse off time decreases, high MRR is obtained by improving the accuracy of the drilled holes. The irregularities in roundness and Radial over cut can be clearly seen in the Fig. 20(b).This is because high current rate of the order of 3 amperes and gap voltage of the order of 30.0V, pulse on time of the order of 4 µs , pulse off time 8 µs
To determine output responses at different duty cycle for various Electrodes in EDM of Hot pressed Silicon Nitride Titanium Nitride ceramics composites. Convectional regression analysis for the purpose of developing each response equation as a function of several inputs process parameters. Once, the input and output variables are identified; then the range of each variable can be determined. The range is given as 0-1. Using design expert software the mathematical models are developed to drive the response equation. The coefficients of regression model can be estimated from the experiment result. The effects of these variables and the interaction between them were included in this analyses and the developed model is expressed as interaction equation Estimated Regression Coefficients for Material Removal Rate = - 0.258400- 0.013906*C - 0.023832*Pon 0.002008*Poff + 0.023062*DP + 0.009496V + 0.000733C2 + 0.001440*Pon2 + 0.000625*Poff2 0.000730*DP2 - 0.000104*V2 +0.002222*C*Pon 0.000930*C*Poff +0.000119*C*DP +0.000103*C*V +0.000095*Pon*Dp -0.000133Pon*V -0.000130Poff*V Estimated Regression Coefficients for Electrode Wear Rate = -0.030453-0.004884*C-0.003416*Pon + 0.000675*Poff + 0.000675*DP + 0.001082*V + 0.000237C2 + 0.000209*Pon2 +0.000075*Poff2 -0.000122*DP2 0.000012*V2 +0.000184*C*Pon -0.000144*C*Poff +0.000080*C*DP +0.000063*C*V +0.000046*Pon*DP 0.000017*Pon*V -0.000036*Poff*V Estimated Regression Coefficients for Surface Roughness = 5.73178+0.57725*C+0.81207*Pon+1.19304*Poff1.55358*DP- 0.09010*V+0.04784C2-0.00445*Pon20.02522*Poff2+0.04128*DP2+0.00669*V20.02536*C*Pon - 0.04015*C*Poff+0.04252*C*DP0.03474*C*V-0.01053*Pon*DP-0.01394*Pon*V0.01446*Poff*V
Selvarajan L et al. / Journal of Mechanical Science and Technology 30 (11) (2016) 1~9
Estimated Regression Coefficients for Radial over cut = 0.202313 + 0.031805*C-0.174862*Pon +0.091988*Poff 0.187347*DP +0.072622*V -0.006723C2 -0.011911*Pon2 -0.004593*Poff2 +0.003260*DP2 -0.001092*V2 0.003219*C*Pon +0.005526*C*Poff0.003808*C*DP+0.002513*C*V+0.018304*Pon*DP +0.001376* Pon*V -0.001256*Poff*V Estimated Regression Coefficients for Taper Angle=51.8609+2.8000*C-2.4615*Pon+4.1056*Poff 7.6581*DP -0.4593*V -0.2140C2 -0.3759*Pon2 0.2212*Poff2 +0.1636*DP2 +0.0037*V2-0.2877*C*Pon +0.0806*C*Poff -0.0311*C*DP +0.0428*C*V +0.4264*Pon*DP +0.0461*Pon*V-0.0196*Poff*V Estimated Regression Coefficients for Circularity = 0.251783 -0.077612*C -0.060574*Pon +0.047870*Poff 0.109485*DP +0.043704*V +0.000995*C2 0.005384*Pon2-0.000867*Poff2 +0.002321*DP2 0.000789*V2 -0.002757*C*Pon -0.001609*C*Poff +0.004537*C*DP +0.001484*C*V +0.002891*Pon*DP +0.002693*Pon*V -0.000933*Poff*V Estimated Regression Coefficients for Cylindricity = 0.234130 +0.054552*C -0.125441*Pon +0.101448*Poff 0.288529*DP +0.109154*V +0.001430*C2 0.003145*Pon2 -0.001766*Poff2 +0.007688*DP2 0.001165*V2 -0.006815*C*Pon +0.005855*C*Poff 0.003731*C*DP -0.000428*C*V +0.010010*Pon*DP +0.001013*Pon*V -0.003073*Poff*V Estimated Regression Coefficients for Perpendicularity = 0.406895 -0.336429*C -0.238959*Pon +0.142266*Poff 0.124769*DP +0.110092*V +0.006700*C2 +0.005073*Pon2 -0.002497*Poff2 +0.001577*DP2 0.001325*V2 +0.012515*C*Pon -0.000327*C*Poff +0.007771*C*DP +0.002672*C*V +0.008583*Pon*DP 0.000165*Pon*V -0.002388*Poff*V In all above equations c denotes current, Pon denotes pulse on time, Poff denotes pulse off time, DP denotes di electric pressure and V denotes gap voltage.
11
5. Conclusion Multi parametric optimization of Si3N4-TiN ceramic composites using copper electrode were done using Grey relational analysis approach and the following conclusions are drawn: (1) The effect on MRR improves when discharge current and pulse on time is increased whereas there is not much influence is observed when pulse off time is increased and there is very little increase improving the fluxing condition. (2) The EWR increases when discharge current and pulse on time is increased, when gap voltage is decreased whereas there is no significant change when pulse off time and di electric pressure are increased. (3) The surface roughness decreases when discharge current is decreased whereas on increasing gap voltage surface roughness is observed to be low and there is no significant impact of improving di electric pressure on surface roughness. (4) The Top radial overcut decreases when current decreases, pulse off time, di electric pressure increases and when gap voltage decreases. (5) Decreasing taper angle current should be reduced; pulse off time must be increased whereas dielectric pressure and gap voltage should be moderate. (6) Circularity decreases if current is decreased, di electric pressure and gap voltage is decreased and if pulse off time is increased. Cylindricity is decreased by decreasing current and di electric pressure and applying moderate pulse off time. Perpendicularity is reduced by decreasing current, pulse on time and gap voltage. (7) The appropriate combination of results has been yielded by factor level settings A4B4C2D5E3 which resembles 19th experimental parametric combination obtained for grey relational analysis approach. (8) Results of confirmation test shows that the improvement in grey grade values in grey relational analysis was 0.0454. (9) The experimental results for optimal settings illustrated that there was a considerable improvement in the Performance characteristics viz., Material Removal Rate, Tool Wear Rate, Wear Ratio, Surface Roughness, Radial over cut, Taper angle, Circularity, Cylindricity, Perpendicularity and Run out , during the spark EDM processes.
References 2
Absolute fraction of variance (R ) for MRR Removal Rate (MRR) = 0.8650 Electrode Wear Rate (EWR) = 0.9442 Surface Roughness (Ra) = 0.6699 Radial over cut (ROC) = 0.720 Taper angle (θ) = 0.7522 Circularity (CIR) = 0.8717 Cylindricity (CYL) = 0.8107 Perpendicularity (PER) = 0.9074
[1] C. Liu and J. L. Huang, Effect of the electrical discharge machining on strength and reliability of TiN/Si 3 N 4 composites, Ceramics International, 29 (6) (2003) 679-687. [2] R. K. Garg, K. K. Singh, A. Sachdeva, V. S. Sharma, K. Ojha and S. Singh, Review of research work in sinking EDM and WEDM on metal matrix composite materials, The International Journal of Advanced Manufacturing Technology, 50 (5-8) (2010) 611-624. [3] H. S. Shin, M. S. Park, B. H. Kim and C. N. Chu, Recent researches in micro electrical machining, International Jour-
12
Selvarajan L et al. / Journal of Mechanical Science and Technology 30 (11) (2016) 1~9
nal of Precision Engineering and Manufacturing, 12 (2) (2011) 371-380. [4] R. Ji, Y. Liu, R. Diao, Y. Zhang, F. Wang, B. Cai and C. Xu, Experimental research on electrical discharge machining characteristics of engineering ceramics with different electrical resistivities, The International Journal of Advanced Manufacturing Technology, 75 (9-12) (2014) 1743-1750. [5] G. S. Prihandana, M. Mahardika, M. Hamdi and K. Mitsui, Effect of low-frequency vibration on workpiece in EDM processes, Journal of mechanical science and technology, 25 (5) (2011) 1231-1234. [6] C. Wei, L. Zhao, D. Hu and J. Ni, Electrical discharge machining of ceramic matrix composites with ceramic fiber reinforcements, The International Journal of Advanced Manufacturing Technology, 64 (1-4) (2013) 187-194. [7] D. Bhaduri, A. S. Kuar, S. Sarkar, S. K. Biswas and S. Mitra, Electro discharge machining of titanium nitride-aluminium oxide composite for optimum process criterial yield, Materials and Manufacturing Processes, 24 (12) (2009) 1312-1320. [8] F. M. Bucciotti, Mazzocchi and A. Bellosi, Perspectives of the Si3N4 -TiN ceramic composite as a biomaterial and manufacturing of complex-shaped implantable devices by electrical discharge machining (EDM), Journal of applied biomaterials & biomechanics: JABB, 8 (2010) 28-32. [9] N. Ahmad and H. Sueyoshi, Properties of Si3N4–TiN composites fabricated by spark plasma sintering by using a mixture of Si3N4 and Ti powders, Ceramics International, 36 (2010) 491-496. [10] N. Ahmad and H. Sueyoshi, Microstructure and mechanical properties of silicon nitride–titanium nitride composites prepared by spark plasma sintering, Materials Research Bulletin, 46 (3) (2011) 460-463. [11] N. Ahmad and H. Sueyoshi, Densification and Mechanical Properties of Electroconductive Si 3 N 4-Based Composites Prepared by Spark Plasma Sintering, SainsMalaysiana, 41 (8) (2012) 1005-1009. [12] J. A. Sanchez, L. L. Cabanes, I., de Lacalle and A. Lamikiz, Development of optimum electrodischarge machining technology for advanced ceramics, The International Journal of Advanced Manufacturing Technology, 18 (12) (2001) 897905. [13] H. K. Yoo, W. T. Kwon and S. Kang, Development of a new electrode for micro-electrical discharge machining (EDM) using Ti (C, N)-based cermet, International journal of precision engineering and manufacturing, 15 (4) (2014) 609-616. [14] K. M. Patel, P. M. Pandey and P. V. Rao, Optimisation of process parameters for multi-performance characteristics in EDM of Al2O3 ceramic composite, The International Journal of Advanced Manufacturing Technology, 47 (9-12) (2010) 1137-1147. [15] L. Selvarajan, C. S. Narayanan and R. Jeyapaul, Optimisation of EDM Parameters on Machining Si3N4-TiN Composite for Improving Circularity, Cylindricity and Perpendicularity, Materials and Manufacturing Processes, DOI:
10.1080/10426914.2015.1058947 (2015). [16] L. Selvarajan, C. S. Narayanan and R. Jeyapaul, Optimization of Process Parameters to Improve Form and Orientation Tolerances in EDM of MoSi2-SiC Composites, Materials and Manufacturing Processes, DOI:10.1080/10426914.2014. 962041 (2014). [17] R. Ramanujam, N. Muthukrishnan and R. Raju, Optimization of cutting parameters for turning Al-SiC (10p) MMC using ANOVA and grey relational analysis, International Journal of Precision Engineering and Manufacturing, 12 (4) (2011) 651-656. [18] G. K. Singh, V. Yadava and R. Kumar, Diamond face grinding of WC-Co composite with spark assistance: experimental study and parameter optimization, International Journal of Precision Engineering and Manufacturing, 11 (4) (2010) 509-518. [19] P. Chinnaiyan and A. K. Jeevanantham, Multi-objective optimization of single point incremental sheet forming of AA5052 using Taguchi based grey relational analysis coupled with principal component analysis, International Journal of Precision Engineering and Manufacturing, 15 (11) (2014) 2309-2316.