trol only, servo control with friction compensation, servo control ... numerical simulation, there will be a ripple in velocity as shown in Figure 3b. For example ...
MODULAR CONTROL FOR MACHINE TOOLS: CROSS-COUPLING CONTROL WITH FRICTION COMPENSATION
∗
B.-C. Chen, D. M. Tilbury, and A. G. Ulsoy Department of Mechanical Engineering and Applied Mechanics University of Michigan Ann Arbor, Michigan 48109-2125 {bochen, tilbury, ulsoy}@engin.umich.edu
ABSTRACT In this paper, we consider the combination of two different types of auxiliary control modules applied to a two-axis machining system. It is known that a cross-coupling control algorithm can reduce the contour error of a two-axis system, and that friction compensation can reduce positioning errors in machining systems. Here, we address the question of how the overall performance of the system is affected when both types of control are applied at the same time. Preliminary results indicate that the performance improvement is multiplicative. That is, if the error is reduced by a factor of Pcc for cross-coupling control, by a factor of Pf c for friction compensation, and by a factor of Pcc,f c when both are applied simultaneously, then Pcc,f c ≈ Pcc · Pf c . Simulation and experimental results are presented. INTRODUCTION In a conventional multi-axis machine tool system, each axis is controlled by a separate servo loop, which is designed to minimize the axial position error (Koren, 1983). Even with welldesigned servo algorithms, these types of conventional decoupled control strategies cannot control a machine tool with enough accuracy to meet the increasing precision requirements for newly designed parts. Many different types of auxiliary control modules for machine tool control have been proposed, and researchers in academia have shown how these additional control modules can increase the performance of a machining system. The problem considered in this paper is how the combination of different types of control modules affects the overall performance of the machining system. As an example, we consider the combination of cross-coupling control and friction compensation. Cross-coupling control algorithms can reduce the contour error of a two-axis system when complex contours are desired (Koren, 1980; Koren and Lo, 1991, 1992; Srinivasan and Kulkarni, 1990). The actual positions and references for both axes are compared, and a control input is commanded which minimizes the contour error, instead of the axis errors. Friction compensation can also be used to reduce positioning errors in machining systems (Tomizuka et al., 1993). A mathematical model of the frictional force is used to compute a feedback term which is added ∗ This research was supported in part by the NSF-ERC for Reconfigurable Machining Systems at the University of Michigan, under grant number NSF-EEC 9529125.
to the control to compensate for the effects of friction. In addition to cross-coupling control and friction compensation, many other strategies have been proposed to improve performance in machining systems. In this paper, we address the question of how the overall performance of the system is affected when multiple types of control modules, with different objectives, are applied to the machining system simultaneously. We use cross-coupling control and friction compensation as two examples of control modules which might be desirable for a highprecision machining system. We compare the performance of the machining system (defined here as the contour error for a circular reference) with four different combinations of these control modules — decoupled servo-only control strategy, added friction compensation, cross-coupling control, and finally, both friction compensation and cross-coupling control. Simulation and experimental results are presented. This preliminary research raises some significant further questions for machine tool and control research in general. Will adding other types of control modules to the system (such as force control) continue to improve the performance, or are some types of control modules inherently incompatible? How can the best combination of control modules be chosen for a particular application? New advances in open-architecture control systems will enable many different control algorithms to be implemented on a system (Park et al., 1995); this paper represents a first step towards deciding how best to take advantage of the freedom afforded by these new implementations. The paper is organized as follows. First, the two-axis machine tool and its mathematical model is described. Then, the friction model and compensation strategy are presented; a modified Coulomb friction model with stiction is used. The crosscoupling control algorithm is then presented. This entails building a model of the contour error in real-time (based on the interpolator commands and the actual position measurement) and then applying a corrective compensation term to the system to minimize the contour error. Simulation results are summarized for the four different scenarios which are considered: servo control only, servo control with friction compensation, servo control with cross-coupling, and finally, friction compensation combined with cross-coupling control. The paper ends with experimental results and conclusions.
−3
Friction Force Linear Guide
1.5
Fs
1
Fc
Ball Screw
Velocity
Bearings Nut
Velocity (m/sec), Force (N)
+ Motor
x 10
Table
Input Force, U Coulomb Friction, F Velocity, v 0.5
0
−0.5
−1
-Fc
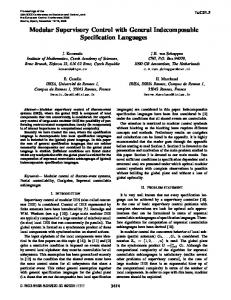
Figure 1: Axis drive train elements.
-Fs −1.5 0.95
u
+
K τs + 1
Voltage
v Velocity
1.1
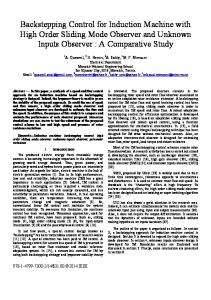
Figure 3: Coulomb friction model, and simulated response near zero velocity. The numerical integration granularity causes the velocity to oscillate about zero, resulting in large changes in the Coulomb friction value.
Position
Gain Disturbance Torque
Figure 2: Block diagram for Figure 1. MACHINE TOOL MODEL The system that we consider in this paper is a machine tool X-Y table with each axis moving on a linear slide, driven through a ball screw by a DC motor. A model of a single axis of a two-axis machine tool is depicted in Figures 1 and 2. Each axis is modeled as a second-order type-one system:
Y (s) K = U (s) s(τ s + 1)
1.05
b. Zero-velocity response.
y 1 s
+ Disturbance ud Voltage
Td
1 Time (sec)
a. Friction model.
(1)
The time constant τ and overall gain K are determined experimentally on a Robotool three-axis milling machine that is located at the University of Michigan (Koren et al., 1996). Both position and velocity feedback are assumed to be available to the control designer. The source of the friction force (Tomizuka et al., 1993) in the system includes the motor and ball screw bearings, the interface between the screw and nut, and the linear guide. This frictional force is modeled simply as a disturbance voltage ud to the single axis system.
FRICTION MODELING AND COMPENSATION Friction is always present in any physical system, and has been extensively studied in the literature; see, for example, (Canudas de Wit et al., 1986; Kubo et al., 1986; Tomizuka et al., 1985). It is difficult to model, but is important to consider, because it can have a deleterious effect on a system’s performance. In this section, we first describe a classical friction model, including Coulomb friction combined with stiction. We then describe how we have modified this model to make it appropriate for numerical simulation. Finally, we discuss our friction compensation control module.
Classical friction model In the classical Coulomb friction model (Suzuki and Tomizuka, 1991), there is a constant friction force opposing the motion when the velocity is nonzero. At zero velocity, the stiction force will oppose all motion as long as the magnitude of the input force is smaller than the stiction level. This model is represented graphically in 3a. The mathematical model of the combined stiction and Coulomb friction forces is described by
( F =
Fc sgn v |U | sgn U Fs sgn U
v 6= 0 v = 0, |U | < Fs v = 0, |U | ≥ Fs
(2)
where Fc is the absolute magnitude of Coulomb friction force, Fs is the absolute magnitude of stiction force, v is the velocity of X- or Y -axis, and U is the input force. The values used for the magnitudes of the stiction and Coulomb friction forces are Fs = 0.0011 and Fc = 0.001 Newtons respectively. If this mathematical model of Coulomb friction is used in a numerical simulation, there will be a ripple in velocity as shown in Figure 3b. For example, when U is zero and v is positive and nonzero, v will decrease to zero and the table should stop due to the frictional force F . However, when the velocity v is very close to zero, some frictional force F is still acting on the table. When v goes to zero, there should be no friction acting on the table and the table should stop. However, it is difficult to integrate a function numerically and get exactly zero velocity. Thus, the Simulink integration routine will overshoot zero velocity and a negative velocity will result. This negative velocity will cause a positive friction force F to be applied to resist the movement of the table, which may again cause an overshoot, and as a result, the velocity v may oscillate around zero.
Modified friction model This velocity ripple problem may be dealt with by redefining the “zero” velocity. When v is within the range of redefined zero velocity, the table is assumed to have no movement and only stiction forces are active. The small nonzero velocity will be damped out by the viscous damping of the table, i.e., it will not
−3
Friction Force
x 10
Instantaneous tangent
(x0,y0)
Fs
1
Fc
+δ
Velocity
Velocity (m/sec), Force (N)
−δ
1.5
Input Force, U Coulomb Friction, F Velocity, v
ρ (Radius of curvature)
0.5
0
−0.5
R (Reference position) −1
-Fc
Approximated ε
Y-axis
-Fs
−1.5 0.95
1
1.05
1.1
Time (sec)
a. Redefined friction model.
A
b. Zero-velocity response.
Figure 4: Redefined Coulomb friction model, and simulated response. When the velocity is approximately zero (between ±δ), the frictional force exactly cancels the input force U .
Ey
Real ε
Desired contour
Ex P (Actual tool position) θ X-axis
Figure 5: Actual and approximated contour error models. affect the position very much. We have chosen zero velocity to be redefined as a value bounded by ±δ, where δ is a very small number, obtained by trial and error. Different values of δ near zero were tried until no ripple in the velocity was present; δ = 10−4 m/sec was chosen for simulation purposes. The redefined mathematical model is represented in equation (3) and Figure 4a; the simulation results using this model, shown in Figure 4b, show that no velocity ripple remains.
( F =
|v| > δ |v| ≤ δ, |U | < Fs |v| ≤ δ, |U | ≥ Fs
Fc sgn v |U | sgn U Fs sgn U
(3)
Friction compensation The friction compensation control module that is used in this research is fairly straightforward. It is assumed that the friction model presented above is known to be present in the system. The constants Fc and Fs are approximately identified off-line; their identified values are represented by Fˆc and Fˆs . The friction compensation control module uses the measured velocity to compute the instantaneous frictional force, and applies a feedforward control signal to cancel out the effect of the friction. For simulation purposes, it is assumed that the identified frictional values are some fraction of the actual friction: Fˆc Fˆs
=
αFc
(4)
=
αFs
(5)
where α is a fractional value less than one, α ∈ (0, 1). Thus, the friction compensation control module compensates for some fraction, but not all, of the actual friction that is present in the system. The parameter δ is assumed to be known. Various values of α are considered such as α = 0.5, 0.8, etc. For simplicity, the same value of α for both parameters Fˆc and Fˆs is assumed.
CROSS-COUPLING CONTROLLER The main idea of a cross-coupling control module is to use feedback to minimize the contour error instead of the individual axis errors, since that is more important from a performance
standpoint. The cross-coupling control strategy was first proposed by Koren (1980). The typical procedure for implementing a cross-coupling control module is to first build a contour error model in real time, based on the feedback information from all the axes as well as the interpolator. Then, an optimal compensating law is found which will minimize the contour error based on the error model. Finally, a feedback correction signal is sent to the individual axes. Thus, a cross-coupling control module includes two major components: the contour error model and the control law. The variable-gain cross-coupling controller, recently proposed by Koren and Lo (1991, 1992), demonstrated excellent tracking ability on an experimental system and is summarized below. The contour error model that was used is shown in Figure 5. The approximate contour error ε depends on both the individual axis errors Ex and Ey as well as the tangent angle θ to the reference trajectory and the instantaneous radius of curvature ρ of the reference contour; it is given by ε = −Ex Cx + Ey Cy
(6)
where the parameters Cx and Cy are defined by the following formulas: Cx
=
Cy
=
Ex 2ρ Ey cos θ + 2ρ sin θ −
(7) (8)
Note that these parameters depend not only on the reference trajectory parameters θ and ρ but also on the axis errors Ex and Ey ; thus even the approximated contour error is a nonlinear function of the axis errors. The axial position errors Ex and Ex are measured in real time; the tangent angle θ and radius of curvature of the reference trajectory ρ are calculated at each sampling time based on the interpolator data. The goal of the cross-coupling controller is to move the cutting tool P to the contour at point A (which is the closest instantaneous point on the circle) rather than R (which is the current reference position). The X- and Y -components of the tangent vector (cos θ and
Axial error Ex
X-Axis controller
+
−4
Control command Ux (To servo drive)
x 10
1.195
1.19 Approximate Actual
Cx
-
ε
Contour Error (m)
Cx
Cross-coupling controller
W(z)
+
1.185
1.18
1.175
1.17
Cy
Cy
1.16 35
+
Y-Axis controller
Ey
1.165
40
45 Angular Position (degree)
50
55
+ Uy
Figure 7: Maximum contour error, enlarged view.
Figure 6: Cross-coupling controller block diagram. sin θ) and the radius of curvature (ρ) for a general contour can be computed by
· t ¯
=
ρ
=
cos θ sin θ
¸
=
p
1 dy
1+( dx )2 dy/dx
p
(9)
dy 1+( dx )2
dy 2 1.5 (1 + ( dx ) ) dy 2 ( dx )
(10)
Based on the above contour error model, a cross-coupling controller with a PID control law W (z) = WP + WI
Tz z−1 + WD z−1 Tz
(11)
was implemented in a Simulink simulation. The block diagram of a two-axis cross-coupling control system is shown in Figure 6. The estimated contour error ε is given by equation (6). The block labeled W (z) is a PID controller, defined by equation (11) which compensates for the instantaneous contour error. This control signal is added to the output of the axis servo-controllers, and sent as the final control command to the servo motors. The PID gains WP , WI and WD were chosen to give good performance in simulation. A variation of the same controller where all three control gains are increased by 25% is also examined. Increasing the gain of the cross-coupling PID controller can decrease the contour error up to a point, but can also result in instability if the gain is too high. As noted above and illustrated in Figure 7, the contour error model ε of equation (6) only approximates the actual contour error. The actual contour error is used to evaluate the controllers considered in this paper. A circular reference trajectory with radius r and center (xc , yc ) is used as the desired reference trajectory. For this reference, the actual contour error ² can be computed as a function of the actual tool position (Px , Py ): ²(t) =
p
error model is not identical to the actual contour error model. However, they differ by no more than 5% around the circular trajectory. Although the approximate contour error model ε of equation (6) is used in the cross-coupling controller, the actual contour error ² defined in equation (12) will be used to evaluate the performance of the various control configurations considered in this research.
(Px (t) − xc )2 + (Py (t) − yc )2 − r
(12)
An enlarged view showing the difference between the maximum contour error for both the actual and approximate contour errors is shown in Figure 7. As can be seen, the approximate contour
SIMULATION ANALYSIS In order to evaluate the expected performance of the different control modules, a simulation model of the two-axis machining system was built in Simulink. A second-order type I linear model was used for each axis, and the friction model was included on each axis. As a baseline for comparison, PID servo controllers for each axis were designed. Four different control strategies were analyzed and compared in a variety of simulations: 1. PID control on each axis 2. PID with cross-coupling control 3. PID control with friction compensation 4. PID with cross-coupling and friction compensation The reference trajectory was a circular contour; two different feedrates were evaluated (Vf = 1.88 m/min and Vf = 0.94 m/min). In addition, a variety of gains were used in both the friction compensation and cross-coupling control.
Without Friction Compensation First we evaluated the relative performance of the PID and cross-coupled controllers for the ideal plant without any friction. Thus, the disturbance input to each axis which models friction was disconnected. The friction compensation control modules were also disabled by setting the gain α to zero. As expected, the cross-coupling controller outperformed the PID controller at both high and low feedrates; the simulation results are presented in Figure 8. The integral action on the cross-coupling controller decreases the contour error as the circle is traversed. In the physical set-up, friction will be present in the motor, slides, etc. In order to best evaluate the expected performance
−5
12
−4
x 10
−5
3.5
10
x 10
3
3
−4
50% Friction compensation
x 10
2 CCC PID CCC with F.C. PID with F.C.
2.5
50% Friction compensation
x 10
1.8 1.6
2.5
CCC PID 1.5
1
Contour error (m)
4
CCC PID CCC with F.C. PID with F.C.
1.4 2
2
Contour error (m)
CCC PID 6
Contour error (m)
Contour error (m)
8
1.5
1.2 1 0.8
1 0.6
2 0.5
0.4 0.5
0
−2 0
0
50
100
150 200 250 Angular position (deg)
300
350
a. High feedrate
400
−0.5 0
0.2
50
100
150 200 250 Angular position (deg)
300
350
400
b. Low feedrate
Figure 8: Contour error comparison of PID and cross-coupling controllers for one revolution of the circular reference with a frictionless plant model.
0 0
50
100
150 200 250 Angular position (deg)
300
350
400
0 0
50
a. High feedrate
100
150 200 250 Angular position (deg)
300
350
400
b. Low feedrate
Figure 9: Contour error comparison with friction compensation for PID and cross-coupling controllers; friction included in plant model. −3
With Friction Compensation Another control module considered in this paper is that of friction compensation, described in Section . We assume that some fraction of the actual friction present in the system is identified off-line. Thus, the friction compensation contribution to the motor input is Fˆ = αF , where Fˆ is the friction estimation and F is the actual friction in the system, described by equation (3) and sketched in Figure 4a. It is assumed that both stiction and Coulomb friction are identified, each at the same fraction α. The performances of the PID and cross-coupling controllers with added friction compensation are evaluated for both high and low feedrates, as before. The results are shown in Figure 9. As expected, the friction compensation reduces the magnitude of the quadrant glitches, where the stiction dominates. Unexpectedly, however, the addition of friction compensation control modules on the two axes slightly increases the contour error between these quadrant glitches. The magnitude of this increase is much less than the magnitude of the decrease, and thus the friction compensation improves the overall performance of the system.
6
x 10
5 Reference Actual 4 Y−position (m)
of the controllers, friction should also be modeled in the simulation. The modified Coulomb/stiction model of friction which was defined in equation (3) was added to the Simulink simulation, and the simulations from Figure 8 were rerun. The results of these simulations are shown in Figure 9. The friction compensation control modules were still disabled, with a gain α of zero. Although the cross-coupling controller still outperforms the PID controller, the contour error is greatly increased in magnitude. In addition, the stiction which is present when one of the axes changes direction causes large spikes in the contour error at the four quadrants. In the following section, we will describe how we used a friction compensation algorithm to reduce the effect of these quadrant glitches.
3
2
1
0 0.016
0.017
0.018
0.019
0.02 0.021 X−position (m)
0.022
0.023
0.024
Figure 10: Enlargement of quadrant glitches due to stiction at 103◦ , using PID controller. better than the PID controller. An enlargement of the actual contour around 103◦ is shown in Figure 10. Because it can coordinate the two axes, it can minimize the contour errors (which is the ultimate performance metric) instead of just the axis errors. As expected, the magnitude of the errors increases as the feedrate increases (the sample time is held constant). The addition of friction compensation control modules improves the overall performance of both the PID and cross-coupling controllers, mostly by reducing the quadrant glitches. The performance criteria that are used are the ITAE, which is the integral of the time multiplied by the absolute value of the error, and the IAE, which is the integral of the absolute value of the error. Both errors are integrated along the desired circular contour are used as performance criteria to evaluate the four control configurations. Both high and low feedrates were considered. The two performance criteria are defined by: ITAE
=
X
ti |²i |
i
IAE
=
X
|²i |
(13)
i
Discussion of Simulation Results As demonstrated in Figures 8 and 9, the addition of the cross-coupling control module allows the performance of the system to be improved, with or without friction modeled in the plant. The cross-coupling controller reduced quadrant glitches
where ²i is the contour error at the ith sampling time. The performance comparisons of PID controller, crosscoupling controller, PID controller with friction compensation, and cross-coupling controller with friction compensation are shown in Table 1. In order to more easily compare the performances of the different control strategies, we define the per-
Axial Controller
8-bit D/A converter
PWM
Motor
Timing-belt pulley ratio
Leadscrew Pitch
Linear Encoder
Position Output
Power Supply
Figure 11: Open-loop block diagram of X-axis. Control commands are issued from the computer in PWM number; the command voltage is amplified and sent to the motor, which turns the leadscrew and drives the table in the X direction. A linear encoder is used to measure the axis position.
TABLE 1: Performance factors for different control configurations and gain variations. For all variations, the performance factor when both types of control (cross-coupling and friction compensation) are included is approximately equal to the product of the performance factors of the individual control modules, or, as noted in equation (15), Pcc,f c ≈ Pcc · Pf c .
(14)
Performance High Feedrate Factor ITAE IAE Pcc 0.2815 0.3226 Pf c 0.8764 0.8696 Pcc,f c 0.2495 0.2815 Pcc · Pf c 0.2467 0.2805 50% friction compensation, nominal
Low Feedrate ITAE IAE 0.3488 0.3778 0.8035 0.7931 0.2831 0.3003 0.2803 0.2996 cross-coupling gain
We use the notation Pcc for the performance factor of the crosscoupling controller, Pf c for the friction compensation controller, and Pcc,f c for the combination of both cross-coupling and friction compensation. We will compare this performance factor to the product of the two individual performance factor, Pcc · Pf c . Our simulation results, as presented in Table 1, indicate that these are approximately equal, that is
Performance High Feedrate Factor ITAE IAE Pcc 0.2815 0.3226 Pf c 0.8022 0.7911 Pcc,f c 0.2305 0.2569 Pcc · Pf c 0.2258 0.2552 80% friction compensation, nominal
Low Feedrate ITAE IAE 0.3488 0.3778 0.6861 0.6686 0.2438 0.2536 0.2393 0.2526 cross-coupling gain
formance factor relative to the baseline PID strategy. Pcc =
IT AE(CC) IAE(CC) or IT AE(P ID) IAE(P ID)
Pcc,f c ≈ Pcc · Pf c
(15)
In order to evaluate whether this multiplicative performance improvement would hold in other cases, we performed a set of three other simulation experiments. The friction compensation gain was increased from 50% to 80%, the cross-coupling gain was increased by 25%, and finally, both of these variations were implemented. The results from these additional simulations are also presented in Table 1. The multiplicative performance improvement of equation (15) appears to hold in all of these cases.
EXPERIMENTAL RESULTS The control strategies considered in this paper were implemented on a Robotool three-axis milling machine at the University of Michigan (Koren et al., 1996). The open-loop block diagram of the X-axis of this machine tool is shown in Figure 11. The axial control command comes from the computer which calculates the control algorithm. This command is amplified and is sent to the motor; control commands are issued from the computer as a PWM (pulse-width modulation) number. The motor turns a leadscrew, as shown in Figure 1, which moves the table in the X direction. A linear encoder on the X axis is used to measure the actual position of the table; this value is used as feedback to the control algorithm for both the PID servo control and the cross-coupling control algorithm. Velocity feedback for the friction compensation is obtained by differentiating the position signal. Before implementing the control strategies on the milling machine system, we performed some simple system identification to identify the gains, time constants, and friction parameters. The gains of the components are listed below. The drive gain is defined as the gain of the part of the system enclosed by the dashed line in Figure 11.
Performance High Feedrate Low Feedrate Factor ITAE IAE ITAE IAE Pcc 0.2368 0.2752 0.2993 0.3268 Pf c 0.8764 0.8696 0.8035 0.7931 Pcc,f c 0.2102 0.2403 0.2431 0.2597 Pcc · Pf c 0.2075 0.2393 0.2405 0.2592 50% friction compensation, 125% cross-coupling gain Performance High Feedrate Low Feedrate Factor ITAE IAE ITAE IAE Pcc 0.2368 0.2752 0.2993 0.3268 Pf c 0.8022 0.7911 0.6861 0.6686 Pcc,f c 0.1943 0.2192 0.2096 0.2194 Pcc · Pf c 0.1900 0.2177 0.2053 0.2185 80% friction compensation, 125% cross-coupling gain • Drive gain = 0.1800 and 0.1808 [(rev/sec)/PWM #] for Xand Y -axis, respectively. • Timing-belt pulley ratio = 0.3 [rev/rev] for X- and Y -axis. • Leadscrew pitch = 5.08 [mm] for both X- and Y -axes. • Linear encoder gain = 100 [pulses/mm] for both X- and Y -axes. The time constant for each axis was determined to be • X-axis: 0.055 [sec] • Y -axis: 0.049 [sec] We also ran several experiments to determine the friction parameters of the actual system using equation (3) as the friction model. The experimental procedure is described below.
25
20
20
15
5 0 −5 −10
5 0 −5 −10 −15
−15
−20
−20 −25 −150
TABLE 2: System parameters used for control design.
10
10
Angular Velocity (rev/sec)
Angular Velocity (rev/sec)
15
−100
−50
0 Voltage (PWM#)
50
100
150
a. X-axis.
−25 −150
−100
−50
0 Voltage (PWM#)
50
100
150
b. Y -axis.
parameter K τ Fˆs Fˆc
Figure 12: The relationship between the voltage and angular velocity for the two axes. Data points marked by “+” are the steady-state angular velocities of the step responses. A linear function with a deadzone was fit to the experimental data to determine the magnitudes of Fˆs and Fˆc .
units [(rev/sec)/PWM #] [sec] [PWM #] [PWM #]
X-axis 0.1800 0.055 10 8
Y -axis 0.1808 0.049 10 8
0.8 CCC PID CCC w/ F.C. PID w/ F.C. 0.6
2. Increase the control input until the motor starts to move. 3. Record this value of the control input as Fˆs . 4. Choose several equally spaced control input values which are greater than Fˆs . 5. Apply these control inputs to the motor and record the steady state velocity. 6. Use a first order equation to fit these data points. 7. Fˆc is equal to the control input which corresponds to zero velocity. The results of these experiments for the X and Y axes are shown in Figure 12. The Coulomb friction is different for the positive and negative directions, and for the two axes, but the maximum stiction level was the same for both axes and for both directions. The levels of friction were determined to be: • 18 PWM # for both axes in both directions • +12 PWM # for the positive direction on the X axis • -8 PWM # for the negative direction on the X axis • +16 PWM # for the positive direction on the Y axis • -13 PWM # for the negative direction on the Y axis Because the friction compensation control algorithm uses 50% of the identified friction in a feedforward manner, the control that we implemented used a stiction level of Fˆs = 10 PWM # and a Coulomb friction level of Fˆc = 8 PWM #. The system parameters for the controller design are shown in Table 2. In the experiment, a circular reference trajectory is followed with feedrate Vf = 1.88 m/min and a radius of 0.02 m. Air cutting conditions were used. The experimental contour error is shown in Figure 13. Comparing with the simulation results shown in Figure 9a, in which the same control parameters were used, it is still true that the cross-coupling controller improves the contour error. The quadrant glitches are still present due to stiction. However, the friction compensation does not have
Contour error (mm)
1. Set the motor at rest. 0.4
0.2
0
−0.2
−0.4 0
50
100
150 200 250 Angular position (deg)
300
350
400
Figure 13: Experimental results for the contour error comparison of PID and cross-coupling controllers with and without friction compensation included, compare with Figure 9a. Although the experiment shows that the cross-coupling controller has a better performance than the PID controller, the friction compensation control module does not have the same impact that it did in simulations. as great of an effect as it did in the simulation. The quadrant glitches in the PID controller are reduced somewhat, but the performance of the cross-coupling control with friction compensation is worse than without. The same trend, noted in Figure 9a, whereby the contour error of the cross-coupling controller is diminished in between the quadrant glitches, is apparent, but the relative magnitudes are much different. It is likely that the simple friction model which was used in the simulations is not a good model of the disturbances present in the actual physical system. The IAE evaluation presented in Table 3 confirms that the friction compensation module combined with the crosscoupling control module causes a decreased performance over the cross-coupling module alone.
CONCLUSIONS The problem that was considered in this paper is how the combination of different types of auxiliary control modules affects the overall performance of the machining system. It is known that cross-coupling control algorithms can reduce the contour error of a two-axis system when complex contours are
TABLE 3: The performance comparisons of the experimental implementations of the PID controller, cross-coupling controller, PID controller with friction compensation, and crosscoupling controller with friction compensation. In contrast to the simulation results, the experimental performance of the cross-coupling controller with friction compensation is worse than without. The simple friction model used in the simulations may not be an accurate prediction of the actual disturbance. Controller Type IAE PID 0.1912 CCC 0.0525 PID w/FC 0.1892 CCC w/FC 0.0568 a. Contour errors.
Performance Factor IAE Pcc 0.2745 Pf c 0.9895 Pcc,f c 0.2971 Pcc · Pf c 0.2716 b. Performance factors.
desired, and friction compensation can also be used to reduce positioning errors in machining systems. In this paper, we addressed the question of how the overall performance of the system is affected when multiple types of control modules, with different objectives, are applied to a machining system simultaneously. We used cross-coupling control and friction compensation as two examples of control modules which might be desirable for a highprecision machining system. We compared the performance of the machining system (defined here as the integrated average contour error for a circular reference) with four different combinations of these control modules — decoupled servo-only control strategy, added friction compensation, cross-coupling control, and finally, both friction compensation and cross-coupling control. The two-axis machine tool was modeled as a coupled system of two second-order type I plants. A mathematical model of the mechanical system, including a modified Coulomb friction model, was built in Simulink and used for designing and testing the control algorithms. A baseline PID controller was designed for servo control on each axis, and cross-coupling and friction compensation control modules were also designed. For a circular contour as the reference, with different feedrates and gains for the various control blocks, the simulations presented in Section indicated that the performance improvement when both types of compensation are used is multiplicative. The performance factor was the integrated average contour error divided by the baseline performance of PID control only. Thus, the PID control showed a performance index of 1.0, the cross-coupling gave an index of Pcc < 1, the friction compensation gave an index of Pf c < 1. The index when both were used was approximately equal to the product of the two. Pcc,f c ≈ Pf c · Pcc The simulation experiments were repeated on an actual machine tool. Although the experimental results showed similar trends, the simple friction model used in simulation appears to be only a poor approximation of the actual case. This preliminary research raises some significant further
questions for machine tool and control research in general. Will adding other types of control modules to the system (such as force control) continue to improve the performance, or are some types of control modules inherently incompatible? How can the best combination of control modules be chosen for a particular application? New advances in open-architecture control systems will enable many different control algorithms to be implemented on a system (Park et al., 1995); this paper represents a first step towards deciding how best to take advantage of the freedom afforded by these new implementations.
REFERENCES Canudas de Wit, C., Astrom, K. J., , and Braun, K., 1986, “Adaptive Friction Compensation in DC Motor Drives,” in: Proceedings of the IEEE International Conference on Robotics and Automation (ICRA), San Francisco. Koren, Y., 1980, “Cross-coupled biaxial computer control for manufacturing systems,” ASME Journal of Dynamic Systems, Measurement, and Control, Vol. 102, No. 4, pp. 265–272. Koren, Y., 1983, Computer Control of Manufacturing Systems, Mc-Graw Hill. Koren, Y. and Lo, C. C., 1991, “Variable-gian Cross-Coupling Controller for Contouring,” Annals of the CIRP, Vol. 40, No. 1, pp. 371–374. Koren, Y. and Lo, C. C., 1992, “Advanced Controllers for Feed Drives,” Annals of the CIRP, Vol. 41, No. 2, pp. 689–698. Koren, Y., Pasek, Z. J., Ulsoy, A. G., and Benechetrit, U., 1996, “Real-Time Open Control Architectures and System Performance,” Annals of the CIRP, Vol. 45, No. 1, pp. 377–380. Kubo, T., Anwar, G., and Tomizuka, M., 1986, “Application of Nonlinear Friction Compensation to Robot Arm Control,” in: Proceedings of the IEEE International Conference on Robotics and Automation (ICRA), San Francisco. Park, J., Birla, S., Shin, K. G., Pasek, Z. J., Ulsoy, A. G., Shan, Y., and Koren, Y., 1995, “An Open Architecture Testbed for Real-Time Monitoring and Control of Machining Processes,” in: Proceedings of the American Control Conference, pp. 200– 204. Srinivasan, K. and Kulkarni, P. K., 1990, “Cross-coupled control of biaxial feed drive mechanisms,” ASME Journal of Dynamic Systems, Measurement, and Control, Vol. 112, pp. 225– 232. Suzuki, A. and Tomizuka, M., 1991, “Design and Implementation of Digital Servo Controller for High Speed Machine Tools,” in: Proceedings of the American Control Conference, Vol. 2, pp. 1246–1251. Tomizuka, M., Jabbari, A., Horowitz, R., Auslander, D. M., and Denome, M., 1985, “Modeling and Identification of Mechanical System with Nonlinearities,” in: Proceedings of the Seventh IFAC/IFORS Symposium on Identification and System Parameter Estimation, York, England, pp. 845–850. Tomizuka, M., Tung, E. D., and Anwar, G., 1993, “Low Velocity Friction Compensation and Feedforward Solution Based on Repetitive Control,” ASME Journal of Dynamic Systems, Measurement, and Control, Vol. 115, pp. 279–284.