MPVisualizer: a General Tool to Debug Message Passing Parallel Applications Ana Paula Cláudio1, João Duarte Cunha2, and Maria Beatriz Carmo1 1
Faculdade de Ciências da Universidade de Lisboa Departamento de Informática- Campo Grande - Edifício C5 - Piso 1 - 1700 LISBOA Portugal {apc, bc}@di.fc.ul.pt 2 Laboratório Nacional de Engenharia Civil Av. do Brasil, nº 101, 1799LISBOA CODEX - Portugal
[email protected]
Abstract. The paper describes MPVisualizer (Message Passing Visualizer) a general purpose tool for the debugging of message passing parallel applications; its three components are the trace/replay mechanism, the graphical user interface and the central component, called visualization engine. The engine, which plays the main role during the replay phase, can be used with different message passing environments and different graphical environments. This is a major step to make MPVisualizer a general tool. Additionally, the engine is able to recognize potential race conditions and can be easily re-programmed to detect specific predicates.
1 Introduction Performance improvement is the main goal being pursued when a parallel program replaces a sequential one. Before determining if performance improvement was really achieved, the parallel program has to be tested and debugged. However, debugging parallel applications is considerably more difficult than debugging sequential programs because the target is a set of communicating processes. It is usual to classify communication events as external events in contrast with internal events which involve one process only. Therefore, while debugging this kind of applications, two sorts of bugs may be found: bugs related to internal events and bugs related to external events. The proposed tool, MPVisualizer -Message Passing Visualizer- uses a graphical interface to help programmers in finding and understanding the second sort of bugs. That is, graphically observable events are communication or external events. However, bugs concerning internal events can be detected if a sequential debugger is integrated with our tool. This integration is perfectly compatible with MPVisualizer but is not implemented in the current version.
The tool includes a trace/replay mechanism and a graphical interface. Between these two components, a central component, the visualization engine, makes the tool easily adaptable to different message passing mechanisms and different graphical environments [3]. Besides, the engine detects and notifies the occurrence of race conditions, is capable of detecting predicates and permits observation both during reexecution and post-mortem.
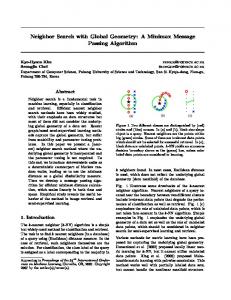
2 MPVisualizer The internal work of a parallel application may be non deterministic, that is, two successive executions of the application with the same input may exhibit different behaviours, even though they may produce the same final output. A trace/replay mechanism makes a particular execution of the parallel application repeatable, allowing cyclic debugging, a frequently used technique in sequential programs. The replay mechanism adopted is similar to the one described in [9]. The mechanism includes two distinct phases: the trace phase and the replay phase. Although minimal, the stored information during trace phase is enough to ensure that, during the replay phase, each process will consume exactly the same messages, in the same order. It should be emphasized that it is not necessary to modify the code of a parallel application to use our debugging tool, since the monitoring code is inserted in the standard libraries of the message passing software. During the replay phase, the visualization engine builds an object-oriented model of the application. This model provides the necessary semantic feedback to answer the questions about observable events that the user may ask (using the graphical interface). In MPVisualizer, observable events are not only communication events but also the beginning and ending of a process. Each time an observable event occurs in a process, during replay, a block of information containing the necessary data is sent to a process named spy. During replay phase, there is one spy process running in each machine that is executing processes. Each of these spies receives data blocks from its local processes and sends them to the main process1. The main process is a sort of one-way bridge between spy processes and the object oriented model of the application. The classes in the object oriented model, figure 1, can be categorized in two groups. The first group, the kernel, includes the basic classes that do not depend on the graphical environment and they encapsulate the data and behaviour that are generic for any message-passing application. The second group of classes, comprises the classes that deal with the graphical representation and that derive from the former classes.
1
In the present implementation communication channels between spies and the main process are sockets.
Spy
Machine 1..*
GIMachine
1..1
1..*
1..1 Manager
Process 1..1
1..* 1..*
1..1
1..*
GIprocess_intermediate Message
GIManager
1..*
GIprocess GImessage_intermediate
GIEntity
GImessage
Fig. 1 Class Diagram
Predicate detection is implemented using inheritance. The kind of predicates that can be detected depends on the granularity of the observation performed by the tool. Since in MPVisualizer detectable predicates are those that concern communication events, as well as beginning and ending of processes, the classes implementing the predicate detection algorithms are derived from one of two kernel classes: “process” or “message”. MPVisualizer automatically signals all potential race conditions. These conditions are responsible for the non determinism in the internal behaviour of parallel applications. Therefore, if race conditions are detected, the programmer is notified of all the points in the application that can be potentially responsible for variations in the behaviour of successive executions. This is a major step in debugging. The detection code for race conditions is encapsulated in only one kernel class named “process”. For the graphical interface, time space diagrams [8] have been adopted. In addition to the graphical representation of the execution, the user can obtain more detailed information about the displayed entities: processes, messages and communication events. This information is contained in pop-up windows that open when the corresponding entity symbol is selected in the graphical interface. It should be emphasized that dependencies from the message-passing software are strictly restricted to spy processes while dependencies from the graphical software are restricted to graphical classes of the model.
4 Present and Future Work The trace/replay mechanism was implemented and tested on top of PVM [5]. The visualization engine and the graphical interface were implemented and tested using
C++ and Motif. So far, MPVisualizer works only in post-mortem mode. It will be developed in order to support also observation during re-execution. To be used in this mode, a breakpointing mechanism should be available. The current graphical interface is not adequate to large volumes of information. There are planes to improve its scalability, namely using zoom in context techniques, e. g. as proposed in [2]. PVM has gained wide acceptance and Geist et al. consider it a de facto standard [6]. This, however, does not invalidate our interest in testing MPVisualizer with other message passing systems, such as MPI[4], P4[1] and Parmacs[7]. Description of similar tools and comparison with the one described here would be interesting but is outside the scope of this paper and has been made elsewhere[3].
References 1. Butler, R., Lusk, E.: User’s Guide to the p4 programming system. Tech. Rep. ANL-92/17. Argonne National Laboratory, Mathematics and Computer Science Division (1992) 2. Carmo, M., Cunha, J., Cláudio, A.: Visualization of Geometrical and Non-geometrical Data. In: Proceedings of the WSCG’99, Plzen (1999) 3. Cláudio, A., Cunha, J., Carmo, M.: Debugging of Message Passing Parallel Applications: a General Tool. In: Proceedings of VECPAR ’98 - 3rd International Meeting on Vector Parallel Processing, Porto (1998) 4. Dongarra, J., Otto, S., Snir, M., Walker, D.: An Introduction to the MPI Standard. Tech. Rep. CS-95-274. University of Tenesse (1995) 5. Geist, A., Beguelin, A., Dongarra, J., Jiang, W., Manchek, R., Sunderam, V.: PVM: Parallel Virtual Machine. MIT Press (1994) 6. Geist, A., Kohl, J., Papodopoulos, P.: PVM and MPI: a comparison of features. In: Calculateurs Paralleles, Volume 8(2) (1996) 7. Hempel, R., Hoppe, H.-C., Supalov, A.: PARMACS-6.0 library interface specification. Tech. Rep., GMD, PostFach 1316, D-5205 Sankt Augustin 1, Germany (1992) 8. Lamport, L.: Time, Clocks, and the Ordering of Events in a Distributed System. In: Communications of the ACM, Vol. 21( 7) (1978) 558-565 9. Leblanc, T., Mellor-Crummey, J.: Debugging Parallel Programs with Instant Replay. In: IEEE Transactions on Computers, Vol C-36(4) (1987)