Article
Multi-Agent System-Based Microgrid Operation Strategy for Demand Response Hee-Jun Cha 1 , Dong-Jun Won 1, *, Sang-Hyuk Kim 2 , Il-Yop Chung 2 and Byung-Moon Han 3 Received: 14 September 2015; Accepted: 14 December 2015; Published: 18 December 2015 Academic Editor: Neville R. Watson 1 2 3
*
Department of Electrical Engineering, Inha University, 100, Inha-ro, Nam-gu, Incheon 402-751, Korea;
[email protected] School of Electrical Engineering, Kookmin University, Jeongneung-ro, Seongbuk-gu, Seoul 136-702, Korea;
[email protected] (S.-H.K.);
[email protected] (I.-Y.C.) Department of Electrical Engineering, Myongji University, 116, Myongji-ro, Cheoin-gu, Yongin-si, Gyeonggi-do 449-728, Korea;
[email protected] Correspondence:
[email protected]; Tel.: +82-32-860-7404; Fax: +82-32-863-5822
Abstract: The microgrid and demand response (DR) are important technologies for future power grids. Among the variety of microgrid operations, the multi-agent system (MAS) has attracted considerable attention. In a microgrid with MAS, the agents installed on the microgrid components operate optimally by communicating with each other. This paper proposes an operation algorithm for the individual agents of a test microgrid that consists of a battery energy storage system (BESS) and an intelligent load. A microgrid central controller to manage the microgrid can exchange information with each agent. The BESS agent performs scheduling for maximum benefit in response to the electricity price and BESS state of charge (SOC) through a fuzzy system. The intelligent load agent assumes that the industrial load performs scheduling for maximum benefit by calculating the hourly production cost. The agent operation algorithm includes a scheduling algorithm using day-ahead pricing in the DR program and a real-time operation algorithm for emergency situations using emergency demand response (EDR). The proposed algorithm and operation strategy were implemented both by a hardware-in-the-loop simulation test using OPAL-RT and an actual hardware test by connecting a new distribution simulator. Keywords: microgrid; demand response; multi-agent system; battery energy storage system; intelligent load; fuzzy system; hardware-in-the-loop simulation
1. Introduction A microgrid is a small power system that includes distributed generation (DG), an energy storage system, and a controllable load [1,2]. In general, a microgrid operates optimally with the microgrid central controller (MGCC), which can control DG and the controllable load in addition to monitoring the microgrid system [3]. Typically, the microgrid can be operated in islanded mode or grid-connected mode [4]. In the islanded mode, the MGCC has to ensure power balance and control of voltage and frequency in the microgrid, but in the grid-connected mode, the MGCC can operate more economically because the utility grid is responsible for solving problems such as voltage control and frequency oscillation in the microgrid. Intelligent agents can determine their performance autonomously by recognizing the surrounding environment and communicating with other agents. On the basis of these features, the microgrid can be operated using a number of agents. Recently, a microgrid operation technique through multi-agent system (MAS) has been studied [5,6]. Similar to the central control method of a traditional power system, a top-level agent or energy management system ensures the optimal Energies 2015, 8, 14272–14286; doi:10.3390/en81212430
www.mdpi.com/journal/energies
Energies 2015, 8, 14272–14286
operation of a microgrid through hierarchical information exchange between agents with specific purposes [6]. Each agent has its own operation algorithm. Therefore, this is a distributed control method involving cooperation or competition between agents for optimal operation [7]. In recent power systems, demand response (DR) is also important. DR technology can solve problems such as peak reduction, expansion of facilities, and transmission congestion. The DR changes the electricity price, and therefore consumers can adjust their load to reduce the price. The DR program can be classified as a price-based DR program and an incentive-based DR program. Price-based DR has time-of-use, day-ahead pricing (DAP), critical peak pricing, and real-time pricing (RTP). Incentive-based DR has emergency demand response (EDR), direct load control, and capacity market program (CMP) [8]. In the centralized control method of the microgrid, the MGCC aggregates all the information for optimal operation using a genetic algorithm (GA) [9], particle swarm optimization, and dynamic programming (DP) [10]. In this method, the DG and the battery energy storage system (BESS) output are determined in accordance with the MGCC optimization results. This optimization method is suitable for the best operation, but the calculation time is long, and all data are required at the MGCC. However, in the distributed control method, the MGCC sends the electricity price and state of the grid to agents for distribution control. Its role is minimal and confined to sending signals pertaining to the stability of the microgrid. In the other method of microgrid control, the system includes an agent platform for the agent’s trade [7]. This study examined the operation strategy of a microgrid that consists of a BESS and an intelligent load using MAS. The MGCC can monitor the output through each agent and send data for each distributed independent operation. This study examined the economic operation algorithm using a fuzzy system for the BESS that receives the minimum information from the MGCC. The operation algorithm of an intelligent load agent, with the load assumed to be an industrial load, was also studied for maximum benefit by calculating the hourly production cost [11]. The two agents schedule using DAP and perform a real-time operation when EDR occurs. As the microgrid is connected to the grid, the microgrid maintains stability at the point of common coupling (PCC). Therefore, the MGCC in this study ensures individual agent operation. However, if the microgrid becomes unstable, the MGCC intervenes in the agent’s operation to restore microgrid stability. This paper is organized as follows: Section 2 examines each agent operation algorithm and the MGCC operation algorithm. In Section 3, the proposed algorithm is analyzed with different simulation scenarios through hardware-in-the-loop system (HILS) test by constructing the agents and the MGCC. Section 4 describes the hardware test performed with a new distribution simulator for comparison with the HILS test results in Section 3. Finally, Section 5 presents the conclusions of the study. 2. Operation Algorithms of Individual Agents In this study, a test microgrid is constructed with a BESS, an intelligent load, and an MGCC that can communicate with two agents as shown in Figure 1. Each agent executes operation algorithms independently without affecting each other. Because the test microgrid is assumed to be for a commercial purpose, the owner of all components may be different. Thus, for independence and stability of the system, the MGCC receives data from the grid-side energy management system (EMS) and sends data and signals to two agents, each of which has two operation algorithms: a day-ahead scheduling algorithm and a real-time algorithm in accordance with the EDR signal. The price data for scheduling is used in the DAP, which is one of the DR programs. On any day, the DAP program notifies the price of 24 h electricity for the next day. Similarly, EDR is included in the DR program. The BESS agent has the objective of maximizing the economic benefit from the energy arbitrage [12]. In addition, because it maintains a certain state-of-charge (SOC) range, the agent can contribute to power system stability by discharging when an emergency situation occurs. The intelligent load agent that assumes an industrial load performs production scheduling through
14273
Energies 2015, 8, 14272–14286
DAP to minimize the electricity price. The agent can compare the sales benefit and incentive Energies 2015, 8, page–page for participation in EDR and determine whether to participate in EDR. The detailed algorithm is Energiesas 2015, 8, page–page described follows. Grid side EMS
MGCC
Grid side EMS
MGCC
PCC
PCC
Communication Communication Line Line with Grid with Grid Communication Communication Line in Line in microgrid microgrid Load Load Agent Agent
LoadLoad
BESS BESS Agent
Electrical Line Line Electrical
Agent
BESS
BESS
Figure1.1.Configuration Configuration of inin this paper. Figure ofmicrogrid microgrid this paper. Figure 1. Configuration of microgrid in this paper.
2.1. Algorithm for BESS Agent
2.1. Algorithm for for BESS BESS Agent Agent 2.1. Algorithm
The BESS is used for frequency regulation, system reserve, demand-side management capacity, The BESS is is used usedof for frequency regulation, system reserve, demand-side management capacity, Theaugmentation BESS for frequency regulation, system demand-side management and renewable energy resources [13]. Inreserve, this study, the scheduling algorithm ofcapacity, the and augmentation of renewable energy resources [13]. In this study, the scheduling algorithm of and augmentation renewable resources In this the scheduling algorithm BESS is designedofusing a fuzzy energy expert system that [13]. can obtain anstudy, appropriate margin during the dayof the the BESS is designed using a fuzzy expert system that can obtain an appropriate margin during the a real-time operation algorithm is responsible for obtain handling situations. The fuzzy BESSand is designed using a fuzzy expert system that can an emergency appropriate margin during the day day and a real-time operation algorithm is responsible for handling emergency situations. The fuzzy expert system utilizes fuzzy logic to represent ambiguous scenarios instead of Boolean logic [14]. and a real-time operation algorithm is responsible for handling emergency situations. The fuzzy
expert expert system system utilizes utilizes fuzzy fuzzy logic logic to to represent represent ambiguous ambiguous scenarios scenarios instead instead of of Boolean Boolean logic logic [14]. [14].
(a)
(a)
(b) Figure 2. Cont.
(b) Figure 2. 2. Cont. Figure Cont.
3
14274
Energies 2015, 8, 14272–14286
Energies 2015, 8, page–page
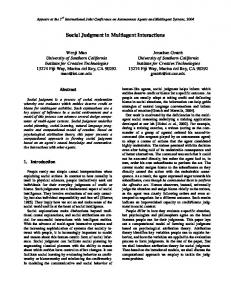
(c) Figure 2. Fuzzy membership function (a) state charge (SOC),(SOC), (b) electricity price, (c) decision of charge. Figure 2. Fuzzy membership function (a) of state of charge (b) electricity price, (c) decision of charge.
In this study, the scheduling algorithm was designed to determine if it is charging or discharging using the fuzzy system as the input membership functions of the BESS SOC and hourly In this study, the scheduling algorithm was designed to determine if it is charging or discharging DAP. Figure 2 shows a membership function of the fuzzy system applied in this study. In the using the fuzzy system as the input membership functions of the BESS SOC and hourly DAP. step-by-step descriptions, the BESS’s SOC and the electricity price are determined by a preset fuzzy Figure 2 shows a membership function of the fuzzy system applied in this study. In the step-by-step input membership function. The output membership function is determined by the SOC and the descriptions, the BESS’s SOC and the electricity price are determined by a preset fuzzy input electricity price membership function through the fuzzy rule. Table 1 represents the fuzzy rule in membership function. The output membership function is determined by the SOC and the electricity this algorithm. All cases were evaluated and combined. Finally, the charge/discharge value was price membership function through the fuzzy rule. Table 1 represents the fuzzy rule in this determined by the scalar value whose aggregated output membership function is defuzzification by algorithm. All cases were evaluated and combined. Finally, the charge/discharge value was the centroid method. determined by the scalar value whose aggregated output membership function is defuzzification Table 1. Fuzzy rule. by the centroid method. SOC/Price Low SOC/Price Low-Mid Low Mid Low-Mid High Mid High
Table 1. Fuzzy rule.Avg-High Cheap Avg-Low Expensive Must Charge Charge Can Charge Ready Cheap Avg-Low Avg-High Can Discharge Expensive Charge Can Charge Ready Must Charge Charge Can Charge Discharge Ready Can Charge Ready Can Discharge Charge Can Charge Ready Can Discharge Ready Can Discharge Discharge Must Discharge Can Charge Ready
Ready Can Discharge
Can Discharge Discharge
Discharge Must Discharge
Figure 3 shows a flowchart of the BESS scheduling algorithm. The BESS has an agent that receives the electricity price from the MGCC. The agent determines the hourly BESS output using Figuresystem 3 shows flowchart theand BESS scheduling algorithm. The BESS has an agent that the fuzzy witha the hourly of SOC electricity price. In the scheduling algorithm, the BESS receives the electricity price MGCC. agent determinesSOC the is hourly BESS output using has a driving range of 30% tofrom 100%the of the SOC. The When the calculated greater or lower than the the fuzzy system with the hourly SOC and electricity price. In the scheduling algorithm, the operating range, the agent determines the maximum value within the SOC constraints.BESS The has a driving range 30%the to 100% the SOC. When the SOC is greater or lower defuzzification valueoffrom fuzzy of system determines the calculated BESS power output. Depending onthan this the operating range, to theperform agent determines the maximum within SOC constraints. output, it is possible BESS scheduling over a 24value h period by the repeatedly calculating The the defuzzification the fuzzy system determines BESS power output. Depending this SOC of the nextvalue time. from Figure 4 presents a flowchart of thethe real-time BESS operation algorithm.on When output, is possible to perform signal BESS scheduling over athe 24 BESS h period by repeatedly the agentit receives an emergency from the MGCC, discharges until ancalculating SOC of 20%the is SOC of the next time. Figure 4 presents a flowchart of the real-time BESS operation algorithm. When reached. After the EDR periods, the BESS performs rescheduling with the scheduling algorithm for the agent receives an emergency signal from the MGCC, the BESS discharges until an SOC of 20% is the remaining time. reached. After the EDR periods, the BESS performs rescheduling with the scheduling algorithm for the time. 2.2. remaining Algorithm for Intelligent Load Agent It should for be Intelligent noted thatLoad the intelligent load in this study is assumed to be an industrial load for 2.2. Algorithm Agent the manufacturing industry. An intelligent load consists of a controllable load that is controlled by It should be noted that the intelligent load in this study is assumed to be an industrial load the time, and a fixed load that is maintained at all times for the operation of a factory. In this paper, for the manufacturing industry. An intelligent load consists of a controllable load that is controlled an intelligent load scheduling algorithm for DR is proposed considering the labor costs and the by the time, and a fixed load that is maintained at all times for the operation of a factory. In this electricity price of the different time period from the authors’ previous study [11]. In general, when a paper, an intelligent load scheduling algorithm for DR is proposed considering the labor costs and product is produced, its costs can be classified as the raw material costs, labor cost, electricity price, and other costs (transmission expense and external effect, etc.). The raw material cost and other costs 14275 4
Energies 2015, 8, 14272–14286
the electricity price of the different time period from the authors’ previous study [11]. In general, when aEnergies product is produced, its costs can be classified as the raw material costs, labor cost, electricity 2015,8,8,page–page page–page Energies 2015, price, and other costs (transmission expense and external effect, etc.). The raw material cost and arefixed fixed costs.Therefore, Therefore, thelabor laborthe costlabor andelectricity electricity priceinineach each timein period areimportant important other are costs are costs. fixed costs. Therefore, cost and price electricity price each are time period are the cost and time period variables. Thus,Thus, thehourly hourly production costscalculated calculated byEquations Equations (1)and and(2) (2) are used inthe the variables. Thus, the production costs by (1) are used important variables. the hourly production costs calculated by Equations (1) and (2)inare used scheduling algorithm for the maximum benefit per day. scheduling algorithm for the maximum benefit per day. in the scheduling algorithm for the maximum benefit per day. Start Start (t=0) (t=0) Receivedata datafrom fromMGCC MGCC Receive
t =t =t +t +1 1
Discharge Discharge
Decision Decision
Charge Charge
Ready Ready
Calculate Calculate DischargingPower Power Discharging
Calculate Calculate ChargingPower Power Charging
PowerScheduling Scheduling Power timet t atattime
2424< N Number in ascending order > N
Maximum power demand at time t Maximum power demand at time t
Yes Yes
Calculation of the remaining Calculation production of at the timeremaining (N+1) production at time (N+1) Applied to scheduling Applied to scheduling No No
t > 24 t > 24 Yes Yes
Sending the results to hardware Sending the results to hardware End End
Figure 5. 5. Flow chart of of intelligent load scheduling algorithm. Figure Flow chart intelligent load scheduling algorithm. Figure 5. Flow chart of intelligent load scheduling algorithm. Start Start No No
EDR occurs? EDR occurs? Yes Yes
Calculate total benefit Calculate total benefit at EDR time at EDR time
Eq (3) is true? Eq (3) is true?
No No
Maintain the scheduling results Maintain the scheduling results
Yes Yes
Rescheduling Rescheduling Sending the results to hardware Sending the results to hardware End End
Figure 6. Flow chart of intelligent load real-time algorithm. Figure 6. 6. Flow chart ofof intelligent load real-time algorithm. Figure Flow chart intelligent load real-time algorithm.
2.3. Operation Algorithm for MGCC 2.3. Operation Algorithm for MGCC Figure 7 is the MGCC management algorithm considering the overall system stability. Figure 7 is the MGCC management algorithm 14278 considering the overall system stability. In general, the MGCC receives data (electricity price, emergency signal) from the upper EMS and In general, the MGCC receives data (electricity price, emergency signal) from the upper EMS and sends this data and signal to lower agents. Further, the MGCC can monitor the power and control by sends this data and signal to lower agents. Further, the MGCC can monitor the power and control by sending any signal to the agents. In the grid-connected microgrid, however, problems such as the sending any signal to the agents. In the grid-connected microgrid, however, problems such as the
Energies 2015, 8, 14272–14286
2.3. Operation Algorithm for MGCC Figure 7 is the MGCC management algorithm considering the overall system stability. In general, the MGCC receives data (electricity price, emergency signal) from the upper EMS and sends this data and signal to lower agents. Further, the MGCC can monitor the power and control by sending any signal to the agents. In the grid-connected microgrid, however, problems such as the capacity of a transformer, transmission/distribution cable, and capacity of the PCC can occur. Considering these Energiesthe 2015,MGCC 8, page–page problems, receives the expected charging power from the BESS agent, and if the total power in the microgrid exceeds the allowable value at the PCC, the MGCC sends a charging delay and if the total power in the microgrid exceeds the allowable value at the PCC, the MGCC sends a signalcharging to the delay BESS signal agent.to If MGCC does not send delay MGCC considers thenot, BESSthe agent. If not, the MGCC doesa not sendsignal. a delay The signal. The MGCC the power in the microgrid the PCC Therefore, this system can becan applied without considers the power in theand microgrid andcapacity. the PCC capacity. Therefore, this system be applied otherwithout systemother changes if another DG or load is added to the system and the communication system changes if another DG or load is added to the system and the communication has been has transmitted. been transmitted. Start (t=0) t=t+1
System Monitoring
No
EDR Occurs? Yes
Receive Agent's Decision at time t Yes
No
Excess Power at PCC ? Send delay signal to BESS agent Send charging signal to BESS agent Rescheduling after time t
No
24 < t Yes
End
Figure 7. Flow chart of microgrid central controller (MGCC) operation algorithm. Figure 7. Flow chart of microgrid central controller (MGCC) operation algorithm.
3. Simulation Results
3. Simulation Results
Figure 8 shows the construction of the HILS test system with the MGCC program and agents. In
Figure 8 shows the construction of the HILS test system with the and agents. this study, the MGCC program is used for monitoring and managing thisMGCC system, program and the agents of In this program is usedtofor monitoring and managing this system, and the agents thestudy, BESS the andMGCC load were constructed verify the performance of the proposed algorithm and the microgrid operation [15]. The describes each component of the system. Before and of thesimulate BESS and load were constructed to following verify the performance of the proposed algorithm connecting to the hardware, was used for the HILS tocomponent test the communication and simulate the microgrid operationOPAL-RT [15]. The following describes each of the system. Before operation between the MGCC and the agent. connecting to the hardware, OPAL-RT was used for the HILS to test the communication and operation between the MGCC and the agent. 3.1. MGCC Program
The MGCC program was constructed using Visual Basic 6.0 and communicates with each agent 3.1. MGCC Program using Zigbee. First, when each agent’s ID is sent to the MGCC and registered, it follows the
The MGCC program was constructed using Visual Basic 6.0 and communicates with each agent monitoring and control of the agent’s state. As shown in Figure 8, the MGCC program shows the usingstatus Zigbee. First,of when each agent’s IDand is sends sent to the MGCC registered, and mode the microgrid operation a scheduling andand emergency signalitto follows agents. the monitoring and control of the agent’s state. As shown in Figure 8, the MGCC program The scheduling and emergency signal sent by the MGCC contains information on the hourly shows price, the statusemergency and modepredictive of the microgrid time, and operation incentive. and sends a scheduling and emergency signal to agents. 14279
Energies 2015, 8, 14272–14286
The scheduling and emergency signal sent by the MGCC contains information on the hourly price, emergency predictive Energies 2015, 8, page–page time, and incentive.
Realtime Microgrid Simulation Model MGCC (PC + Zigbee)
OPAL-RT (Real-time Simulator)
Host PC Display (RT-Lab)
Agent (Freescale+Zigbee+CAN) 3 In – 1 Out CAN Gateway
Figure Figure 8. 8. Hardware-in-the-loop Hardware-in-the-loop (HILS) (HILS) test test configuration. configuration.
3.2. 3.2. Agents Agents In the agent agent consisted consisted of of aa FreeScale FreeScale board board (EVB9S12XDP512). (EVB9S12XDP512). The In this this study, study, the The agent agent performed performed each operation algorithm by receiving the signal containing a variety of information from each operation algorithm by receiving the signal containing a variety of information from the the MGCC. MGCC. The agent was connected by hardware using a CAN bus. Therefore, each agent could monitor The agent was connected by hardware using a CAN bus. Therefore, each agent could monitor and and control power output output of of the the hardware hardware connected connected to to the the agent. agent. control the the power 3.3. 3.3. Case Case Study Study Table shows scenarios scenarios for for the the verification verification of of each each agent’s agent’s algorithm. algorithm. The Table 33 shows The RTP RTP electricity electricity price price in this study was applied by referring to the Illinois state RTP program in the United States. in this study was applied by referring to the Illinois state RTP program in the United States. As As mentioned earlier, microgrid consisted of the BESS intelligent load. BESS in mentioned earlier, the the testtest microgrid consisted of the BESS andand the the intelligent load. TheThe BESS in all all scenarios was set to an initial SOC of 40%, a rate power of 1 kW, and a rate capacity of 3 kW/h. scenarios was set to an initial SOC of 40%, a rate power of 1 kW, and a rate capacity of 3 kW/h. With an intelligent assigned aa minimum With an intelligent load, load, it it was was assigned minimum maintenance maintenance load load of of 0.6 0.6 kW kW and and aa controllable controllable load of 1.8 kW. In all scenarios, the hourly maximum production volume was 11, and load of 1.8 kW. In all scenarios, the hourly maximum production volume was 11, and the the daily daily maximum production volume was 126. In practice, the load and the BESS rate power were maximum production volume was 126. In practice, the load and the BESS rate power were higher higher than than the the setting setting value. value. On On the the other other hand, hand, the the hardware hardware testing testing in in laboratory laboratory condition condition was was set set as as described earlier. described earlier. Number 1 Number 21 2
3 3
Common Condition (1) BESS, Load Common Condition (2) Fixed load (1) BESS, Load = 0.6 kW (3) Fixed BESS initial (2) load = 0.6 kW SOC =initial 40% (3) BESS SOC = 40% (4) Production (4) Production volume = 11/h, volume = 11/h, 26/day 26/day
Table 3. Scenario for the proposed algorithm. Table 3. Scenario for the proposed algorithm. Test Type Scheduling Test Type
Scheduling
Real-time Real-time
Scenario (1) DAP in summer Scenario (1) DAP in summer (1) (2)DAP EDRininsummer 13–15 h (1) in summer (3)DAP No delay signal from MGCC (2) EDR in 13–15 h (1) DAP in summer (3) No delay signal from MGCC (2)DAP EDRininsummer 13–15 h (1) (3) Adapt delay (2) EDR in 13–15 hsignal (Maximum powerdelay at PCC = 2.5(Maximum kW) (3) Adapt signal power at PCC = 2.5 kW)
Measure & Evaluation BESS, Load output moment Measure & Evaluation (1) BESS, Load output moment BESS, Load output moment (2) Response to the EDR signal (1) output moment (3)BESS, delayLoad or not (2) Response to the EDR signal (3) not output moment (1)delay BESS,orLoad (2) Response the EDR signal (1) BESS, Load to output moment (3)Response delay or to notthe EDR signal (2) (3) delay or not
3.3.1. Scenario 1: DAP of Summer Figure 9 shows the HILS test result in scenario 1. The RTP in summer is similar to the load curve, in which the load is higher in the afternoon than in the morning. Figure 8 shows the electricity price production cost, load active power, BESS active power, and BESS SOC from the top to the bottom. Each agent starting from ① makes the power output reference that is conducted by the operation algorithm in time order. The hourly production cost of the products can be derived from the electric price from the load agent. Therefore, it is possible to perform load scheduling line with 14280 Accordingly, the load can be confirmed by the the hourly cost of production for maximum benefit. lowest production cost to the maximum productivity. Since product cost is affected by the labor cost, the industrial load is operated during daytime with low labor cost. In the BESS, the agent charges at
Energies 2015, 8, 14272–14286
3.3.1. Scenario 1: DAP of Summer Figure 9 shows the HILS test result in scenario 1. The RTP in summer is similar to the load curve, in which the load is higher in the afternoon than in the morning. Figure 8 shows the electricity price production cost, load active power, BESS active power, and BESS SOC from the top to the bottom. Each agent starting from 1 makes the power output reference that is conducted by the operation algorithm in time order. The hourly production cost of the products can be derived from the electric price from the load agent. Therefore, it is possible to perform load scheduling line with the hourly cost of production for maximum benefit. Accordingly, the load can be confirmed by the lowest production Energies 2015, 8, page–page cost to the maximum productivity. Since product cost is affected by the labor cost, the industrial load dawn at a low electricity pricewith andlow initial SOCcost. and discharges at the 7 and 10 h charges at the comparatively is operated during daytime labor In the BESS, agent at dawn at ahigh low electricity price and and initial SOC. The anddischarges 10 h are not most time periodhigh of electricity SOC7and at 7the and 10 hexpensive at the comparatively electricityprice. price However, since7 the is one input variablestime of the fuzzy is enough high, the BESS and SOC. The andSOC 10 h that are not theof most expensive period ofsystem electricity price. However, since can discharge. is relatively at time but theis BESS discharge because the discharge. electricity the SOC that isThe one SOC of input variableslow of the fuzzy②system enough high, the BESS can price is inis the most expensive period. The discharge BESS charges again theprice SOC is isin too at 2 but The SOC relatively low at timetime the BESS because thebecause electricity thelow most time 18. Scenario 1 is the base scenario that is compared to the other scenarios. The base scenario can expensive time period. The BESS charges again because the SOC is too low at time 18. Scenario 1 is the be show the following. (1) Thetoload is affectedThe by labor cost as compared to the following. electricity base scenario that is compared the agent other scenarios. base scenario can be show price; The BESS agent performs charge/discharge a certain (1) The(2) load agent is affected by labor cost as compared tofor themaintaining electricity price; (2) TheSOC BESSrange; agent (3) As shown in Figure 9, for the maintaining two agents adocertain not interfere with(3)each other and the two agents performs charge/discharge SOC range; As shown in Figure 9, the two consumed power at 10 with h. each other and the two agents consumed power at 10 h. agents do not interfere
300
Electricity Price
①
②
50(KRW)/div
200
Production Cost 50(KRW)/div
600 500
Active Power of Load 500 (W)/div
2000 1000 0
Active Power of BESS 500(W)/div
500 0 -500
SOC of BESS
100
20(%)/div
0
1
5
10
Time
15
20
24
Figure 9. HILS test result of scenario 1. Figure 9. HILS test result of scenario 1.
3.3.2. Scenario 2: DAP of Summer with EDR Signal (No Delay Signal) 3.3.2. Scenario 2: DAP of Summer with EDR Signal (No Delay Signal) Figure 10 presents the HILS test result for DAP in summer with the EDR signal. This scenario is Figure 10 presents the HILS test result for DAP in summer with the EDR signal. This scenario is based on the scheduling result of the summer DA_RTP, and therefore it is the same as scenario 1 based on the scheduling result of the summer DA_RTP, and therefore it is the same as scenario 1 until until the EDR signal is generated at ② In this scenario, however, the EDR signal with the EDR the EDR signal is generated at 2 In this scenario, however, the EDR signal with the EDR occurred occurred time and participation incentive is entered as seen in Figure 11, and this signal is sent to time and participation incentive is entered as seen in Figure 11, and this signal is sent to each agent each agent by clicking on the EDR button in the MGCC program between ① and ② in Figure 10. by clicking on the EDR button in the MGCC program between 1 and 2 in Figure 10. When each When each agent receives the EDR signal, the agent executes a real-time algorithm for the EDR situation. The EDR time period is defined between two hours from the input time in the MGCC program. In this scenario, the time at 13 of EDR time (②) and 750 won/kWh for the incentive are 14281 entered. From Figure 10, the load reduces the power, and the BESS discharges at this EDR time period. If EDR has occurred, the BESS SOC is set to 20% lower than the usual day. The BESS is charged again at time 18 (③) at a low electricity price and SOC. The BESS does not charge at time 15
Energies 2015, 8, 14272–14286
agent receives the EDR signal, the agent executes a real-time algorithm for the EDR situation. The EDR time period is defined between two hours from the input time in the MGCC program. In this scenario, the time at 13 of EDR time ( 2 ) and 750 won/kWh for the incentive are entered. From Figure 10, the load reduces the power, and the BESS discharges at this EDR time period. If EDR has occurred, the BESS SOC is set to 20% lower than the usual day. The BESS is charged again at time 18 ( 3 ) at a low electricity price and SOC. The BESS does not charge at time 15 because EDR has finished as the electricity price is too high for charging. Finally, the BESS charges at times 21 and 24 because the electricity price is low. The load must reproduce for the reduced volume during the EDR period. Energies 2015,the 8, page–page Therefore, load is shifted with 19 to 21 h having a low cost after the EDR period. Energies 2015, 8, page–page 300 300
Electricity Price Electricity Price
① ①
② ②
③ ③
50(KRW)/div 50(KRW)/div
200 200
Production Cost Production Cost 600 600 500 500
50(KRW)/div 50(KRW)/div
Active Power of Load Active Power of Load
2000 2000
500 (W)/div 500 (W)/div
1000 1000
Active Power of BESS Active Power of BESS
0 0 500 500 0 0 -500 -500
SOC of BESS SOC of BESS
100 100
0 0
1 1
5 5
10 10
15 15 Time Time Figure 10. HILS scenario 2. Figure HILS test test result result of of Figure 10. 10. HILS test result of scenario scenario 2. 2.
500(W)/div 500(W)/div
20(%)/div 20(%)/div
20 20
24 24
Figure 11. Emergency demand response (EDR) data input display in the MGCC program. Figure data input input display display in in the the MGCC MGCC program. program. Figure 11. 11. Emergency Emergency demand demand response response (EDR) (EDR) data
3.3.3. Scenario 3: DAP of Summer with the EDR Signal (No Delay Signal) 3.3.3. Scenario 3: DAP of Summer with the EDR Signal (No Delay Signal) In this scenario, as shown in Figure 12, most of the settings are the same as in scenario 2 except 14282 In this scenario, as shown in Figure 12, most of the settings are the same as in scenario 2 except for the charging delay signal. The MGCC receives the BESS output after the EDR period. Therefore, for the charging delay signal. The MGCC receives the BESS output after the EDR period. Therefore, it is possible to generate a charging delay signal as determined by the microgrid stability. In a it is possible to generate a charging delay signal as determined by the microgrid stability. In a grid-connected microgrid, all agents can operate for their own economic advantages under any grid-connected microgrid, all agents can operate for their own economic advantages under any
Energies 2015, 8, 14272–14286
3.3.3. Scenario 3: DAP of Summer with the EDR Signal (No Delay Signal) In this scenario, as shown in Figure 12, most of the settings are the same as in scenario 2 except for the charging delay signal. The MGCC receives the BESS output after the EDR period. Therefore, it is possible to generate a charging delay signal as determined by the microgrid stability. In a grid-connected microgrid, all agents can operate for their own economic advantages under any situation. If the maximum allowable power is available for the transformer capacity, transmission, and distribution cable capacity at the PCC point, which is connected to the grid, the MGCC cannot allow the output of each agent from the standpoint of the global objective of the system. In this study, the maximum allowable power at the PCC is 2.5 kW. The load shifting time is the same as in scenario 2. Therefore, the BESS charging time is delayed at 21 h, which is in contrast to scenario 2 because the Energies 2015, 8, page–page load is reduced at 21 h. If the BESS charge at 21 h, the microgrid’s injection power does not exceed not exceed 2.5 point. kW at So PCC Sodoes the not MGCC does anot generate delay BESS agent. 2.5 kW at PCC thepoint. MGCC generate delay signal afor BESSsignal agent.for Since then, the Since then, thea standby BESS changes state 22 ish higher because the40% SOC is maintains higher than 40% and BESS changes state ata22standby h because the at SOC than and stable range, maintains stable range, BESS charges low23electricity prices from 23 h. and the BESS charges byand lowthe electricity prices by from h. Electricity Price
①
③
②
50(KRW)/div
200
Production Cost 50(KRW)/div
600 500
Active Power of Load 2000
500 (W)/div
1000 0
Active Power of BESS 500(W)/div
500 0 -500
SOC of BESS
100
20(%)/div
0
1
5
10
Time
15
20
24
Figure 12. HILS test result of scenario 3. Figure 12. HILS test result of scenario 3.
4. Experimental Results 4. Experimental Results This study simulated the intelligent distributed operation and control in the smartgrid This study simulated the intelligent distributed operation and control in the smartgrid environment that the new distribution simulator connects the BESS and the intelligent load. The new environment that the new distribution simulator connects the BESS and the intelligent load. The distribution simulator can monitor the state of microgrid and electricity quality from a remote PC new distribution simulator can monitor the state of microgrid and electricity quality from a remote connected to the Ethernet. The new distribution simulator can construct any power system network PC connected to the Ethernet. The new distribution simulator can construct any power system as setting in software installed in the PC and store real-time data from the installed power quality network as setting in software installed in the PC and store real-time data from the installed power meter. On the other hand, because there is no feature that can see the graphically data display stored quality meter. On the other hand, because there is no feature that can see the graphically data in the program, it can be compared graphically using the Excel program This study simulated display stored in the program, it can be compared graphically using the Excel program This study intelligent distributed operation and control in a smart grid environment in which the new simulated intelligent distributed operation and control in a smart grid environment in which the new distribution simulator connects the BESS and the intelligent load. The new distribution simulator distribution simulator connects the BESS and the intelligent load. The new distribution simulator can monitor the state of the microgrid and the electricity quality from a remote PC connected to the can monitor the state of the microgrid and the electricity quality from a remote PC connected to the Ethernet. The new distribution simulator can construct any power system network with suitable settings in software installed in the PC and store real-time data from the installed power quality meter. However, the program is unable to display stored data graphically. MS Excel can be used for 14283 a graphical comparison. Figure 13 shows a distribution simulator for hardware test. Figure 14 shows an intelligent load device and an energy storage device used in the hardware test. The two devices are connected to the
Energies 2015, 8, 14272–14286
Ethernet. The new distribution simulator can construct any power system network with suitable settings in software installed in the PC and store real-time data from the installed power quality meter. However, the program is unable to display stored data graphically. MS Excel can be used for a graphical comparison. Figure 13 shows a distribution simulator for hardware test. Figure 14 shows an intelligent load device and an energy storage device used in the hardware test. The two devices are connected to the new distribution simulator, and each device operates on the output from the connected agent. The inverter connected to the BESS and intelligent load has a rated capacity of 5 kW. The oscilloscope is installed at the point where the hardware is connected to the simulator for comparison with the PQM Energies 8, page–page data in2015, the software. Energies 2015, 8, page–page
Figure 13. New distribution simulator in the laboratory. Figure Figure 13. 13. New New distribution distribution simulator simulator in in the the laboratory. laboratory.
(a) (a)
(b) (b)
Figure 14. Hardware for experiments (a) 5 kW BESS; (b) 5 kW Load. Figure 14. 14. Hardware Hardware for for experiments experiments (a) (a) 55 kW kW BESS; BESS; (b) (b) 55 kW kW Load. Load. Figure
In this study, the hardware test was performed for scenario 1 and compared with the HILS test In this study, the hardware test was performed for scenario 1 and compared with the HILS test result. thestudy, hardware test, it was difficult to visualize electrical price and production InIn this the hardware test was performed forthe scenario 1 and compared with the costs, HILS and test result. In the hardware test, it was difficult to visualize the electrical price and production costs, and the BESS SOChardware was calculated in the agent to because of the difference between the actual result. In the test, it was difficult visualize the simulation electrical price and production costs, and the BESS SOC was calculated in the agent because of the simulation difference between the actual performance the BESS and theagent scaledbecause time interval simulation. the BESS SOCtime wasofcalculated in the of the for simulation difference between the actual performance time of the BESS and the scaled time interval for simulation. Figure 15 presents the HILS test result and the hardware test result performance time of the BESS and the scaled time interval for simulation.for scenario 1. The two test Figure 15 presents the HILS test result and the hardware test result for scenario 1. The two test results differ, the overall charging and and discharging and load patterns the same. However, Figure 15 but presents the HILS test result the hardware test result for are scenario 1. The two test results differ, but the overall charging and discharging and load patterns are the same. However, because of the difference between the scaled time interval and the actual time, a few milliseconds results differ, but the overall charging and discharging and load patterns are the same. However, because of the difference between the scaled time interval and the actual time, a few milliseconds delay occurred owing to data transmission and calculation of the If the system operates because of the difference between the scaled time interval and thealgorithm. actual time, a few milliseconds delay occurred owing to data transmission and calculation of the algorithm. If the system operates for oneoccurred day, thisowing problem can be solved by synchronization GPS systemIfand algorithms delay to data transmission and calculationusing of thea algorithm. the other system operates for one day, this problem can be solved by synchronization using a GPS system and other algorithms for one solving the time delay problem. day, this problem can be solved by synchronization using a GPS system and other algorithms for solving the time delay problem. for solving the time delay problem. 3.0kW 3.0kW 1.5kW 1.5kW 0 0 0.5kW 0.5kW 0
Active Activeof Power Power Load of Load
Active Activeof Power Power BESS of BESS
① ①
14284
Figure 15 presents the HILS test result and the hardware test result for scenario 1. The two test results differ, but the overall charging and discharging and load patterns are the same. However, because of the difference between the scaled time interval and the actual time, a few milliseconds delay occurred owing to data transmission and calculation of the algorithm. If the system operates for one2015, day,8,this problem can be solved by synchronization using a GPS system and other algorithms Energies 14272–14286 for solving the time delay problem. 3.0kW 1.5kW
0
0.5kW
Active Power of Load
①
Active Power of BESS
0 Time 1 Energies 2015, 8, page–page
Active Power of Load
5
10
20
24
(a) Figure 15. Cont.
2.4 2 1.6 1.2 0.8 0.4 0
unit : kW 0
50
100
150
200
250
300
350
400
450
250
300
350
400
450
13
1
Active Power of BESS
15
0.5
0 0
50
100
150
200
-0.5 -1
Time
1
5
10
15
20
unit : kW 24
(b) Figure 15. result compared to the HILS test test result of scenario 1 (a) Measurement at the Figure 15. Hardware Hardwaretest test result compared to the HILS result of scenario 1 (a) Measurement oscilloscope installed in front of each piece of hardware; (b) Data stored in a new distribution simulator. at the oscilloscope installed in front of each piece of hardware; (b) Data stored in a new distribution simulator.
5. Conclusions
5. Conclusions This study examined the microgrid operation method using MAS. The agent, through a micro control unit and microgrid components, is constructed for a hardware test, and an operation This study examined the microgrid operation method using MAS. The agent, through a micro algorithm is included for DR. The operation algorithm includes a scheduling algorithm and a control unit and microgrid components, is constructed for a hardware test, and an operation real-time operation algorithm for emergency situations. The load agent schedules with the objective algorithm is included for DR. The operation algorithm includes a scheduling algorithm and a of minimizing the production cost by considering hourly electricity prices and labor costs. The BESS real-time operation algorithm for emergency situations. The load agent schedules with the objective agent schedules by using a fuzzy algorithm. Because the BESS operation algorithm considers the of minimizing the production cost by considering hourly electricity prices and labor costs. The BESS hourly BESS SOC and the electricity price, the BESS maintains a constant SOC range to prepare for agent schedules by using a fuzzy algorithm. Because the BESS operation algorithm considers the emergency situations. hourly BESS SOC and the electricity price, the BESS maintains a constant SOC range to prepare for Each agent in the microgrid operates for its individual benefit. The MGCC in the study does not emergency situations. control the output of the agent even if EDR occurs. However, although these individual operation Each agent in the microgrid operates for its individual benefit. The MGCC in the study does not strategies ensure the maximum benefit of each agent, they can be a problem from the system control the output of the agent even if EDR occurs. However, although these individual operation stability perspective because the agents do not have access to system information. Although the strategies ensure the maximum benefit of each agent, they can be a problem from the system stability microgrid constructs distributed MAS, the MGCC’s role as a coordinator is required for monitoring perspective because the agents do not have access to system information. Although the microgrid and sending a grid’s signal and information to each agent. constructs distributed MAS, the MGCC’s role as a coordinator is required for monitoring and sending Consequently, we verified that the microgrid system that includes each agent applied the a grid’s signal and information to each agent. proposed algorithms for the load and the BESS with the DR program. Further, this study not only Consequently, we verified that the microgrid system that includes each agent applied the simulates but also implements in HILS be employing a new distribution simulator through wireless proposed algorithms for the load and the BESS with the DR program. Further, this study not communication. In a future study, agents corresponding to renewable sources such as a wind only simulates but also implements in HILS be employing a new distribution simulator through turbine will be included in this system. A more detailed scenario and operation strategy considering wireless communication. In a future study, agents corresponding to renewable sources such as a wind renewable energy sources will be developed. turbine will be included in this system. A more detailed scenario and operation strategy considering Acknowledgments: This work was by the INHA UNIVERSITY Research Grant. This research was renewable energy sources will besupported developed. supported by Basic Science Research Program through the National Research Foundation of Korea (NRF) funded by the Ministry of Education, Science and Technology (Grant no. NRF-2013R1A1A1012667). Author Contributions: Hee-Jun Cha carried out the main research tasks and wrote the full manuscript and 14285 proposed the original idea, analyzed and verified the results and the whole manuscript. Sang-Hyuk Kim and Il-Yop Chung provided technical support to verify the proposed algorithm in simulation software. Dong-Jun Won and Byung-Mun Han validated and double-checked the proposed algorithm, the results, and the whole manuscript.
Energies 2015, 8, 14272–14286
Acknowledgments: This work was supported by the INHA UNIVERSITY Research Grant. This research was supported by Basic Science Research Program through the National Research Foundation of Korea (NRF) funded by the Ministry of Education, Science and Technology (Grant no. NRF-2013R1A1A1012667). Author Contributions: Hee-Jun Cha carried out the main research tasks and wrote the full manuscript and proposed the original idea, analyzed and verified the results and the whole manuscript. Sang-Hyuk Kim and Il-Yop Chung provided technical support to verify the proposed algorithm in simulation software. Dong-Jun Won and Byung-Mun Han validated and double-checked the proposed algorithm, the results, and the whole manuscript. Conflicts of Interest: The authors declare no conflict of interest.
References 1. 2. 3.
4.
5. 6. 7. 8. 9.
10.
11.
12.
13. 14. 15.
Lasseter, B. Microgrids: Distributed power generation. In Proceedings of the IEEE Power Engineer Society Winter Meeting, Columbus, OH, USA, 28 January–1 February 2001; pp. 146–149. Lasseter, R.H. Microgrids. In Proceedings of the IEEE Power Engineer Society Winter Meeting, New York, NY, USA, 27–31 January 2002; pp. 305–308. Olivares, D.E.; Cañizares, C.A.; Kazerani, M.; Mehrizi-Sani, A.; Etemadi, A.H.; Iravani, R.; Hajimiragha, A.H.; Gomis-Bellmunt, O.; Saeedifard, M.; Palma-Behnke, T.; et al. Trends in Microgrid Control. Proc. IEEE Tans. Smart Grid 2014, 5, 1905–1919. [CrossRef] Logenthiran, T.; Srinivasan, D.; Khambadkone, A.M.; Aung, H.N. Multiagent System for Real-Time Operation of a Microgrid in Real-Time Digital Simulator. Proc. IEEE Tans. Smart Grid 2012, 2, 925–933. [CrossRef] Dimeas, A.L.; Hatziargyriou, N.D. Operation of a Multiagent System for Microgrid Control. Proc. IEEE Trans. Power Syst. 2005, 3, 1447–1455. [CrossRef] Dou, C.; Liu, B. Multi-Agent Based Hierarchical Hybrid Control for Smart Microgrid. Proc. IEEE Tans. Smart Grid 2013, 2, 771–778. [CrossRef] Colson, C.M.; Nehrir, M.H. Comprehensive Real-Time Microgrid Power Management and Control with Distributed Agents. Proc. IEEE Tans. Smart Grid 2013, 4, 617–627. [CrossRef] Braithwait, S.; Eakin, K. The Role of Demand Response in Electric Power Market Design; Laurits, R., Ed.; Christensen Associates, Inc.: Madison, WI, USA, 2002. Conti, S.; Nicolosi, R.; Rizzo, S.A. Optimal dispatching of distributed generators in an MV autonomous micro-grid to minimize operating costs and emissions. In Proceeding of the IEEE International Symposium in Industrial Electronics (ISIE), Bari, Italy, 4–7 July 2010; pp. 2542–2547. Colson, C.; Nehrir, M.; Poumousavi, S. Towards real-time microgrid power management using computational intelligence methods. In Proceeding of the IEEE Power and Energy General Meeting, Minneapolis, MN, USA, 1–8 July 2010. Hee-Jun, C.; Jin-Young, C.; Dong-Jun, W. Smart load management in demand response using microgrid EMS. In Proceedings of the 2014 IEEE International Energy Conference, Cavtat, Croatia, 13–16 May 2014; pp. 833–837. Suazo-Martinez, C.; Pereira-Bonvallet, E.; Palma-Behnke, R.; Zhang, X.-P. Impacts of Energy Storage on Short Term Operation Planning Under Centralized Spot Markets. Proc. IEEE Tans. Smart Grid 2014, 2, 1110–1118. [CrossRef] Vazquez, S.; Lukic, S.M.; Galvan, E.; Franquelo, L.G.; Carrasco, J.M. Energy Storage Systems for Transport and Grid Applications. Proc. IEEE Tans. Ind. Electron. 2010, 12, 3881–3895. [CrossRef] Negnevitsky, M. Artificial Intelligence, 2nd ed.; Hanbit Media: Seoul, Korea, 2011; pp. 128–171. Oh, S.-J.; Yoo, C.-H.; Chung, I.-Y.; Won, D.-J. Hardware-in-the-Loop Simulation of Distributed Intelligent Energy Management System for Microgrids. Energies 2013, 6, 3263–3283. [CrossRef] © 2015 by the authors; licensee MDPI, Basel, Switzerland. This article is an open access article distributed under the terms and conditions of the Creative Commons by Attribution (CC-BY) license (http://creativecommons.org/licenses/by/4.0/).
14286