International Journal of Hybrid Information Technology Vol.8, No.4 (2015), pp.67-80 http://dx.doi.org/10.14257/ijhit.2015.8.4.09
Multi-objective Optimization of CNC Turning Process Parameters for High Speed Steel (M2) Using Taguchi and ANOVA Method Krupal Pawar1 and R. D. Palhade2 M.E. Scholar, Shri Sant Gajanan Maharaj College of Engineering, Shegaon1 Faculty, Department of Mechanical Engineering2
[email protected],
[email protected] Abstract In present research work the effect of insert nose radius and machining parameters including cutting speed, feed rate and depth of cut on surface roughness(Ra) and material removal rate(MRR) in a turning of HSS(M2) are investigated using the Taguchi method and ANOVA. A three level, four parameter design of experiment,L9 orthogonal array using Minitab 14 software, the signal-to-noise (S/N) ratio is employed to study the performance characteristics in the turning of HSS(M2) by taking nose radius of Tin coated carbide inserts tool of 0.4,0.8 and 1.2 mm on CNC turning centre. The analysis of variance (ANOVA) is applied to study the percentage contribution of each machining parameters while CNCturning of HSS (M2) material. The all experimental trials are conducted in dry machining environment and at a constant spindle speed 2800 rpm.The results are verified by taking confirmation experiments. The present investigation indicates that feed rate and nose radius are the most significant factors in case of material removal rate and surface roughness for turning of HSS (M2) material. Keywords: CNC turning, Minitab14, MRR, Surface roughness, Taguchi method, HSS (M2), Tin coated carbide inserts tool
1. Introduction In present time the technology of CNC turning machine has been advanced significantly, in order to meet the advance requirements in various manufacturing fields, especially in the precision turning metal cutting industry. Among the several CNC industrial machining processes. It is widely used in a variety of products/components manufacturing in the industries. The material removal rate (MRR) and Surface roughness (Ra) are an important controlling factor of machining operation. MRR and Ra are measurement of productivity and quality of the machining component. In order to improve the machining characteristics, effort to minimize the value of Ra and maximize the value of MRR by selecting optimal machining process parameters like cutting speed, feed rate, depth of cut and insert nose radius are required to be study in details. Tian Syung Lan and Ming-Yung Wang [1]in their research, selected the L9(34) orthogonal array of a Taguchi experiment for four parameters as cutting depth, feed rate, speed and tool nose runoff with three levels in optimizing the finish turning parameters on an ECOCA-3807 CNC lathe. The surface roughness (Ra) and tool wear ratio (mm-2) are primarily observed as independent objectives for developing two combinations of optimum single-objective cutting parameters. Additionally, the levels of competitive orthogonal array are then proposed between the two parameter sets. Therefore, the optimum competitive multi-quality cutting parameters can then be achieved. They found that both tool wear ratio and MRR from their optimum competitive parameters are greatly advanced with a minor decrease in the surface roughness in comparison to those of benchmark parameters. In another work by W.H. Yang and Y.S. Tarng [2] employed the
ISSN: 1738-9968 IJHIT Copyright ⓒ 2015 SERSC
International Journal of Hybrid Information Technology Vol.8, No.4 (2015)
Taguchi method in order to investigate the cutting characteristics of S45C steel bars using tungsten carbide cutting tools. They used orthogonal array, the signal-to-noise (S/N) ratio and the analysis of variance (ANOVA) in their experimental investigation. They suggested that tool life and surface roughness can be improved significantly for turning operations. The improvement of tool life and surface roughness from the initial cutting parameters to the optimal cutting parameters is about 250 % is observed in their work.L.B.Abhang and M.Hameedullah [3] studied optimized machining parameters in EN-31 steel turning operation using tungsten carbide inserts and Taguchi method. They carried out optimal combination of process parameters based on S/N ratio and the significance of each parameter by performing ANOVA analysis. In this research work control parameters are used feed rate, depth of cut and lubricant temperature. They found that the better surface finish is obtained by applying cool lubricant. They further observed even with higher depth of cut surface finish is also improved if lubricant temperature is lowered. Ranganath M.S, Vipin and R.S.Mishra [4] investigated the parameters affecting the surface roughness produced during the turning process for the material aluminium 6061. In this work process parameters are considered cutting speed, feed rate and depth of cut. They employed Taguchi design for optimization of process parameters and characterized the main factors affecting surface roughness by ANOVA. They observed that the feed rate and cutting speed are the most influential process parameters on surface roughness in case of aluminium 6061 metal. S.V.Alagarsamy and N.Rajakumar [5] investigated the influence of turning process parameters on material removal rate and surface roughness of material AA7075 using Taguchi method and Response Surface Methodology. They used L27 orthogonal array and Minitab16 statistical software for to generate the array. They have considered three machining parameters as cutting speed, feed rate and depth of cut in their work. They found that feed is most influencing factor for surface roughness and depth of cut is most influencing factor for material removal rate. On the strength of the review work done by previous researchers, it is found that a considerable amount of work has been carried out in case of modeling, simulation and parametric optimization of surface properties of the product in turning operation for various materials. The issues related to tool life, tool wear and cutting forces are also addressed too. However no work is found in uses of different geometries for optimizing the surface properties and material removal rate for HSS (M2) material.The present study demonstrates detailed methodology of Taguchi optimization technique.The main objective of the present work is to find out machining parameters which will give maximum material removal rate along with minimum surface roughness while CNC turning of HSS (M2) work piece material.
2. Design of Experiment The Taguchi method is the oldest and accepted industrial method of optimization. It is a powerful tool for design high quality system. It follows systematic, simple and efficient approach to optimize designs for performance, quality and cost.Taguchi method is effective method for designing process that operates reliably and optimally over a variety of conditions. To determine the best design it requires the use of a designed experiment. Taguchi converts the objective function values to Signal-to-Noiseratio (S/Nratio) to measure the performance characteristics of the levels of control factors. In the present work experiment is designed using Taguchi technique [3], which uses an orthogonal matrix to study the entire parametric space with a limited number of experiments. The four machining parameters considered in this study are cutting speed, feed rate, depth of cut, and insert nose radius. All of them are set at three different levels as given in Table 1. Here A, B, C and D are cutting speed in (m/min), feed rate in (mm/rev), depth of cut in (mm) and nose radius in (mm) respectively. The selection of particular orthogonal matrix
68
Copyright ⓒ 2015 SERSC
International Journal of Hybrid Information Technology Vol.8, No.4 (2015)
from the standard orthogonal array depends on number of parameters equal to 4, number of levels equal to 3 and total degree of freedom (DOF) for4 parameters are equal to 4× (31) = 8.ThereforeMinimumnumberofexperimentequal tototalDOFforparameters+1 = 8 + 1= are 9.In this research work, the interactions between factors are not considered. L 9 (34) orthogonalarrayofTaguchiisselected, which are given in Table 2.The response variables chosen for the present investigation are material removal rate and surface roughness. The lower the better and the larger the better quality characteristics are employed for surface roughness and material removal rate, respectively are given in equation 1 and 2. Table 2.Taguchi’s L9 O.A Table 1. Control Factors and their Levels
Exp.No. A 1 150 Control factors 2 150 Levels 3 150 A B C D 4 250 L1 150 0.15 0.5 0.4 5 250 L2 250 0.25 0.75 0.8 6 250 7 350 L3 350 0.30 0.8 1.2 8 350 1. Condition of S/N ratio for surface roughness : Smaller is better 9 350 2
S / N 10 log ((Y ) / n))
B 0.15 0.25 0.30 0.15 0.25 0.30 0.15 0.25 0.30
C 0.5 0.75 0.8 0.75 0.8 0.5 0.8 0.5 0.75
D 0.4 0.8 1.2 1.2 0.4 0.8 0.8 1.2 0.4
(1)
2. Condition of S/N ratio for material removal rate : Larger is better
S / N 10 log ((1/ Y 2 ) / n)
(2)
th
Where, S/N-Signal to Noise Ratio, Yi- i observed value of the response, n- Number of observations in a trial, y- Average of observed responses values.After finalizing control factors and their levels, the design of orthogonal matrix is prepared using Minitab 14 statistical software as shown in Table 2.
3. Experimental Setup and Procedure 3.1 Specimen Material Details The specimen selected for experimental trial is taper shank twist drill. The material of cutting side and shank side of taper shank twist drill is HSS (M2) and EN9respectively. These two materials are welded together by friction welding process as shown in Figure1.The trials are conducted only on cutting diameter side of twist drill i.e. HSS (M2)material side. The raw material size of cutting side of taper shank twist drill is Ø 17×120mm. The chemical composition and mechanical properties of HSS (M2) specimen material is as C-0.86/0.96, Cr-3.8/4.5, Mo-4.9/5.5, W-6.0/6.75, V-1.7/2.2[9]and density is 8.10×10⁻³g/mm3[10], melting point-46800, hardness-62-65 HRC, compressive yield strength-3250 Mpa, Poisson’s ratio-0.27-0.30, elastic modulus-190-210 GPa, respectively. The applications of HSS (M2) material involves manufacturing of twist drills, reamers, taps and cold forming tool such as extrusion rams, dies, plastic molds with elevated wear resistance and screw.
Copyright ⓒ 2015 SERSC
69
International Journal of Hybrid Information Technology Vol.8, No.4 (2015)
Figure 1. Specimen Material
Figure 2.Tin Coated Carbide Insert Tool
3.2 Cutting Tool and Tool Holder In present work, the cutting tool employed for turning HSS (M2) specimen is triangularshape Tin coated carbide insert is shown in Figure2.The inserts used during experimentations are TNMG 160404, TNMG 160408 and TNMG160412 of manufactured by Taegutec company limited (India). The specifications of inserts are given as per ISO coding. The clearance angles of the inserts are zero. The Inscribed circle sizes and thickness of inserts are 9.5 mm and 5mm respectively. The tool holder used during experimentation is HCLNL 2525M0904.The properties of cutting tool material are high melting point, high thermal conductivityand lowcoefficient of thermal expansion. Thecarbide materialsareused in other applicationslike sports, jewelryand surgical instrument. 3.3 Experimental Unit and Procedure Turning experiments are conducted using an ACE Designer Ltd. CNC turning centre with Fanuc Oi-mate-TD as shown in Figure 3. The various operations can be performed on CNC lathes are threading, chamfering, facing etc. The CNC lathe has a maximumspindle speed of 3500 rpm and a power of 380 v/4.5v. This CNC lathe has 300 mm maximum turning diameter and 400 mm maximum turning length[8]. The all experimental trials are conducted in dry environment and at constant spindle speed that is 2800 rpm as per sequence of design of orthogonal matrix. The factors such as tool vibration and tool wear are not considered in the present investigations.The initial and final weight of specimen is measured and time recorded for complete turning process in each experimental trial.Then labeling is done in order to identify the experimental trial number. The each trial is conducted twice in order to record the accurate data.The material removal rate is calculated using following equation. MRR
Wi Wf
3
mm / sec
(4)
sCycle time Where,Wi= Initial weight of work piece in grams ,Wf = Final weight of work piece in grams ,t= Machining time in seconds, ρs= Density of HSS steel= 8.10x 10ˉ³ gm/mm³ .This process is carried out for all 9 specimens as per the design of matrix for experiment.
70
Copyright ⓒ 2015 SERSC
International Journal of Hybrid Information Technology Vol.8, No.4 (2015)
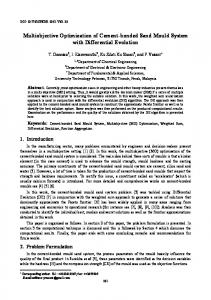
Figure 3. Experimental Setup After machining, the surface roughness of machined specimen is measured in the feed directionusing surface roughness tester, of make–Strumentazione, model RT10G of its Least Count is 0.001µm .The Table 4 shows the obtained MRR and measured Ra mean values. The surface roughness measurement setup used for present workand machined trial specimens are shown in Figures 4 and 5 respectively. Table 4. Experimental Results for MRR and Ra Expt.No.
A
1 2 3 4 5 6 7 8 9
150 150 150 250 250 250 350 350 350
B
C
D
0.15 0.5 0.4 0.25 0.75 0.8 0.30 0.8 1.2 0.15 0.75 1.2 0.25 0.8 0.4 0.30 0.5 0.8 0.15 0.8 0.8 0.25 0.5 1.2 0.30 0.75 0.4
Figure 4.Surface Roughness Testing
Mean MRR (mm3/sec) Mean Ra (µm) 210.901 321.020 370.900 227.690 315.520 371.375 231.060 315.015 345.590
2.40 2.75 2.43 0.80 3.45 3.54 1.43 1.35 3.91
Figure 5. Specimens for Testing
3.4 Mean Values Calculation Average performance of each factor on MRR is calculated by following expression.The average performance of factor A at level1= sum of MRR at level 1/ number of levels. Similar expression are written for calculating the average performance of factor B & C. Notations are used as: A’1, A’2, A’3= average performance of factor A at level 1, 2, 3 respectively.B’1, B’2, B’3= average performance of factor B at level 1,2, 3 respectively. C’1, C’2, C’3= average performance of factor C at level 1,2, 3 respectively.D’1, D’2, D’3 = average performance of factor D at level 1, 2, 3 respectively. M1,M2,M3,M4,M5,M6,M7,M8,M9 = MRR at corresponding levels.A’1 = (M1+M2 +M3) /3,
Copyright ⓒ 2015 SERSC
71
International Journal of Hybrid Information Technology Vol.8, No.4 (2015)
B’1= (M1+M4+M7)/3,C’1= (M1+M6+M8)/3, D’1= (M1+M5+M9)/3, A’2 = (M4+M5+M6) /3, B’2= (M2+M5+M8)/3, C’2= (M2+M4+M9)/3, D’2= (M2+M6+M7)/3, A’3 = (M7+M8+M9) /3, B’3= (M3+M6+M9)/3, C’3= (M3+M5+M7)/3, D’3= (M3+M4+M8)/3. These calculated values of MMR and similarly, mean values of Ra are noted in Table 5 and Table 6, respectively. Table 5. Mean Value Table for Ra Levels
A
Mean values of Ra B C
D
L1
2.527
1.543
2.430
3.253
L2
2.597
2.517
2.487
2.573
L3
2.230
3.293
2.437
1.527
Table 6. Mean Value Table for MRR
L1
Mean values of MRR A B C D 300.9 223.2 299.1 290.7
L2
304.9
317.2
298.1
307.8
L3
297.2
362.6
305.8
304.5
Levels
4. Optimum Predicted Response Value and ANOVA Calculation 4.1 Optimum Predicted Response Value Calculation The optimum predicted response value is calculated as follows: Let T’= average results for 9 runs of response value 9
T'
Responseoptimum
M i 1
9 T ? An1 ? T ? Bn 2 ? T ? Cn3 ? T ?
(5)
Dn4
? T ?
6
Where An1, Bn2, Cn3 and Dn4 are corresponding mean values of optimum points indicated in S/N graphs. 4.2 Mathematical ANOVA Analysis The purpose of the analysis of variance (ANOVA) is to investigate which design parameters significantly affect the quality characteristic. The method of manually ANOVA calculation is given below. In ANOVA calculations, the degree of freedoms for all factors needs to be obtained first: Total degree of freedom, fT = Number of trials -1, for factor A degree of freedom, fA= Numbers of levels – 1= kA-1, similarly FB, FC,FD can calculate.For Error fe= fT – (fA+ fB + fC + fD). Sum of squares for all factors is then calculated using equation (7), for factor A
sA
A 1
kA
2
A ....... 4
kA
2
( za1 za 2 .... zaN ) 2 N
(7)
Similarly for SB ,SC , SD are calculated. The total sum of square is calculated by using following equation (8) as
72
Copyright ⓒ 2015 SERSC
International Journal of Hybrid Information Technology Vol.8, No.4 (2015)
sT ( z
2 a1
za 2 ..... zaN 2
2
( z z ..... zaN ) ) a1 a 2 N
2
(8)
Now the total sum of error, Se = ST – (SA+ SB+SC+SD) The values of variances for all factors are then calculated. For factor A, VA= SA/fA Similarly VB, VC, VD are calculated. For variance error = Ve = Se/fe Then F-ratio, F for all factors is calculated afterwards. For factor A, FA= VA/Ve However FA, FB, FC and FD cannot be determine as Ve = 0. Last but not least, percentage contributions for all factors are calculated by For factor A, PA= SA/ST×100 Similarly PB, PC and PDare calculated [6].
(9) (10) (11) (12)
(13)
5. Analysis and Discussions The experiments are conducted to study the effect of process parameters over the output response features with the process parameters. The S/N ratio results for the surface roughness and material removal rate are given in Table 7. In the present study all the designs, plots and analysis have been carried out using Minitab 14 statistical software. The effect of different process parameters on MRR and surface roughness are calculated and plotted as the process parameters changes from one level to another. The average value of S/N ratios are calculated to find out the effects of different parameters and as well as their levels. The use of both ANOVA technique and S/N ratio approach makes it easy to analyze the results and hence, make it fast to reach on the conclusion. Table 7. S/N Ratios Results for MRR and Ra Expt. No. 1 2 3 4 5 6 7 8 9
A
B
C
D
150 150 150 250 250 250 350 350 350
0.15 0.25 0.30 0.15 0.25 0.30 0.15 0.25 0.30
0.5 0.75 0.8 0.75 0.8 0.5 0.8 0.5 0.75
0.4 0.8 1.2 1.2 0.4 0.8 0.8 1.2 0.4
Mean MRR (mm3/sec) 210.901 321.020 370.900 227.690 315.520 371.375 231.060 315.015 345.590
S/N Ratio (dB) 46.48 50.13 51.38 47.14 49.98 51.39 47.27 49.96 50.77
Mean Ra (µm) 2.40 2.75 2.43 0.80 3.45 3.54 1.43 1.35 3.91
S/N Ratio (dB) -7.60 -8.78 -7.71 1.93 -10.75 -10.98 -3.10 -2.60 -11.84
5.1 Analysis of Variance for Surface Roughness The ranks indicate the relative importance of each factor to the response. The ranks and the delta values for various parameters show that nose radius has the greatest effect on surface roughness and is followed by feed, depth of cut, cutting speed and coolant condition in that order. As surface roughness is the lower the better type quality characteristic, from Figure6 and Table 8, it can be seen that the third level of cutting speed (A3) = 350 m/min, first level of feed rate (B3) = 0.15 mm/rev, second level of depth of cut (C2) = 0.75mm and fourth level of nose radius (D4) = 1.2 mm results in minimum value of surface roughness. It is observed from Figure 6 that Ra is increased continuously with increased in cutting speed. The Ra is continuously decreased with increase in feed rate. The Ra is initially increased with increase in depth of cut and then
Copyright ⓒ 2015 SERSC
73
International Journal of Hybrid Information Technology Vol.8, No.4 (2015)
decreased and is increased continuously with increased in nose radius. Table 8 shows that the results of ANOVA analysis by adjusted method using Minitab 14 software for mean Ra values. Table 8. ANOVA for Ra Sources DOF Seq. SS Adj. SS A 1 0.4350 0.2450 B 1 7.5784 9.8803 C 1 0.0020 0.0502 D 1 9.0298 9.0298 Error 4 0.4850 0.4850 Total 8 17.5302 S = 0.3481, R-seq.= 97.23 %, R-seq.(Adj.) = 94.47%
Adj. MS 0.2450 9.8803 0.0502 9.0298 0.1212
F 2.02 81.4 0.41 74.4
Main Effects Plot (data means) for SN ratios A
-2
B
-4
Mean of SN ratios
-6 -8 -10 150
250
350
0.15
C
-2
0.25
0.30
D
-4 -6 -8 -10 0.50
0.75
0.80
0.4
0.8
1.2
Signal-to-noise: Smaller is better
Figure 6. Effects of Process Parameters on Ra In ANOVA analysis, after calculating percentage contribution for all control factors, it is found that as per the Table 9, cutting speed, feed rate, depth of cut and nose radius affect surface roughness 2.481 %, 43.23 %, 0.00114 % and 51.50 % respectively. This analysis shows that nose radius is most significant control factor for surface roughness. Table 9.Response of S/N Ratios for Surface Roughness Levels L1 L2 L3 Delta Rank
Cutting speed -8.034 -6.566 -5.852 2.182 3
Feed rate -2.924 -7.383 -10.179 7.254 2
Depth of cut -7.064 -6.231 -7.192 0.961 4
Nose radius -10.068 -7.624 -2.794 7.275 1
5.2 Analysis of Variance for MRR The ranks and the delta values show that feed rate have the greatest effect on material removal rate and is followed by in the order of nose radius, depth of cut and cutting speed.
74
Copyright ⓒ 2015 SERSC
International Journal of Hybrid Information Technology Vol.8, No.4 (2015)
As MRR is the higher the better type quality characteristic, it can be seen from Figure7 that the second level of cutting speed (A2) =250 m/min, third level of feed rate (B3) = 0.30 mm/rev, third level of depth of cut (C3) = 0.80 mm and second level of nose radius (D2) = 0.8mm provide maximum value of MRR. It can be observed from Figure 7 that MRR is initially increased with increase in cutting speed then decrease with further increase in cutting speed. The MRR is increased continuously with increase in feed rate.The MRR is increased with increase in depth of cut and is increased with increasein nose radius and then slightly decrease. Table 10 shows that the results of ANOVA analysis by adjusted method using Minitab 14 software for mean MRR values. Table 10. ANOVA for Mean MRR S D Seq. SS Adj. SS Adj. MS A 1 50951 13286 13286 B 1 8066405 8074897 8074897 C 1 482 2090 2090 D 1 79204 79204 79204 Error 4 109035 109035 27259 Total 8 8306041 S=165.102, R-seq.=98.69% , R-seq.(Adj.)=97.37 %
F 0.49 296.2 0.08 2.91
P 0.524 0.000 0.796 0.163
In ANOVA analysis, after calculating percentage contribution of all control factors, it is found that cutting speed, feed rate, depth of cut and nose radius affect material removal rate 0.61%, 97.11%, 0.0058%and 0.95%, respectively. This analysis shows that feed rate is most significant factor for material removal rate. The Table 11 shows that responses of S/N rations for MRR. From the rank values, conclusion can be drawn that feed rate is most influencing factor for MRR followed by nose radius. Main Effects Plot (data means) for SN ratios A
B
51 50 Mean of SN ratios
49 48 47 150
250 C
350
0.15
0.25 D
0.30
0.50
0.75
0.80
0.4
0.8
1.2
51 50 49 48 47
Signal-to-noise: Larger is better
Figure 7. Effects of Process Parameters on MRR Table 11. Response of S/N Ratios for MRR Levels L1 L2
Cutting speed
Copyright ⓒ 2015 SERSC
49.33
49.51
Feed rate 46.97 50.03
Depth of cut 49.28 49.35
Nose radius 49.08 49.60
75
International Journal of Hybrid Information Technology Vol.8, No.4 (2015)
L3 Delta Rank
49.34
51.18 4.22 1
0.18
4
49.55 0.27 3
49.50 0.52 2
5.3 Regression Analysis The correlation among the control factors and performance measures such as surface roughness and material removal rate are obtained using regression analysis technique. The obtained polynomial model is shown as following equations (14) and (15).
MRR 73.1 0.0276 A 930 B 6.8 C 16.8 D
R Sq.
(14)
98.7%
Ra 1.92 0.00137 A 12.2 B 0.368 C 2.14 D
R Sq.
(15)
97.2% .
Where, A-cutting speed, B-feed rate, C-depth of cut and D- nose radius.The above equation consists of only significant factors. The larger value of R- sq. is always desirable. This confirms the fitness of models and the accuracy of the calculated constants. 5.4 Utility Concept Table 12. L9OA with Multi-response S/N Ratios Expt. No. 1 2 3 4 5 6 7 8 9
A
B
C
D
obs
150 150 150 250 250 250 350 350 350
0.15 0.25 0.30 0.15 0.25 0.30 0.15 0.25 0.30
0.5 0.75 0.8 0.75 0.8 0.5 0.8 0.5 0.75
0.4 0.8 1.2 1.2 0.4 0.8 0.8 1.2 0.4
19.44 20.67 21.83 24.53 19.61 20.20 22.08 23.68 19.46
By applying the utility concept, the multi-response S/N ratio of the overall utility value is given by equation (16).
Obs W11 W11
(16)
Where W1 and W2 are the weights assigned to the Ra and MRR. Assignment of weights to the performance characteristics are based on customer’s requirements and their priorities.In the present work equal importance is considered for both Ra and MRR. Therefore W1 and W2 = 0.5.The multi-response S/N ratios of the overall utility value are calculated using equation 16 and are inserted in L9 orthogonal array is shown in Table 12. After calculating overall utility values using Minitab 14 software, the graphs are plotted for mean values table shown in Figure 8.
76
Copyright ⓒ 2015 SERSC
International Journal of Hybrid Information Technology Vol.8, No.4 (2015)
Table 13. Mean Values of obs Levels L1 L2 L3
Mean values of obs for process parameters A B C D 20.65 22.02 21.11 19.50 21.45 21.32 21.55 20.98 21.74 20.50 21.17 23.35
Main Effects Plot (data means) for Means Cutting Speed
Feed Rate
23 22
Mean of Means
21 20 19 150
250 Dept h of cut
350
0.15
0.25 Nose radius
0.30
0.50
0.75
0.80
0.4
0.8
1.2
23 22 21 20 19
Figure 8. Effect of Overall Utility Factor It is observed from the Figure 8 that the overall utility factor is increased with increased in cutting speed and is decreased with increased in feed rate. The overall utility factor is first increased with increase in depth of cut then decreased and increased continuously with increase in nose radius.It can be seen from Figure 8 that the third level of cutting speed (A3) = 350 m/min, first level of feed rate (B1) = 0.15 mm/rev, secondlevel of depth of cut (C2) = 0.75mm and third level of nose radius (D2) = 1.2 mm provide optimum value of overall utility value. The main effect plot for means of obs shows that nose radius is most significant control factor thataffecting the performance characteristics followed by feed rate.
6. Confirmation Test In order to validate the results obtained, there are three confirmation experiments conducted for each of the response characteristics (MRR, Ra) at optimal levels of the process variables and at initial levels of process variables. The average values of the optimum characteristics at initial levels,predicted value levels and experimental value levels are obtained. Thecomparative results are given in Table 14. The values of MRR and Surface roughness obtained through confirmation experiments are within the 95% of CICE of respective response characteristic. The following confirmation test Table 14 shows that improvements in response characteristics like MRR and Ra are 69.36%,71.06 % respectively due to using optimum levels process parameters therefore this set of parameters are beneficial to improve productivity as well as quality of CNC turning process for HSS(M2).
Copyright ⓒ 2015 SERSC
77
International Journal of Hybrid Information Technology Vol.8, No.4 (2015)
Table 14. Confirmation Test for MRR and Ra Values Sr. No.
Level & Response Value
Initial Level & Response Value
1 2 3
Level MRR (mm3/sec) Ra (µm)
A1 B1 C 2 D 1 227.34 2.35
Optimum Predicted Value A 2B 3C 3 D 2 378.079 0.437
Optimum Experimental Value A 2B 3C 3 D 2 385.032 0.68
7. Conclusions The turning tests are conducted on HSS (M2) work pieces using the three different geometrical carbide inserts of varying nose radius. The influences of cutting speed, feed rate, depth of cut and nose radius are investigated by Taguchi and ANOVA on the surface roughness and Material Removal Rate (MRR). Based on the results obtained, the following conclusions can be drawn: 1. The analysis of the experimental trials highlights that MRR in CNC turning process for HSS (M2) is highly influenced by feed rate followed by nose radius. 2. ANOVA analysis for MRR shows that cutting speed; feed rate, depth of cut and nose radius affect material removal rate are 0.61%, 97.11%, 0.0058%and 0.95%, respectively. 3. The optimum parameters level setting for maximum MRR is found to be A2=250 m/min, B3 = 0.30 mm/rev, C3= 0.80 mm, D2 = 0.8mm. 4. It is observed that the nose radius is most significantly influencing parameter on the Ra followed by feed rate. 5. ANOVA analysis for Ra shows that cutting speed,feed rate, depth of cut and nose radius affect surface roughness are of 2.481%,43.23%,0.00114% and 51.50 %, respectively. 6. The optimum parameters level setting for minimum Ra is found to be A3 =350 m/min,B3= 0.15 mm/rev, C2 = 0.75mm and D4 = 1.2 mm. 7. For simultaneous optimization of surface roughness (Ra) and material removal rate (MRR), nose radius is the most significant parameter affecting the performance followed by the feed rate. 8. The recommended level of CNC turning process parameters for HSS(M2)when multiresponse characteristics (MRR and Ra) considered are like cutting speed= 350m/min, feed rate = 0.15 mm/rev,depth of cut = 0.75mm and nose radius = 1.2mm.
Acknowledgements The authors wish to thank to Mr. Padhalkar (Dy. General Manager), Indian Tools Ltd., Nashik, (India) for allowing and providing all sort of experimental facilities. The authors also wish to acknowledge for the measurement and inspection support provided by Accurate Lab, Satpur MIDC, Nashik, (India). The authors would also like to thank to Dr. P. M. Ardhapurkar, Head, Department of Mechanical Engineering, SSGMCE, Shegaon, who kindly allowed working on industrial project.
References [1] T.-S. Lan and M.-Y. Wang, “Competitive parameter optimization of multi-quality CNC turning”, The International Journal of Advanced Manufacturing Technology, vol. 41, no. 7, (2009), pp. 820-826. [2] W. H. Yang and Y. S. Tarng, “Design optimization of cutting parameters for turning operations based on the Taguchi method”, Journal of Materials Processing Technology, vol. 84, no. 1–3, (1998), pp. 122– 129. [3] L. B.Abhang and M. Hameedullah, “Optimization of Machining Parameters in Steel Turning Operation by Taguchi Method”, Elsevier, vol. 38, (2012), pp. 40-48.
78
Copyright ⓒ 2015 SERSC
International Journal of Hybrid Information Technology Vol.8, No.4 (2015)
[4] M.S. Ranganath, Vipin and R.S. Mishra, “Optimization of Process Parameters in Turning Operationof Aluminium (6061) with Cemented Carbide Inserts Using Taguchi Method and Anova”, International Journal of Advance Research and Innovation,vol. 1, (2013), pp. 13-21. [5] S. V. Alagarsamy and N. Rajakumar, “Analysis of Influence of Turning Process Parameters on MRR & Surface Roughness of AA7075 Using Taguchi Method & Rsm”, International Journal of Applied Research and Studies, vol. 3, no. 4, (2014), pp. 1-8. [6] K. Krishnaiah and P. Shahabudeen, “Applied Design of Experiments and Taguchi Methods”, Reference book, PHI Publication, Edition (2013). [7] A. Hascalik and U. Caydas, “Optimization of turning parameters for surface roughness and tool life based on the Taguchi method”, International Journal Advance Manufacturing Technology, vol. 38, nos. 9-10, (20080, pp. 896-903. [8] ACE Designers Ltd. CNC Machine Catalogue. [9] Indian Tools Products Catalogue. [10] HSS (M2) data sheet, Bohler-Uddeholm.
Authors R. D. Palhade, he is an Associate Professor in Mechanical Engineering Department at Shri Sant Gajanan Maharaj College of Engineering, Shegaon, India. He received his B. E. (Production Engineering), DBM and PG-DMM from Sant Gadge Baba Amravati University, Amravati, India, and M. Tech in Mechanical Engineering of specialization Manufacturing Processes Engineering, from Indian Institute of Technology, (IIT) Kharagpur, India. He has presented more than 20 papers in International/National Journal, an international conference and national conference. He is member of Institute of Engineers (India), (IE), Kolkata and Indian Society of Technical Education, New Delhi (ISTE). K. P. Pawar, he is a Research Scholar of M.E (Advance Manufacturing and Mechanical System Design) at Shri Sant Gajanan Maharaj College of Engineering, Shegaon, India. He received his B.E. (Mechanical Engineering) from North Maharashtra University, Jalgaon, India, and MBA (Production Management) from Indian Management School and Research Center, Mumbai, India. He has two years industrial experience.
Copyright ⓒ 2015 SERSC
79
International Journal of Hybrid Information Technology Vol.8, No.4 (2015)
80
Copyright ⓒ 2015 SERSC