AIAA 2002-3535
MULTIOBJECTIVE OPTIMIZATION OF A MULTI-STAGE COMPRESSOR USING EVOLUTIONARY ALGORITHM Akira Oyama* NASA Glenn Research Center Contact Address: Ohio Aerospace Institute ICOMP, 22800 Cedar Point Rd., Cleveland, OH 44142, USA (440) 962-3148,
[email protected] and Meng-Sing Liou= NASA Glenn Research Center, MS 5-11, Cleveland, OH 44135, USA (216) 433-5855,
[email protected]
ABSTRACT
INTRODUCTION
A multiobjective design optimization tool for multistage compressors has been developed. Multiobjective Evolutionary Algorithm is used to handle multiobjective design optimization problems. Performances of compressors are evaluated by using the axisymmetric through-flow code UD0300M that employs the streamline curvature method. To demonstrate feasibility of the present method, a multiobjective optimization of a four-stage compressor design was performed for maximization of the overall isentropic efficiency and the total pressure ratio. Total pressure and solidities at the rotor trailing edges, and flow angles and solidities at the stator trailing edges are considered as design parameters. The present method obtained hundreds of reasonable and uniformly distributed Pareto-optimal solutions that outperformed the baseline design in both objectives. Detailed observation of the Pareto-optimal designs revealed some design criteria for multi-stage compressor designs.
The design of an engine component such as multi-stage compressor is a formidable challenge for designers. The first reason is that it usually involves a large number of design parameters to be optimized. Therefore, it is almost impossible for an experienced designer to find an optimum design by trial and error. Another reason is that it is typically a multiobjective problem (MOP) that simultaneously involves some competing objectives such as maximization of efficiency, maximization of mass flow rate, maximization of total pressure ratio, minimization of weight, maximization of durability, etc. While single objective optimization problems may have a unique optimal solution, MOPs present a set of compromised solutions, largely known as the tradeoff surface, Pareto-optimal solutions or nondominated solutions1. These solutions are optimal in the sense that no other solutions in the search space are superior to them when all objectives are considered (Fig. 1). The goal of MOPs is to find as many Paretooptimal solutions as possible to reveal tradeoff information among different objectives. Once such solutions are obtained, the higher-level decision-maker will be able to choose a final design with further considerations.
*
NRC Research Associate, Member AIAA Senior Scientist, Associate Fellow AIAA Copyright © 2002 by the American Institute of Aeronautics and Astronautics, Inc. No copyright is asserted in the United States under Title 17, U.S. Code. The U.S. Government has a royalty-free license to exercise all rights under the copyright claimed herein for Governmental purposes. All other rights are reserved by the copyright owner. =
1 American Institute of Aeronautics and Astronautics
Traditional design methods such as the gradient-based methods2,3 are single objective optimization methods that optimize only one objective. These methods usually start with a single baseline design and use local gradient information of the objective function with respect to changes in the design variables to calculate a search direction. When these methods are applied to a MOP, the problem is transformed into a single objective optimization problem by combining multiple objectives into a single objective typically using a weighted sum method. For example, to minimize competing functions f1 and f2, these objective functions are combined into a scalar function F as
F = w1 ⋅f1 + w2 ⋅f 2 , w1 + w 2 = 1
(1)
This approach, however, can find only one of the Pareto-optimal solutions corresponding to each set of the weights w1 and w2. Therefore, one must run many optimizations by trial and error adjusting the weights to get Pareto-optimal solutions uniformly over the potential Pareto-front. This is considerably time consuming in terms of human time. What is more, there is no guarantee that uniform Pareto-optimal solutions can be obtained. For example, when this approach is applied to a MOP that has concave tradeoff surface, it converges to two extreme optimums without showing any tradeoff information between the objectives (Fig. 2). Evolutionary Algorithms (EAs, for example, see [4]), on the other hand, are particularly suited for MOPs. By maintaining a population of design candidates and using a fitness assignment method based on the Pareto-optimality concept, they can uniformly sample various Pareto-optimal solutions in one optimization without converting a MOP into a single objective problem. In addition, EAs have other advantages such as robustness, efficiency, as well as suitability for parallel computing. Due to these advantages, EAs are a unique and attractive approach to real-world design optimization problems such as the multi-stage compressor design optimization problem. Recently, EAs have been successfully applied to single objective and multiobjective aerospace design optimization problems4-8. The objective of the present study is to develop and demonstrate a design optimization method for multistage compressors. The multiobjective evolutionary algorithm (MOEA) and an axisymmetric through-flow code (UD0300M) are coupled to maximize the overall isentropic efficiency and total pressure ratio of a multistage compressor.
EVOLUTIONARY ALGORITHMS EAs mimic mechanism of natural evolution, where a biological population evolves over generations to adapt to an environment by selection according to fitness, recombination and mutation of genes (Fig. 3). In EAs, a design candidate, objective function values, and design variables usually correspond to an individual, fitness, and genes, respectively. Starting with an initial population of design candidates that is often generated by random sampling from the design space, EAs select good design candidates in terms of fitness, which is assigned on the bias of their objective function values. Typically, fitness of a design candidate is its objective function value itself for a single objective problem. For a MOP, an individual’s fitness is determined according to the Pareto-optimal concept. Recombination is applied, where new population is generated by exchanging features of the selected designs with the intent of improving the fitness of the next generation. Then, mutation is applied to design parameters of the new population to maintain diversity in the population. EAs for MOPs are called multiobjective evolutionary algorithms (MOEAs). One of the key features of EAs is that it searches from multiple points in the design space in contrast to the traditional methods that usually move from a single design point. In addition, EAs use objective function values alone to determine a search direction and do not require derivatives or gradients of the objective function while the traditional methods use local gradient information of an objective function. These features also lead to some advantages such as 1) Capability of sampling various Pareto-optimal solutions in parallel: By maintaining a population of solutions and introducing the concept of Paretooptimality for fitness assignment, EAs can uniformly sample various Pareto-optimal solutions in parallel when applied to MOPs. 2) Robustness: Deterministic methods such as the gradient-based methods typically start with single design point and use the local gradient information to determine a search direction. Optimization depending on such local information lead to a local, not necessarily a global optimum nearby the stating point. In contrast to them, EAs determine their search direction globally and probabilistically but efficiently using their unique operators socalled recombination and mutation that give EAs capability of finding global optimums. Compared with other probabilistic methods such as the simulated annealing method3 that is similar to the gradient-based methods but tries random step according to the so-called Boltzmann probability distribution, EAs are more robust because they
2 American Institute of Aeronautics and Astronautics
maintain a population of design candidates and they don’t use function gradients that direct the search toward a local optimum. In addition, EAs have capability to handle any design problems that may involve non-differentiable objective function and/or a mix of continuous, discrete, and integer design parameters. 3) Suitability to parallel computing: Because EAs are population-based search algorithms, all design candidates in each generation can be evaluated in parallel by using a simple master-slave concept. Parallel efficiency is extremely high, if objective function evaluations consume most of CPU time. 4) Simplicity in coupling evaluation codes: Because EAs use only objective function values of design candidates, EAs do not need substantial modification or sophisticated interface to evaluation codes. If an all-out re-coding were required to every optimization problem, extensive validation of the new code would be necessary every time. EAs can save such troubles. The present MOEA uses floating-point representation, where an individual is characterized by a vector of real numbers. It is natural to use the floating-point representation for real parameter optimization problems instead of binary representation because it is conceptually closest to the real design space, and moreover, the string length is reduced to the number of design variables. To introduce the Pareto-optimality concept to the present MOEA, Fonseca’s Pareto-based ranking method9 is used for fitness assignment where an individual’s rank corresponds to the number of individuals in the current population that are better than the corresponding individual in every objective function. Fonseca’s ranking method for a minimization problem is shown in Fig. 4. Then, the N best individuals are selected according to their ranks from both the present N design candidates and the previous N design candidates for mating pool where population size is set equal to N 10. A standard sharing function11 is incorporated to maintain diversity in the population. To generate new design candidates, the blended crossover (BLX-α) is applied to the best N individuals where mating is determined randomly. The blended crossover is the most common approach for recombination of two parents represented by a vector of real numbers proposed by Eshelman and Schaffer12. In this approach, children are generated on a segment defined by two parents, but the segment may be extended equally on both sides determined by a user specified parameter α. Thus, a child solution is expressed as
Child 1 = γ⋅Parent1 + (1 − γ) ⋅Parent 2 (2)
Child 2 = (1 − γ) ⋅Parent1 + γ⋅Parent 2
(3)
where γ= ( 1 + 2α ) u - α
(4)
Child1, Child2 and Parent1, Parent2 denote design parameters of the children and parents, respectively. u is uniform random number in [0,1]. Schematic view of BLX-α is shown in Fig. 5. When an EA is applied to a design optimization problem, what is important is the balance of two conflicting goals: exploiting good solutions and exploring the search space13. Thus, BLX0.5 is used in which both exploration and exploitation are carried out equally. Since the strong elitism is used, high mutation rate of 0.2 is applied and a random disturbance is added to the parameter in the amount up to ± 20% of the design space. Unbiased initial population is generated by randomly spreading solutions over the entire design space in consideration. Population size and number of generations are set to 300 and 1000, respectively.
COMPRESSOR PERFORMANCE EVALUATION Program UD0300M14 essentially consists of two sections, i.e., an aerodynamic analysis section and a blade geometry definition section. In the aerodynamic analysis section, the program solves the momentum and continuity equations assuming the flow through the compressor is axisymmetric and inviscid. The momentum equation includes entropy gradients in the cross-streamwise and streamwise directions, and also the blade forces. The aerodynamic analysis section can be run either in the analysis mode or design mode. To define the angular momentum distribution, the user specifies the radial distributions of total pressure, total enthalpy, absolute angular momentum, or absolute whirl velocity at each computing station in the design mode. The relative flow angle distribution at each station is specified directly or by specifying the blade angle and deviation angle distribution in the analysis mode. To solve the system of equations, the program uses the streamline curvature method. In the streamline curvature method, a computing mesh is formed by the intersection of the defined computing stations with the computed streamlines. The computing stations are located at strategic points in the flow field preferably, but not necessarily, close to orthogonal to the local meridional streamline direction. The computing stations can be placed within any or all blade rows, when detailed blade evaluations are required. An initial estimate of the streamline locations is made by the
3 American Institute of Aeronautics and Astronautics
user. First, the flow within the compressor is computed on the basis of this estimate and the resulting flow distribution updates the streamline locations. This procedure is repeated until the streamline pattern converges within a user-specified tolerance. Here, losses occurring for each blade row are recalculated and continuously updated as the computation proceeds. The shock loss of stators is specified to be zero. Using the resulting flow distribution, blade camber, blade chord and number of blades are obtained by running the blade geometry definition section. Complete details of the formulation and the solution procedure are given in [14].
FORMULATION OF OPTIMIZATION PROBLEM In the present study, a design optimization of a fourstage compressor with one guide vane, four rotors and four stators is demonstrated. Figure 6 shows the baseline compressor design and its computation mesh used for aerodynamic analysis. One of the major objectives for a multi-stage compressor design is maximization of the overall isentropic efficiency. However, single objective optimization of the efficiency results in a drop in the total pressure ratio15. Therefore, multiobjective optimization is formulated in the present study where the objectives of the present design are maximization of the overall isentropic efficiency and the total pressure ratio. Because these objectives are competing each other, the solution is not a single optimum but a set of Pareto-optimal solutions. The radial distributions of total pressure and solidities at rotor trailing edges and flow angles and solidities at stator trailing edges are chosen as design variables to be optimized because they have a direct impact on the overall efficiency as well as the total pressure ratio. These radial distributions are expressed by using a cubic-spline interpolation scheme where each curve is defined by five control points at specified radial stations. These control points are taken as design parameters. As a result, the design problem has 80 design parameters (eight blades times two radial distributions times five control points). The search range of each parameter is set to ± 10% of the baseline design. A constraint is applied to diffusion factor of each rotor and stator to be smaller than 0.55 to avoid obtaining designs with flow separations.
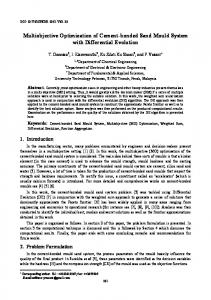
RESULTS The numerical results were obtained on a SGI workstation and CPU time required for the entire optimization was approximately 3 hours and 40 minutes. An execution of EA resulted in 222 different
Pareto-optimal designs. Figure 7 shows the overall isentropic efficiency and the total pressure ratio of the Pareto-optimal designs and the baseline design. The present MOEA found reasonable Pareto-optimal designs including a design that improved the isentropic efficiency by over 1% (from 0.866 to 0.876) while maintaining the total pressure ratio (shown by “high efficiency design” in the Fig. 7) and a design that improved the total pressure ratio by more than 9% (from 5.19 to 5.66) while maintaining the efficiency (shown by “high Pt ratio design” in the Fig. 7). Figures 8-11 compare radial distributions of rotor solidities of the baseline and the two Paretooptimum designs. The rotor solidity distributions of the optimized designs were basically minimized to improve the efficiency. The solidity distributions of rotor 4 in midspan region is not minimized to avoid diffusion factor greater than 0.55. Lower solidity translates into shorter chord and/or smaller number of blades. Figures 12-15 compare the rotor total pressure distributions. The reason why the total pressure of the high efficiency design in the Fig. 15 exceeds the upper search bound near the hub is that the search boundaries are applied only to the control points. The high efficiency design has higher total pressure in mid-span region and lower total pressure in hub and tip region at rotor 1 and rotor 2. The optimum design obtained by maximizing the isentropic efficiency using a gradientbased method in [15] has similar distributions. The high efficiency design results in total pressure lower than that of baseline design in rotors 1-3. On the other hand, the high Pt ratio design has generally higher total pressure ratio than the baseline design in order to increase the total pressure ratio. However, the total pressure distributions do not reach the upper limit because excessively large total pressure would results in diffusion factor greater than 0.55. Figures 16-19 compare stator solidity distributions. The stator solidity distributions of the high efficiency design are minimized in stators 1-3 to improve the overall efficiency. The solidity distribution of stator 4 is not minimized to avoid diffusion factor greater than 0.55. The stator solidity distributions of the high Pt ratio design are also small but larger than those of the high efficiency design. The reason is that the high Pt ratio design is more sensitive to the diffusion factor constraint and smaller solidity distributions could lead to diffusion factor greater than 0.55. Figures 20-23 compare stator flow angle distributions. The stator flow angle distributions of the optimized designs are very complicated. One of the reasons is that the stator flow angle is less sensitive to the design objectives and constraint compared with the other design parameters. The flow angle distributions of stator 4 of the optimized designs are high because
4 American Institute of Aeronautics and Astronautics
stator 4 is more sensitive to the diffusion factor constraint and smaller flow angle would result in violation of the constraint.
CONCLUSIONS A multiobjective design optimization tool for multistage compressors has been developed. Multiobjective Evolutionary Algorithm is used to handle multiobjective design optimization problems. Performances of compressors are evaluated by using the axisymmetric through-flow code UD0300M that employs the streamline curvature method. To demonstrate feasibility of the present method, a multiobjective optimization of a four-stage compressor design was demonstrated for maximization of the overall isentropic efficiency and the total pressure ratio. The diffusion factor is constrained to avoid designs involving flow separation. Total pressure and solidities at the rotor trailing edges, and flow angles and solidities at the stator trailing edges are considered as design parameters. The present method obtained hundreds of reasonable and uniformly distributed Pareto-optimal designs that include designs outperforming the baseline design in both objectives. Detailed observation of the Pareto-optimal designs revealed some design criteria for multi-stage compressor designs.
ACKNOWLEDGEMENTS The authors thank Drs. J. J. Adamczyk, L. M. Larosiliere, and D. R. Reddy for making the UD0300M code available. We are grateful to Dr. Larosiliere for useful discussion during this study.
REFERENCES 1) Stewart, T. J., “A Critical Survey on the Status of Multiple Criteria Decision Making and Practice,” International Journal of Management Science, Vol. 20, No. 5/6, 1992, pp.569-586. 2) Vanderplaats, G. N., Numerical Optimization Techniques for Engineering Design, McGraw-Hill Book Company, New York, NY, 1984. 3) William, H. P., Saul, A. T., William, T. V., and Brian, P. F., Numerical Recipes in Fortran 77: The Art of Scientific Computing, Cambridge University Press, Cambridge, 1996, pp. 436-448. 4) Miettinen, K., Makela, M. M., Neittaanmaki, P. and Periaux, J. (Eds.), Evolutionary Algorithms in Engineering and Computer Science, John Willey & Sons Ltd, Chichester, U.K., 1999. 5) Obayashi, S. and Takanashi, S., “Genetic Optimization of Target Pressure Distributions for
Inverse Design Methods, ” AIAA Journal, Vol. 34, No. 5, 1996, pp. 881-886. 6) Oyama, A., “Multidisciplinary Optimization of Transonic Wing Design Based on Evolutionary Algorithms Coupled with CFD solver,” CD-ROM Proceeding of the European Congress on Computational Methods in Applied Sciences and Engineering, Barcelona, Spain, 2000. 7) Oyama, A. and Liou, M. S., “Multiobjective Optimization of Rocket Engine Pumps Using Evolutionary Algorithm,” Journal of Propulsion and Power, Vol.18 No. 3, 2002. 8) Benini, E. and Tourlidakis, A., “Design Optimization of Vaned Diffusers for Centrifugal Compressors Using Genetic Algorithms,” AIAA paper 2001-2583, 2001. 9) Fonseca, C. M. and Fleming, P. J., “Genetic Algorithms for Multiobjective Optimization: Formulation, Discussion and Generalization”, Proceedings of the Fifth International Conference on Genetic Algorithms, Morgan Kaufmann Publishers, Inc., San Mateo, CA, 1993, pp. 416423. 10) Tsutsui, S. and Fujimoto, Y., “Forking Genetic Algorithms with blocking and shrinking modes (fGA),” Proceedings of the Fifth International Conference on Genetic Algorithms, Morgan Kaufmann Publishers, Inc., San Mateo, CA, 1993, pp. 206-213. 11) Goldberg, D. E., Genetic Algorithms in Search, Optimization and Machine Learning, AddisonWesley Publishing Company, Inc., Reading, MA, 1989. 12) Eshelman, L. J. and Schaffer, J. D., “Real-coded genetic algorithms and interval schemata,” Foundations of Genetic Algorithm 2, Morgan Kaufmann Publishers, Inc., San Mateo, CA, 1993, pp.187-202. 13) Booker, L. B., “Improving Search in Genetic Algorithms,” Genetic Algorithms and Simulated Annealing, Morgan Kaufmann Publishers, Inc., San Mateo, CA, 1987, pp. 61-73. 14) Law, C. H., and Puterbaugh, S. L., “A Computer Program for Axial Compressor Design (UD0300M),” AFWAL-TR-82-2074, Aero Propulsion Laboratory, Wright-Patterson AFB, OH, September 1982. 15) Reddy, E. S., Curtis, E. P., Reddy, D. R., and Malak, M. F., “A Performance Enhancement Tool for a Multi-Stage Compressor,” AIAA96-2554, 1996.
5 American Institute of Aeronautics and Astronautics
A
evaluation of designs
D B
E
Pareto-front C objective function f1
objective function f2
Figure 1. The concept of Pareto-optimality. This is an example of MOPs, which minimizes two conflicting objectives f1 and f2. This MOP has innumerable compromised Pareto-optimal solutions such as solutions A, B, and C. These solutions are optimal in the sense that there is no better solution in both objectives. One cannot say which is better among these Pareto-optimal solutions because improvement in one objective degrades another.
Feasible region
A
initial population
C
Pareto-front
B
objective function f1 Figure 2. Weighted-sum method applied to a MOP having a concave Pareto-front. Any combination of weights w1 and w2 would results in the extreme optimum A or B. A gradient-based method may stack in a local optimum C due to complexity of the objective function distributions.
Next generation
selection according to fitness recombination of selected designs
mutation applied to new designs Figure 3. Flowchart of the present evolutionary algorithm.
objective function f2
objective function f2
F
Feasible region G
Feasible region G(6)
F(3) A(1)
D(2)
B(1)
E(2)
Pareto-front C(1) objective function f1 Figure 4. Fonseca’s Pareto-ranking method for a multiobjective minimization problem. Because the solutions A, B, C are Pareto-optimal these solutions rank first. The solutions D and E rank second because they are worse than the solutions B and C on both objectives, respectively. The solution F ranks third because two solutions (A and B) are better than the solution F on both objectives.
6 American Institute of Aeronautics and Astronautics
α⋅d
α⋅d
d
Parent1
Parent2
Possible sampling region Figure 5. Blended crossover.
R1
R2 R3 R4 S1
IGV
S2 S3 S4
Figure 6. Four-stage axial compressor baseline design
0.878
high efficiency design
isentropic efficiency
0.876 0.874 0.872 0.87
baseline design
0.868 0.866
high Pt ratio design 0.864
5
5.1
5.2
5.3
5.4
5.5
total pressure ratio Figure 7. Pareto-optimal designs.
7 American Institute of Aeronautics and Astronautics
5.6
5.7
rotor1
normalized solidity
1.6
1.8
high efficiency design high Pt ratio design baseline design
upper search bound
1.4
1.2
0
0.2
0.4
0.6
0.8
upper search bound 1.2
0.8
1
lower search bound 0
0.2
normalized solidity
1.6
1.8 high efficiency design high Pt ratio design baseline design
rotor4
upper search bound 1.2
1
upper search bound 1.2
lower search bound
lower search bound 0.2
0.4
0.6
normalized span Figure 9. Solidity distributions of rotor 2.
1
1.4
1
0
0.8
0.8
high efficiency design high Pt raito design baseline design
1.6
1.4
0.8
0.6
Figure 10. Solidity distributions of rotor 3.
normalized solidity
rotor2
0.4
normalized span
normalized span Figure 8. Solidity distributions of rotor 1.
1.8
high efficiency design high Pt ratio design baseline design
1.4
1
1 lower search bound
0.8
rotor3
1.6
normalized solidity
1.8
1
0.8
0
0.2
0.4
0.6
normalized span Figure 11. Solidity distributions of rotor 4.
8 American Institute of Aeronautics and Astronautics
0.8
1
rotor1
1.15 1.1
1.2
high efficiency design high Pt ratio design baseline design
normalized total pressure
normalized total pressure
1.2
upper search bound
1.05 1 0.95 0.9 0.85
0.2
0.4
0.6
0.8
1.15 1.1
1 0.95
0.85
1
1.2
normalized total pressure
normalized total pressure
1.1
upper search bound
1.05 1 0.95 0.9 0.85 0
0.4
0.6
0.2
0.4
0.6
0.8
1
0.8
normalized span Figure 13. Total pressure distributions of rotor 2.
1
high efficiency design high Pt ratio design baseline design
rotor4
1.15
upper search bound 1.1 1.05 1 0.95 0.9
lower search bound 0.2
0
Figure 14. Total pressure distributions of rotor 3.
high efficiency design high Pt ratio design baseline design
1.15
lower search bound normalized span
Figure 12. Total pressure distributions of rotor 1.
rotor2
upper search bound
1.05
normalized span
1.2
high efficiency design high Pt ratio design baseline design
0.9
lower search bound 0
rotor3
0.85
lower search bound 0
0.2
0.4
0.6
0.8
normalized span Figure 15. Total pressure distributions of rotor 4.
9 American Institute of Aeronautics and Astronautics
1
stator1
normalized solidity
1.3 1.2
1.4
high efficiency design high Pt ratio design baseline design
stator2
high efficiency design high Pt ratio design baseline design
1.3
normalized solidity
1.4
upper search bound
1.1 1
1.2
upper search bound
1.1 1 0.9
0.9 lower search bound
lower search bound 0.8
0
0.2
0.4
0.6
0.8
0.8
1
0
0.2
0.4
0.6
normalized span
normalized span
Figure 16. Solidity distributions of stator 1.
Figure 18. Solidity distributions of stator 3.
stator2
normalized solidity
1.3
1.4 high efficiency design high Pt ratio design baseline design
1.2
upper search bound
1.1
stator4
1 0.9
1.2
upper search bound
1.1 1 0.9
lower search bound
lower search bound 0.8
1
high efficiency design high Pt ratio design baseline design
1.3
normalized solidity
1.4
0.8
0
0.2
0.4
0.6
normalized span Figure 17. Solidity distributions of stator 2.
0.8
1
0.8
0
0.2
0.4
0.6
normalized span Figure 19. Solidity distributions of stator 4.
10 American Institute of Aeronautics and Astronautics
0.8
1
stator1
high efficiency design high Pt ratio design baseline design
1.4
1.2
upper search bound 1
0.8 0.2
0.4
0.6
0.8
high efficiency design high Pt ratio design baseline design
1.4
1.2
upper search bound 1
0.8
lower search bound 0
stator3
1.6
normalized flow angle
normalized flow angle
1.6
lower search bound 0
1
0.2
normalized span
normalized flow angle
1.2
upper search bound 1
lower search bound 0
0.2
0.4
0.6
1
0.8
normalized span Figure 21. Flow angle distributions of stator 2.
stator4 upper search bound
1.4
0.8
0.8
1.6
high efficiency design high Pt ratio design baseline design
normalized flow angle
stator2
0.6
Figure 22. Flow angle distributions of stator 3.
Figure 20. Flow angle distributions of stator 1.
1.6
0.4
normalized span
1
1.4
1.2
lower search bound 1 high efficiency design high Pt ratio design baseline design
0.8 0
0.2
0.4
0.6
0.8
normalized span Figure 23. Flow angle distributions of stator 4.
11 American Institute of Aeronautics and Astronautics
1