Nov 13, 2011 - In this paper we address the problem of tracking multiple targets across a network of cameras with non-overlapping fields of view. Existing ...
Int. WS on Omnidirectional Vision, Camera Networks and Non-classical Cameras (OMNIVIS) 2011, in conjunction with ICCV 2011, 6-13 November 2011, Barcelona, Spain.
Multiple Hypothesis Tracking in Camera Networks David M. Antunes †‡ , Dario Figueira † , David M. Matos ‡ , Alexandre Bernardino † , Jos´e Gaspar † †
Institute for Systems and Robotics / IST Technical University of Lisbon Lisbon, Portugal
‡
L2 F - INESC-ID Systems and Computers Research Institute Lisbon, Portugal
Abstract In this paper we address the problem of tracking multiple targets across a network of cameras with non-overlapping fields of view. Existing methods to measure similarity between detected targets and the ones previously encountered in the network (the re-identification problem) frequently produce incorrect correspondences between observations and existing targets. We show that these issues can be corrected by Multiple Hypothesis Tracking (MHT), using its capability of disambiguation when new information is available. MHT is recognized in the multi-target tracking field by its ability to solve difficult assignment problems. Experiments both in simulation and in real world present clear advantages when using MHT with respect to the simpler MAP approach.
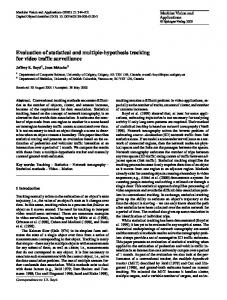
(a) t = 1
(b) t = 2
(d) Same person
(c) t = 3
(e) Same person
Figure 1. Given images acquired by the camera network at different time stamps (a, b, c), the MHT algorithm allows tracking the same person (d, e) even in cases that the clothing changes dramatically (e).
1. Introduction The problem of tracking several targets moving across a network of cameras with non-overlapping fields of view is a hard and still open problem. This problem is often addressed recurring only to re-identification. That is, computing distinctive features in the images of people obtained from the camera network, and associating instances of the same people according to appropriate metrics in the feature space. This is a challenging problem because current research has not yet discovered the ideal features for describing people (common approaches use simple color histograms, or multi-purpose features such as SIFT or SURF) and the variability of people’s appearance in different parts of the camera network may vary dramatically due to illumination, scale, perspective conditions and different camera characteristics. Furthermore, for similar reasons, person detectors are still very prone to failures such as misdetections, false positives and split detections (one person detection being split in more than one piece), and such uncertainty in the decision process must be taken into account. It is, therefore, too ambitious to try to make crisp deci-
sions about the identification of people in the network based only on simple instantaneous similarity measurements (reidentification). Longer time spans are required to accumulate evidence about the identity of people to reduce ambiguities as much as possible. It is, thus, necessary to use a tracking algorithm able to take assignment decisions based on noisy measurements received at multiple time steps, as well as the associated correspondence probabilities, in order to produce the most probable prediction through the aggregation of this information globally over time. Several such algorithms are well known in the multiple target tracking literature, for situations such as single cameras or radars, and will be reviewed in the following subsection. The preferred method for difficult tracking situations is the the Multiple Hypothesis Tracking (MHT) algorithm [7], proposed by Donald Reid in his seminal work [21]. The main contribution of our work is the formulation of the MHT algorithm for tracking multiple targets across a camera network. We have extended the MHT algorithm [21] to graph-based representations and performed both
simulations and real world experiments that illustrate the performance gains obtained with MHT. In application to the re-identification problem, MHT is more robust to detector failures, noise in the target representation and instantaneous incorrect assignments. An example of a situation prone to failure in standard approaches is shown in Fig. 1, where a person wears a jacket during the experiment. The instantaneous matching hypothesis has a low likelihood but given the measurements on the remaining time steps, the correct association gets the highest score. The paper is organized as follows. In section 2 the MHT algorithm is described and later applied to tracking in a camera network in section 3. Section 4 details the experimental results obtained. Finally Section 5 draws the main conclusions of the work.
Several tracking algorithms are available in the literature. Perhaps the most simple is the local nearest neighbor algorithm [6] which associates each target with the most similar measure in a local manner, as such, a measure may be incorrectly attributed to more than one target. Global nearest neighbors algorithms find the least cost association between all detections and targets considering them all in a global manner. Maximum a Posteriori (MAP) approaches find the most probable set of associations between detections and targets over all possible sets. Other algorithms include particle filters or the probabilistic data association (PDA) filter [3]. Finally, the the Multiple Hypothesis Tracking (MHT) algorithm [7] keeps several hypothesis in parallel for an extended time period in order to take a decision with the largest possible amount of information.
1.1. Related Work
1.2. Outline of Approach
The problem of tracking targets in camera networks is usually composed of three main stages: (i) detection, (ii) representation and (iii) tracking. In fixed camera settings, target detection is classically done with one of a class of background modeling and foreground detection algorithms such as [8, 22, 14]. In real scenarios, state-of-the-art methods still present non-negligible rates of mis-detections and false alarms, which are often disruptive for simple forms of tracking. For target representation, the detected target bounding boxes are analyzed to extract target features, several types of which have been proposed in the literature. Teixeira and Corte-Real [23], Omar et al. [20] and Aziz et al. [2] use the general purpose feature descriptors SIFT [16] and SURF [4], while Javed et al. [15] and Cong et al. [24] use color histograms. Figueira et al., Zheng et al. and Berdugo et al. [12, 25, 5] provide a wide review on the different features which can be used for people appearance, and the various distances and similarity measures for matching those features in different images. Simple matching is ambiguous, therefore researchers have looked at modeling spatial constraints on the possible locations of targets in the camera network. Gilbert and Bowden [13] were pioneering in automatically extracting the camera topology and using it to weight the coarse color similarity measures while tracking people across cameras. Loy et al. [17] uses a simpler approach, not doing any tracking, but simply dividing the camera image planes into correlated regions, and then spectral clustering these together, to form priors which will weight the similarity measure between two person detections. Our approach will enforce not only spatial but also temporal constraints1 in a multiple target tracking framework.
We propose detecting targets using standard background subtraction [8]. The targets are represented by color histograms. The tracking is based in the MHT algorithm, whose disambiguation capabilities allow the resolution of past mis-associations when more information is available. The granularity of the detections is defined by coarse zones, usually one zone for each camera. In other words, we propose doing tracking in a graph and thus do not require precise incremental-locations as needed for example with (x, y) tracking in the field of view of a single camera. With a large coarse resolution for tracking, misdetections are more tolerable, allowing the detector to be tuned to significantly reduce false positives.
1 Some works use short-term temporal data-association to represent tracks of the same person in a single camera. We aim at cross-camera longer term time-spans (tens of frames).
2. Multiple hypothesis tracking algorithm In its usual formulation, the MHT is used to track various targets over two or three dimensional spaces [21]. The algorithm continuously maintains a set of hypotheses on the various possible states of the world. Each hypothesis contains information on the existing targets, and their tracks. Each has a probability of being correct. The system periodically receives a new scan containing data from the sensors. All the measurements in time k are denoted by Z k , and the measurement l of time k is denoted by Zlk . Each measurement corresponds to an observation, and is usually associated with a (x, y) or (x, y, z) position in space and possibly other additional target features, such as target size. Let Ωki denote the hypothesis i in scan k. Each hypothesis Ωki contains a set of existing targets ι Tik (ι ∈ 1..n targets), the state estimate for each target, the state estimate covariance, and the association ψik , between the measurements Z k and the hypothesized targets Tik . Every hypothesis Ωki is associated with a probability pki . In each k, the hypotheses Ωk−1 are used to produce the hypotheses Ωk . For each hypothesis Ωk−1 a new set of hyj potheses is generated j Ωk which have Ωk−1 as parent (suj
perscript j indicates hypothesis with parent j). In the generation of the new set of hypotheses j Ωk , each observation Zlk is considered to be either a false alarm (FA), a new target (NT), or a detection of an existing target. However, an observation Zlk is only considered to have origin in a target ι Tik of hypothesis Ωk−1 if it falls in the target’s gate j (area around target’s expected position) – which is calculated based on the covariance of the state estimate. Furthermore, each observation can usually only be assigned to at most one target, and each target can only be assigned to at most one observation (group tracking is addressed by Mucientes and Burgard [18]). A target track is terminated if the target is not detected after n time steps. The probability of a new hypothesis j Ωki given the parent hypothesis Ωk−1 and the measurements Z k , is j j k pi
1 N −N = × Pd Nd × (1 − Pd ) t d × (PF A )Nf a × c Y (PN T )Nnt × PZlk ,ι Tik × pk−1 j
(1)
(Zlk ,ι Tik ) ∈ψik
where Nd corresponds to the number of measurements and Nt to the number of targets in Ωk−1 , Nf a is the number of j false alarms and Nnt is the number of new targets [21]. Furthermore, Pd is the probability of detecting a target, PF A the probability of a measurement being a false alarm, and PN T the probably of detecting a new target (all three fixed priors throughout this work). The probability of the parent hypothesis is pk−1 , and PZlk ,ι Tik denotes the probability j k that measurement Zl is a detection of target ι Tik , which is usually calculated based on the target position estimate, and the covariance of this estimate. The algorithm generates a combinatorial explosion of hypotheses. This exponential growth of the number of hypotheses can be controlled by pruning the hypothesis tree. Usual pruning strategies include limiting the number of leaves, or the depth of the tree [3]. However, while generat), the number ing the hypotheses j Ωk , for a single leaf (Ωk−1 j of hypotheses to generate can be too large to process in real time. For example, if there were 30 targets in Ωk−1 , and j Z k contains 30 measurements there will be 6.2 × 1037 hypotheses in j Ωk (for more details on calculating the number of generated hypotheses see Danchick and Newnam [11]). These hypotheses will eventually be pruned, after the hypotheses for all leaves are generated, but the processing time and memory space that the explicit enumeration of all these hypotheses consumes is insupportable. A solution is to use an algorithm due to Murty to find the ranked k-best assignments for the association in each leaf [10], instead of explicitly enumerating all the possible hypotheses. Clustering, which consists of dividing the hypothesis tree into several trees taking advantage of the independence between the tracks of some targets, can also be used to reduce the pro-
cessing requirements of MHT and increase its performance [21]. To implement the MHT algorithm, we used the Multiple Hypothesis Library, described by Antunes et al. in [1]. This library already handles clustering, and provides pruning of the tree limiting both the tree depth and the number of leaves. We also implemented the Murty algorithm for finding the k-best assignments.
3. Tracking in Camera Networks We will now describe the application of the MHT algorithm to the specific problem of tracking on a multi-camera network with non-overlapping fields of view, which is the most common real life scenario.
3.1. Graph representation We propose that the tracking area be represented as a graph. Let G = (A, C) denote the graph representing the tracking area, where A consists of a set of tracking zones A = z1 , ..., zn and C of a set of connections between zones. Thus, (zi , zj ) ∈ C if and only if zi and zj have a connection [19]. The topology of the graph can be manually defined or learned automatically [13]. Each zone is associated with one camera, and each camera is associated with one zone. Even though, it is possible to divide the field of view of a camera into different zones, which may be useful in some specific situations, this possibility is not addressed in this work. A possible scenario is presented in figure 2 (a). Several cameras are spread throughout the tracking area, and each camera monitors a division or part of a division. The circles represent the zones in the graph and the dotted lines the connections between them. Because the tracking area is a graph, each detection Zlk ∈ Z k is associated with a z ∈ A, instead of (x, y) coordinates. Each detection also contains a set of features which describe the detected target, which will now be discussed.
3.2. Integration with the MHT Each detection Zlk ∈ Z contains the zone z where it occurred, and the upper and lower body histograms. The state information about each target includes the target identifier, the zone where the target is, the histograms of the upper and lower parts of the body, and the time of the target’s last detection. The probability PZlk ,ι Tik of measurement Zlk being a detection of target ι Tik is calculated taking into consideration the zone where the target was and the one where the measurement is taken, and also the histograms associated with the target and the ones associated with the measurement. For a detection Zlk and a target ι Tik , let l hZ and u hZ be the lower and upper histograms associated with the detection, and l hT and u hT the histograms associated with the
(a) Floor map, cameras and zones graph
(b) Initial poses
(c) Detections
(e) Hypothesis 1
(f) Hypothesis 2
Figure 2. Example of a tracking area and the zones graph. Each camera has a field of view (gray area) which defines a single zone (a). Given an initial configuration where two persons, A and B, are in zone 4 (b), and then two target detections occur in zones 3 and 4 (c), one has various possibilities of localization of the two targets. Assuming both detections are valid, and related to the targets A and B, then one has two hypothesis, A in 3 and B in 4 (d), or vice versa, B is in 3 and A is in 4.
target. Also, let zD and zT be respectively the zone associated with the detection and the zone where the target was in the hypothesis Ωk−1 . j The probability PZlk ,ι Tik is calculated as: PZlk ,ι Tik = PhZ ,hT · PzD ,zT
(2)
The probability PhZ ,hT depends on the difference between the histograms, which is calculated using the Bhattacharya coefficient: m q X T (hZ B(hZ , hT ) = (3) i · hi ) i=1
where m is the number of bins in the color histograms. The Bhattacharya coefficient is 1 if the histograms are equal, and 0 if they are disjoint. A comparison between the Bhattacharya similarity and other measures for the purpose of re-identification is provided by [12]. The Bhattacharya coefficient is then used to calculate PhZ ,hT : �−1 � 2 − B(l hZ , l hT ) − B(u hZ , u hT ) PhZ ,hT = 1 + λ · 2 (4)
1 , 1]. The The probability PhZ ,hT will be in the interval [ λ+1 value of λ should be chosen to obtain the desired minimum value for probability PhZ ,hT . The probability PzD ,zT is 1 when zD = zT . For other cases, there are several manners in which PzD ,zT can be calculated. In the simplest form, PzD ,zT = c, where c is a constant probability of transition between zones, when (zD , zT ) ∈ C (the zones have a connection), and PzD ,zT = 0 when (zD , zT ) ∈ / C. A more flexible approach includes a probability transition matrix, M , such that Mzi ,zj contains the probability of transition between zones zi and zj , then PzD ,zT = MzD ,zT when (zD , zT ) ∈ C. Gilbert and Bowden provide a method for the automatic learning of M [13]. The most complex case occurs when (zD , zT ) ∈ / C and PzD ,zT 6= 0 is required, that is, the target is detected in a zone which does not have a direct connection with the one in which it was before, and a probability modeling which does not simply assign 0 to PzD ,zT is required. In this case, the person crossed one or more zones without being detected. Therefore, there is not a single path that he could have taken from zT to zD , but many possible paths. Because it is impossible to determine exactly which of the possible paths was taken, and no future information will help with this task, the path with the greatest probability of being the correct one should be chosen. This path will naturally correspond to the one that maximizes the product of the probability of transition between all the zones in the path. This is the problem of finding the shortest path in a graph, and is usually solved using the Dijkstra algorithm. However, because the matrix M is constant over time, the shortest paths between all the zones in the graph can be precomputed using the Floyd-Warshall algorithm [9].
3.3. Entry zone When the tracking area of interest is in the interior of a closed building or sealed area it is possible to greatly improve the tracking results by defining one or more entry/exit zones. In a closed building, new targets cannot appear in all the tracking zones. Usually, there are a few entrances where the targets can enter and leave the tracking area, which is the case with the example in figure 2. In the tracking area represented in the figure, a target track can only initiate and terminate in zone 3. If this information is included in the tracker, then detections in every other zone will only be attributed to either false alarms or existing targets, and targets in those zones will not be deleted, even if they are not detected after a long period of time.
3.4. Tracking granularity In the proposed approach, targets are tracked across multiple cameras, and not locally, in the (x, y) field of view of each single camera. It would also be possible to perform the tracking of the (x, y) position of targets in each camera,
which is the usual case for tracking. However, when tracking the exact position of targets in a single camera, it is necessary to perform a fairly good background subtraction, but background subtraction algorithms often performs poorly due to shadows, reflections, wind moving objects like tree leaves or paper sheets, illumination changes, among others. This poor background subtraction performance is often responsible for poor tracking results. Contrary to the fine (x, y) tracking, when tracking across zones, the requirements on the background subtraction performance can be reduced. This makes it possible to use tighter thresholds for detection and finer filtering to reject blobs which may be false detections, reducing the number of false positives, but also the number of true positives as well. This would not be possible if tracking was done in the field of view of a single camera, as the reduction of true positives would result in many lost tracks. On the contrary, when tracking across cameras, it is not as necessary to have many detections of the same target, in the same zone, in sequence. There are some particular situations where finer grained tracking is necessary. This may happen with cameras covering a large field of view, with high resolution and several small targets. In this case, the field of view of the camera may be divided into a grid of separate zones, in which case the proposed solution is directly applicable. Furthermore, local tracking in each camera can always be performed if necessary, in parallel with the proposed approach.
4. Experiments The problem of tracking people across a camera network is often addressed with re-identification only, i.e. matching through the similarity between each detection and each existing target. Few works actually use inter-camera tracking mechanisms. One such work, also in the context of tracking in camera networks, is the work of Javed et al. [15], that uses a MAP approach, similar to a global nearest neighbors association [3]. In the conducted experiments the MHT algorithm, in its standard implementation, is compared with an MHT implementation with only one leaf, which is equivalent to the MAP approach (as defined by [3]). MAP considers all detections and existing targets at each scan and chooses the best assignment. However, it does not account for the possibility that the assignment may be erroneous [3].
4.1. Changing target In this experiment, the tracking area includes three zones, z1 , z2 , and z3 , corresponding to the fields of view of three cameras, Cam1, Cam2, and Cam3, respectively (see figure 3(a)). Figure 3(b) shows just three images for each camera, but in fact there are many more intermediate images. The time stamps, t = 1, t = 2, and t = 3, indicate relevant events, namely beginning of experiment and
appearance of novel objects in the cameras of the network. The video frames captured by the three cameras are processed in order to detect foreground objects and detected objects are characterized by two histograms, one above and one below the waist, performing a search for the point that maximizes the distance between the upper and lower part histogram, as described by Figueira and Bernardino [12]. In the beginning of the experiment two persons, A and B, are visible in z1 , and both walk away, leaving the field of view of Cam1. Then, A appears in Cam2 and, shortly after, B appears in Cam3. The person A is initially wearing white clothes, while B is wearing dark clothes (see the top-left image in figure 3(b)). When A reappears in Cam2 he is wearing a dark jacket, changing his color histogram significantly. With the jacket he becomes more similar to B, as seen in Cam1, than with himself. Tables (c), (d) and (e), in figure 3, show the ground truth, the tracker predictions of MAP and MHT respectively. At t = 2, both MAP and MHT algorithms make an incorrect association, placing B in z2 . However, at t = 3, i.e., when B later appears in Cam3 (z3 ), MHT is able to correct the prediction, and thus concludes that A went to z2 and B went to z3 , while MAP maintains the incorrect association. The rationale behind the correction of the MHT prediction is as follows. The color description of the persons is not expected to change, therefore, hypotheses in which the histograms change receive a probability penalization. This penalization occurs via the PhZ ,hT term of PZlk ,ι Tik . Assume now a simplification with grey scale histograms having only one bin, which will be used to give the reader the intuition of what is being calculated by the MHT algorithm and why it is able to correct its previous decision. In all experiments, the targets’ gates are of size 1, thus the tracker assigns a probability of 0 to the possibility of a target crossing a zone undetected. In Cam1, assume that A has a histogram of 0, and B a histogram of 1. When A appears in Cam2 he has a histogram of 0.7. In the hypothesis according to which A is in z2 , the total change in histograms is of 0.7, but in the hypothesis which places B in z2 , the total change in histograms is only 0.3. Thus, at this point, B would always be placed in z2 by any algorithm. When B appears in Cam3, his histogram in that detection is still 1. Because the target’s gate is 1, when one of the persons is in z2 , the algorithm will place the other person in z3 , that is, in the hypothesis where A is in z2 , B will be placed in z3 (z3 is not in A’s gate), in the hypothesis where B is in z2 , A will be placed in z3 . The hypothesis which placed B in z2 has a total change in histograms of 0.3 + 1 = 1.3, but the hypothesis which correctly placed A in z2 has a total change in histograms of only 0.7. Because greater change in histograms directly translates into lower probability of an hypothesis, the hypothesis which placed A in z2 will now be selected as the
t=1
t=2
(a) Ground truth localiz. Zone 1 Zone 2 Zone 3
t=1 A, B
t=3
(b)
t=2
t=3
A
A B
MAP localiz. Zone 1 Zone 2 Zone 3
t=1 A, B
(c)
(d)
t=2
t=3
B
B A
MHT localiz. Zone 1 Zone 2 Zone 3
t=1 A, B
t=2
t=3
B
A B
(e)
Figure 3. Two people tracking with three non-overlapping cameras. Persons A and B start in the field of view of Cam1, and then both move out. A puts on a jacket and enters the field of view of Cam2. After some delay, B enters in the field of view of Cam3 (a). Top, middle and bottom rows show images acquired by Cam1, Cam2 and Cam3, respectively (b). Ground truth localization of people (c), estimated localization using MAP (d) and using the proposed MHT (e).
best hypothesis, because it has a total change in the histograms of only 0.7, versus 1.3 in the other hypothesis. With MAP, person A would be incorrectly labeled as B in z2 , and when B really appeared in z3 , the best assignment would be to incorrectly place A in z3 . Furthermore, if no tracking algorithm was used, then B could possibly be assigned to the detection in z2 , and also to the detection in z3 .
comprised of 5000 scans, with 1 second per scan, and the simulated people take 3 to 6 scans to move between areas. The history of the tracks produced by each tracker is analyzed and the average number of incorrect assignments per scan during the simulation is used to measure the tracker’s performance. If a target ι T k−1 was assigned an identifier i in scan k−1 and an identifier j 6= i in scan k by the tracking algorithm, then an assignment error occurred.
4.2. Simulation A large tracking area is simulated, consisting of 57 zones, each zone containing a camera (depicted in figure 4 (a)). During the simulation, 40 targets move in the tracking area. Each target initially chooses a random zone and walks there by the shortest path. Upon arrival, he repeats the same behavior, indefinitely.Two sources of uncertainty are considered. One source of uncertainty models camera noise, illumination changes, person pose and other changes alike, as additive Gaussian noise in the targets’ histogram. The other source of uncertainty models target detector reliability issues by deleting from the simulation detections at a certain mis-detection rate. Several simulations were run, with varying values of histogram noise and mis-detection rates. Each simulation is
In figure 4 (e), the performance of MHT and MAP are presented, with varying levels of noise added to the target’s histograms, for a percentage of misdetections of 15%. In figure 4 (f) the percentage of misdetections is varied, for an added noise in the target’s histograms of 0.8.
Comparing the MHT’s performance with the MAP performance, MAP makes the best assignment between measurements and targets at each scan but, as it does not maintain multiple hypotheses on possible states of the world, it cannot recover from past mistakes as well as MHT does. Therefore, MHT consistently obtains better results than the MAP approach.
5 10 15 20 25 30 35 5
(a) Setup formed by 57 zones and 40 targets
(b) Targets motion from t = 819 to t = 820
5 10 15 20 25 30 35
12
MAP MHT
10 8 6 4 2 0
10
20
30
40
(d) Minimal distances from t = 819 to t = 820
20
25
30
35
12
MAP MHT
10 8 6 4 2 0
0 40 0
15
14 Average number of incorrect associations
Average number of incorrect associations
14 0
10
(c) Target distances from t = 819 to t = 820
0.5
1
1.5 2 2.5 Gaussian noise stdev
3
(e) Association errors vs noise added to target histograms
0
0.5
1
1.5 2 2.5 Gaussian noise stdev
3
(f) Association errors vs % misdetections
Figure 4. Simulated experiment involving the tracking of 40 targets in a 57 zones setup (a). All the targets can move to an adjacent node at each time step (b). Distances 1 − B(hZ , hT ) (Eq.3) and the best matchings among all targets are shown in (c) and (d) for the same time step indicated in (b). Correct and incorrect histogram matchings are marked with blue dots and red stars, respectively. Assessment of target and measurement associations, using MAP and MHT considering noise in the observed histograms (e) or a varying percentage of misdetections (f).
5. Conclusions and Future Work In this paper, MHT was applied to the problem of people tracking across a camera network. Experiments both in real world and simulation show the improvements of using multiple hypotheses over simpler approaches which make irreversible decisions at each time-step. Without MHT, if a re-identification assignment error occurs the system makes an irrevocably wrong decision and holds to that decision indefinitely. By taking into consideration multiple hypotheses on the possible assignments between detections and targets, MHT it is able to correct past association errors when new information is received from the cameras. If new data is available which cannot be explained in a feasible way by the current best hypothesis, a different leaf in the hypothesis tree is eventually selected, changing the decision of the system towards past assignments. By integrating MHT in camera network tracking systems, the full potential of existing works on re-
identification, which focus on measuring the similarity between detections and existing targets can be leveraged, as sporadic correspondence errors are corrected over time by the MHT algorithm. In the future, we intend to scale the live experiment to a large scale camera network.
Acknowledgments This work has been partially supported by the Portuguese Government - FCT (ISR/IST pluriannual funding) through the PIDDAC program funds, by the project DCCAL, PTDC / EEA-CRO / 105413 / 2008, by the project High Definition Analytics (HDA), QREN - I&D em CoPromoc¸a˜ o 13750, and by the project MAIS-S, CMUPT / SIA / 0023 / 2009 under the Carnegie Mellon-Portugal Program.
References [1] D. M. Antunes, D. M. de Matos, and J. Gaspar. A Library for Implementing the Multiple Hypothesis Tracking Algorithm. arXiv:1106.2263v1 [cs.DS], 2011. [2] K.-e. Aziz, D. Merad, and B. Fertil. Person re-identification using appearance classification. In International Conference on Image Analysis and Recognition, 2011. [3] Y. Bar-Shalom, F. Daum, and J. Huang. The probabilistic data association filter. Control Systems Magazine, IEEE, 29(6):82–100, 2009. [4] H. Bay, A. Ess, T. Tuytelaars, and L. Van Gool. Speededup robust features (surf). Comput. Vis. Image Underst., 110:346–359, June 2008. [5] G. Berdugo, O. Soceanu, Y. Moshe, D. Rudoy, and I. Dvir. Object Reidentification in Real World Scenarios across Multiple Non-overlapping Cameras. In 18th European Signal Processing Conference, pages 1806–1810, 2010. [6] S. Blackman and R. Popoli. Design and analysis of modern tracking systems. Artech House, 1999. [7] S. S. Blackman. Multiple hypothesis tracking for multiple target tracking. IEEE Aerospace and Electronic Systems Magazine, 19:5–18, 2004. [8] T. E. Boult, R. J. Micheals, X. Gao, and M. Eckmann. Into the Woods: Visual Surveillance of Noncooperative and Camouflaged Targets in Complex Outdoor Settings. In Proceedings Of The IEEE, volume 89, pages 1382–1402, October 2001. [9] T. H. Cormen, C. Stein, R. L. Rivest, and C. E. Leiserson. Introduction to Algorithms. McGraw-Hill Higher Education, 2001. [10] I. J. Cox and S. L. Hingorani. An efficient implementation and evaluation of Reids multiple hypothesis tracking algorithm for visual tracking. In Pattern Recognition, 1994. Vol. 1 - Conference A: Computer Vision Image Processing., Proceedings of the 12th IAPR International Conference on, pages 437–442. [11] R. Danchick and G. E. Newnam. Reformulating Reids MHT method with generalised Murty K-best ranked linear assignment algorithm. Radar, Sonar and Navigation, IEE Proceedings, 153(1):13–22, 2006. [12] D. Figueira and A. Bernardino. Re-Identification of Visual Targets in Camera Networks A Comparison of Techniques. In International Conference on Image Analysis and Recognition, 2011. [13] A. Gilbert and R. Bowden. Incremental modelling of the posterior distribution of objects for inter and intra camera tracking. In British Machine Vision Conference, pages 419– 428, 2005. [14] I. Haritaoglu, D. Harwood, and L. Davis. W4: A real time system for detecting and tracking people. Computer Vision and Pattern Recognition, IEEE Computer Society Conference on, 0:962, 1998. [15] O. Javed, Z. Rasheed, K. Shafique, and M. Shah. Tracking across multiple cameras with disjoint views. Proceedings Ninth IEEE International Conference on Computer Vision, pages 952–957, 2003.
[16] D. G. Lowe. Distinctive image features from scale-invariant keypoints. Int. J. Comput. Vision, 60:91–110, November 2004. [17] C. C. Loy, T. Xiang, and S. Gong. Time-Delayed Correlation Analysis for Multi-Camera Activity Understanding. International Journal of Computer Vision, 90(1):106–129, 2010. [18] M. Mucientes and W. Burgard. Multiple Hypothesis Tracking of Clusters of People. In Intelligent Robots and Systems, 2006 IEEE/RSJ International Conference on, pages 692–697, 2006. [19] S. Oh and S. Sastry. Tracking on a graph. In IPSN 05: Proceedings of the 4th international symposium on Information processing in sensor networks, page 26, 2005. [20] B. S. Omar Hamdoun, Fabien Moutarde and B. Steux. Person re-identification in multi-camera system by signature based on interest point descriptors collected on short video sequences. In IEEE International Conference on Distributed Smart Cameras, 2008. [21] D. B. Reid. An Algorithm for Tracking Multiple Targets. IEEE Transactions on Automatic Control, 24:843–854, 1979. [22] C. Stauffer and W. Grimson. Adaptive background mixture models for real-time tracking. Computer Vision and Pattern Recognition, IEEE Computer Society Conference on, 2:2246, 1999. [23] L. F. Teixeira and L. Corte-Real. Video object matching across multiple independent views using local descriptors and adaptive learning. Pattern Recognition Letters, 30(2):157–167, 2009. [24] D. N. Truong Cong, C. Achard, L. Khoudour, and L. Douadi. Video Sequences Association for People Re-identification across Multiple Non-overlapping Cameras. In International Conference on Image Analysis and Processing, pages 179– 189, Berlin, Heidelberg, 2009. Springer-Verlag. [25] W. S. Zheng, S. Gong, and T. Xiang. Person Reidentification by Probabilistic Relative Distance Comparison. In IEEE Conference on Computer Vision and Pattern Recognition, 2011.