Mar 27, 2017 - level (individual points within each bag) or at the global level. (the bags themselves ..... directions of transportation of the blue/green earth piles.
1
Multiple Instance Learning with the Optimal Sub-Pattern Assignment Metric
arXiv:1703.08933v1 [cs.LG] 27 Mar 2017
Quang N. Tran, Ba-Ngu Vo, Dinh Phung, Ba-Tuong Vo, and Thuong Nguyen
Abstract—Multiple instance data are sets or multi-sets of unordered elements. Using metrics or distances for sets, we propose an approach to several multiple instance learning tasks, such as clustering (unsupervised learning), classification (supervised learning), and novelty detection (semi-supervised learning). In particular, we introduce the Optimal Sub-Pattern Assignment metric to multiple instance learning so as to provide versatile design choices. Numerical experiments on both simulated and real data are presented to illustrate the versatility of the proposed solution. Index Terms—Point patterns, multiple instance data, set distances, clustering, classification, novelty detection, affinity propagation
I. I NTRODUCTION Multiple instance (MI) data, more commonly known as ‘bags’ [1], [2], [3], [4], are mathematical objects called point patterns. A point pattern (PP) is a set or multi-set of unordered points (or elements) [5], in which each point represents the state or features of the object of study. Note that a set does not contain repeated points while a multi-set can. PPs appear in a variety of applications. In natural language processing and information retrieval, the ‘bag-of-words’ representation treats each document as a collection or set of words [6], [7]. In image and scene categorization, the ‘bag-of-visualwords’ representation—the analogue of the ‘bag-of-words’ in text analysis—treats each image as a set of its key patches [8], [9]. In applications involving three-dimensional (3D) images such as computer tomography scan, and magnetic resonance imaging, point cloud data are actually sets of points in some coordinate system [10], [11], [12]. In data analysis for the retail industry as well as web management systems, transaction records such as market-basket data [13], [14], [15] and web log data [16] are sets of transaction items. While PP data are abundant, fundamental MI learning tasks such as clustering (unsupervised learning), classification (supervised learning), and novelty detection1 (semi-supervised learning), have received limited attention [3], [4]. Indeed, to the best of our knowledge, there are no MI learning solutions based on PP models, nor any MI novelty detection solutions in the literature. In MI clustering, two algorithms have been developed for PP data: Bag-level Multi-instance Clustering (BAMIC) [18]; and Maximum Margin Multiple Instance Clustering (M3 IC) [19]. BAMIC adapts the k-medoids algorithm with the Hausdorff distance as a measure of dissimilarity between PPs [18]. M3 IC, 1 Novelty detection is not a special case of classification because anomalous or novel training data is not available [17].
on the other hand, poses the PP clustering problem as a non-convex optimization problem which is then relaxed and solved via a combination of the Constrained Concave-Convex Procedure and Cutting Plane methods [19]. In MI classification, there are three paradigms: InstanceSpace; Embedded-Space; and Bag-Space [3], [4]. These paradigms differ in the way they exploit data at the local level (individual points within each bag) or at the global level (the bags themselves as observations). Instance-Space is the only paradigm exploiting data at the local level which neglect the relationship between points in the bag. At the global level, the Embedded-Space paradigm maps all PPs to vectors of fixed dimension, which are then processed by standard classifiers for vectors. On the other hand, the Bag-Space paradigm addresses the problem at the most fundamental level by operating directly on the PPs. The philosophy of the Bag-Space paradigm is to preserve the information content of the data, which could otherwise be compromised through the data transformation process (as in the Embedded-Space approach). Existing methods in the Bag-Space paradigm uses the Hausdorff [20], Chamfer [21], and Earth Mover’s [22], [23] distances. In this paper, we propose the use of the Optimal SubPattern Assignment (OSPA) distance [24] in MI clustering, classification and novelty detection. The choice of set distance in MI learning can markedly influence the performance, and the OSPA distance provides more flexible design choices for different types of applications. Our specific contributions are: •
•
In MI clustering, we combine the Affinity Propagation (AP) clustering algorithm [25] with set distances as dissimilarity measures2 . We also examine the clustering performance amongst the OSPA, Hausdorff, and Wasserstein distances. Compared to existing k-medoids based techniques [18], AP can find clusters faster with much lower error, and does not require the number of clusters to be specified [25]. In addition, the OSPA distance is more versatile than the Hausdorff distance used in [18]. In MI classification, we use the OSPA distance in the k-nearest neighbour (k-NN) algorithm [27], [28], and examine the performance against the Hausdorff-based technique [20] and the Wasserstein-based technique (the Earth Mover’s distance adapted for PPs [29]). Being a Bag-Space approach, this technique exploits data at the global level, and avoids potential information loss from the embedding. Moreover, the advantage over existing
2 Preliminary results have been presented in the conference paper [26]. This paper presents a more comprehensive study.
2
Bag-Space approaches lies in the versatility of the OSPA distance over the Hausdorff [20], Chamfer [21] and Earth mover’s [22] distances. • In MI novelty detection, we propose a solution based on the set distance between the candidate PP and its nearest neighbour in the normal training set. We also examine the detection performance amongst the OSPA, Hausdorff, and Wasserstein distances. This very first MI novelty detection method is simple, effective and versatile across various applications. The rest of this paper is organized as follows. Section II presents the Hausdorff, Wasserstein and OSPA distances along with their properties in the context of MI. Based on these distances, sections III, IV, and V present the distance-based MI learning algorithms and numerical experiments for clustering, classification, and novelty detection, respectively. Section VI concludes the paper.
� � dH (X, Y ) = max max min d(x, y), max min d(x, y) , (1) y∈Y x∈X
x∈X y∈Y
Note that the Hausdorff distance is not defined when either X or Y is empty. In addition to being a metric, the Hausdorff distance is easy to compute and was traditionally used as a measure of dissimilarity between binary images. It gives a good indication of the dissimilarity in the visual impressions that a human would typically perceive between two binary images. Hausdorff distance has been successfully applied in applications dealing with PP data, such as detecting objects from binary images [32], [33], or measuring the dissimilarities between 3D surfaces—sets of coordinates of points [34]. In MI learning it has been applied in classification [3] and clustering [18].
6
II. S ET DISTANCES Machine learning tasks such as clustering, classification and novelty detection are mainly concerned with the grouping/separating of data based on their similarities/dissimilarities. A distance is a fundamental measure of dissimilarity between two objects. Hence, the notion of distance or metric is important to learning approaches without models [30], [3], [31]. In MI learning, several set distances have been introduced for PP data3 , namely the Hausdorff [20], and Chamfer [21] distances. In this section, we present the Hausdorff [20], Wasserstein [29], and OSPA distances [24]. In particular we discuss their properties and the implications in the context of design choices for MI learning algorithms. The choice of set distance in MI learning directly influences the performance and hence it is important to select distances that are compatible with the applications. For completeness, we recall the definition of a distance function or metric on a non-empty space S. A function d : S×S → [0; 1) is called a metric if it satisfies the following three axioms: 1) (Identity) d(x, y) = 0 if and only if x = y ; 2) (Symmetry) d(x, y) = d(y, x) for all x, y ∈ S ; 3) (Triangle inequality) d(x, y) ≤ d(x, z) + d(z, y) for all x, y, z ∈ S. Our interest lies in the distance between two finite subsets X = {x1 , ..., xm } and Y = {y1 , ..., yn } of a metric space (W, d), where W is closed and bounded observation window, and d denotes the base distance between the elements of W. Note that d is usually taken as the Euclidean distance when W is a subset of Rn . A. Hausdorff distance The Hausdorff distance between two non-empty sets X and Y is defined by 3 A multi-set can be equivalently expressed as a set by augmenting the multiplicity of each element, i.e., a multi-set with elements x1 repeated N1 times, ...., xm repeated Nm times, can be represented as the set {(x1 , N1 ), ..., (xm , Nm )}.
Z
4 2 X Y
0 -2 0
2
4
6
8
10
12
14
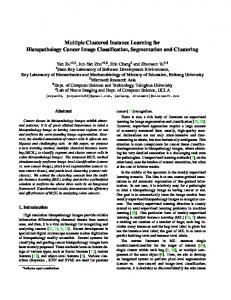
Fig. 1: Cardinality difference and out-liers in the Hausdorff distance. Left: Sets X (red •), Y (green �), and Z (blue N) in R2 . Right: Abstract impression of the Hausdorff distances between the finite sets X, Y , and Z. The Hausdorff distance could produce some undesirable effects for many MI learning applications since it may group together PPs that are intuitively dissimilar while separating PPs that are similar. Specifically: •
•
The Hausdorff distance is relatively insensitive to dissimilarities in cardinality [24]. Consequently, it can group together PPs with large differences in cardinality (e.g., X and Y in Fig. 1). This can be undesirable in many applications since the cardinalities of the PPs are important in MI learning. The Hausdorff distance penalizes heavily outliers—elements in one set which are far from every element of the other set [24]. Consequently, it tends to separate similar sets that differ only in a few outliers (e.g., X and Z in Fig. 1). This is undesirable in applications where the observed PPs of underlying groups are contaminated by outliers due to spurious noise. Nonetheless, there are applications where it is desirable to separate PPs with outliers from those without. Note that there are also generalizations of the Hausdorff distance that avoid the undesirable outlier penalty [35].
The Chamfer “distance” [21] is a variation of the Hausdorff construction, but does not satisfy the metric axioms. In terms of measuring dissimilarity, it is very similar to the Hausdorff distance, and has been used to construct a Support Vector Machine kernel for MI classification in [3].
F ℝ𝑛𝑛 s
3
B. Wasserstein distance The Wasserstein distance (also known as Optimal Mass Transfer distance [24]) of order p ≥ 1 between two sets X and Y is defined by [29] p1 m X n X (p) p (2) dW (X, Y ) = min ci,j d (xi , yj ) , C
i=1 j=1
where C = (ci,j ) is an m × n transportation matrix (recall that m and n are the cardinalities of X and Y , respectively), i.e., ci,j are non-negative and satisfies: n X
ci,j =
j=1 m X
ci,j =
i=1
1 for 1 ≤ i ≤ m, m
(3a)
1 for 1 ≤ j ≤ n. n
(3b)
Note that similar to the Hausdorff distance the Wasserstein distance is a metric [29] and is not defined when either X or Y is empty. The Wasserstein distance can be considered as the Earth Mover’s distance [23] adapted for PPs [29]. Consider the sets X = {x1 , ..., xm } and Y = {y1 , ..., yn } as collections of earth piles at xi each with mass 1/m and yj each with mass 1/n, i.e., the total mass of each collection is 1, and suppose that the cost of moving a mass of earth over a distance is given by the mass times the distance. Then the Wasserstein distance (2) can be considered as the minimum cost needed to build one collection of earth piles from the other. This is illustrated in Figs. 2 and 3, where the arrows correspond to the optimal movements of the earth piles. Indeed the Earth Mover’s distance has been used to construct a Support Vector Machine kernel for MI classification in [22], [3].
(p)
(a) To compute dW (X, Y ): move Y ’s earth piles (green) to form X’s earth piles (red).
(p)
(b) To compute dW (X, Z): move Z’s earth piles (blue) to form X’s earth piles (red).
Fig. 3: Earth mover’s interpretation of the Wasserstein distance. Sets X, Y , and Z in Fig. 2 considered as collections of earth piles. The blue/green arrows represent the amounts and directions of transportation of the blue/green earth piles.
6 Z
4
(2)
𝑑𝑑𝑊𝑊 ≈ 2.3
2
•
X
Y
0 -2 0
2
4
6
8
10
12
14
Fig. 2: Left: Sets X (red •), Y (green �), and Z (blue N) in R2 . Right: Abstract impression of the Wasserstein distances between the finite sets X, Y , and Z. The Wasserstein distance partially addresses the cardinality insensitivity and reduces the undesirable penalty on the outliers of the Hausdorff distance [24], see for example Fig. 1. However, to the best of our knowledge, it has not been used in MI, and still has a number of drawbacks. • It is still possible for the Wasserstein distance to group together dissimilar sets while separating similar sets as illustrated in Fig. 2. Intuitively X and Z are very similar whereas X and Y are quite dissimilar, but the (2) Wasserstein distance disagrees, i.e., dW (X, Y ) ≈ 1.6 < (2) dW (X, Z) ≈ 2.3. The large Wasserstein distance between X and Z is due to the moving of earth from the
bottom blue pile in Fig. 3b over long distances (the two longest blue arrows to red piles in Fig. 3b). Note that the elements of Z are not so balanced around the elements of X, and thus require the pile to be moved over long distances. On the other hand the elements of Y are more balanced around the elements of X thereby requiring less work and hence a smaller resulting distance. In general, the Wasserstein distance depends on how well balanced the numbers of points of X are distributed among the points of Y . Both the Wasserstein and Hausdorff distances are not defined if one of the sets is empty. However, in PP data, F ℝ space empty PPs are not unusual. For example, in WiFi log data where each datum (a log record) is a set of WiFi access point IDs around the scanning device at a given time, there are instances when there are no WiFi access points leading to empty observations. In image data where each image is represented by a set of features describing some objects of interest, images without any object of interest are represented by empty PPs. 𝑛𝑛
C. OSPA distance The Optimal SubPattern Assignment (OSPA) [24] distance of order p ≥ 1, and cutoff c > 0, is defined by (p,c)
dO
1 n
(X, Y ) = min
π∈Πn
m X
!! p1 d(c) xi , yπ(i)
�p
+ cp (n − m)
,
(4)
i=1
if n ≥ m > 0 (recall that m and n are the cardinalities of X (p,c) (p,c) and Y , respectively), and dO (X, Y ) = dO (Y, X) if m >
4
n > 0, where Πn is the set of permutations of {1, 2, ..., n}, (p,c) d(c) (x, y) = min (c, d (x, y)). Further dO (X, Y ) = c if one (p,c) of the set is empty; and dO (∅, ∅) = 0. The two adjustable parameters p, and c, are interpreted as the outlier penalty and the cardinality sensitivity, respectively. 6
conversely, to emphasize cardinality difference, c should be larger than the maximum base distance in the given dataset; 3) for a balanced emphasis on cardinality and feature, a moderate value of c in between the two aforementioned values should be chosen. 6
4
Y
4
Y
Z
2
2
X
X
0
Z
0F
-2
-2 0
2
4
6
8
10
12
14
0
ℝ𝑛𝑛 space
2
(2,1.4)
≈ 1.2
(2,15) 𝑑𝑑O
≈ 7.6
𝑑𝑑O
(2,6)
4
6
8
10
12
14
O
𝑑𝑑O
≈ 3.2
Fig. 4: Computing OSPA distance. Left: Sets X (red •), Y (green �), and Z (blue N) in R2 ; the dotted lines are optimal assignments between the elements of X and Y , Z respectively. Right: Abstract impression of the OSPA distances between the sets X, Y , and Z.
Fig. 5: Trade-offs between feature dissimilarity and cardinality difference in the OSPA distance. Left: Sets X (red •), Y (green �), Z (blue N), and O (cyan �) in R2 . Right: Abstract impression of the OSPA distances between the sets X, Y , Z, and O.
Assuming p = 1, to compute (4), we assign m elements of Y to the m elements of X so as to minimize the total adjusted distance d(c) (see Fig. 4 for illustration). This can be achieved via an optimal assignment procedure such as Hungarian method. For each of the (n − m) elements in Y which are not assigned, we set a fixed distance of c. The OSPA distance is simply the average of these n distances (i.e., m optimal adjusted distances and (n − m) fixed distances c). Thus, the OSPA distance has a physically intuitive interpretation as the “per element” dissimilarity that incorporates both features and cardinality [24]. The OSPA distance is a metric with several salient properties that can address some of the undesirable effects of the Hausdorff and Wasserstein distances [24].
Fig. 5 shows four PPs X, Y , Z and O, where: Y has elements that are closest to individual elements of X, but has a larger cardinality; Z has elements far away from the elements of X, but has the same cardinality; while O is visually most similar to X. In this scenario, the typical base distance between the elements of the PPs is about 1.4 and the maximum base distance is about 9.5. Choosing a small cutoff c = 1.4 (2,1.4) (2,1.4) yields dO (X, Y ) < dO (X, Z), indicating an emphasis of feature dissimilarity over cardinality difference. Choosing (2,15) (2,15) a large cutoff c = 15 yields dO (X, Y ) > dO (X, Z), indicating an emphasis of cardinality difference over feature dissimilarity. Choosing a moderate cutoff c = 6, makes O closest to X, indicating a balanced emphasis on both feature dissimilarity and cardinality difference. We stress that while the OSPA distance offers more flexibility in design choices and some merits over the other distances, there is no single distance that works for all applications.
•
•
•
•
The OSPA distance penalizes relative differences in cardinality in an impartial way by introducing an additive component on top of the average distance in the optimal sub-pattern assignment. The first term in (4) is the dissimilarity in feature while the second term is the dissimilarity in cardinality. The OSPA distance is defined for any two PPs. It is equal to c (i.e., maximal) if only one of the two PPs is empty, and zero if both PPs are empty. The outlier penalty can be controlled via parameter p. The larger p, the heavier penalty on outliers. Note that the role of p in OSPA is similar to that for the Wasserstein distance, however, it is mitigated due to the cutoff c. In practice it is common to use p = 2.4 The cutoff parameter c controls the trade-offs between feature dissimilarity and cardinality difference (see Fig. 5 for illustration). Indeed, c determines the penalty for cardinality difference and is also the largest allowable base distance between constituent elements of any two sets. As a general guide: 1) to emphasize feature dissimilarity, c should be as small as the typical base distance between constituent elements of the PPs in the given dataset; 2)
4 For
the rest of this paper, we use p = 2, unless stated.
III. C LUSTERING OF P OINT PATTERNS In general, clustering is an unsupervised learning problem since the class (or cluster) labels are not provided [36], [37]. The aim of clustering is to partition the data into groups so that members in a group are similar to each other whilst dissimilar to observations from other groups [38]. Clustering is a fundamental problem in data analysis with a long history dated back to the 1930s in psychology [39]. Comprehensive surveys on clustering can be found in [36], [30], [40]. A. Problem Formulation In a MI clustering context, the overall goal is to partition a given PP dataset D = {X1 , ..., XN } ⊆ X into disjoint clusters which minimize the sum of (set) distances between PPs and their cluster centers, while penalizing the trivial partition P = {{X1 }, ..., {XN }} (i.e., each observation is a cluster) that yields zero sum of distances. More concisely, let µ : D → X be a mapping that assigns a cluster center to each
F ℝ𝑛𝑛 s
5
PP in D, i.e., µ (X) is the center of the cluster that X belongs to, then the clustering problem can be stated as X min d (X, µ(X)) + γ(X)δX [µ (X)], (5) µ
X∈D
subject to µ (C) = C, ∀C ∈ µ(D),
(6)
where δA [B] = 1 if A = B, and is 0 otherwise, γ : D → [0, ∞) is a user chosen penalty function that imposes a penalty for the selection of an observation X as its own cluster centre, and hence penalizes the identity map µ : X 7→ X as a solution. Remark: � The mapping µ provides a partitioning P = P1 , ..., P|µ(D)| of the dataset D, where th Pk = {X ∈ D : µ (X) = C cluster and k } is the k � µ (D) = C1 , ..., C |µ(D)| is the set of cluster centers or centroids. The constraints ensure that if a PP C ∈ D is a cluster centre, then C must belong to the cluster with centre C. The user defined penalty γ(X) can also be interpreted in terms of the preference for datum X to be a centroid: the smaller γ(X) is, the higher we prefer X to be a centroid. Note that the cluster center µ (X) of a datum X can be either defined as the mean (or more generally the Fr´echet mean) of the observations in its group (e.g., k-means) or chosen among observations in the dataset, i.e., µ : D → D (e.g., k-medoids). In general, the Fr´echet mean of a collection of PPs is computationally intractable [41] and a better strategy is to select the centroids from the dataset. Such centroids, also known as ‘exemplars’ [25], can be efficiently computed as well as serving as real prototypes for the data. To the best of our knowledge, BAMIC [18] is the only exemplar-based clustering algorithm for PPs using a set distance (Hausdorff) as a measure of dissimilarity. The Hausdorff distance, used by BAMIC, has several undesirable properties as discussed in section II-A. Moreover, since BAMIC is based on the k-medoids algorithm, it requires the number of clusters as an input, which is not always available in practice. Determining the correct number of clusters is one of the most challenging aspects of clustering [30]. While it is possible to perform model selection via cross-validation for different number of clusters to decide on the best one, this process incurs substantial computational cost. In addition, it is mathematically more principled to jointly determine the number of clusters and their centers. In this work, we propose a versatile MI clustering algorithm using the AP algorithm [25] with the OSPA distance as a dissimilarity measure. For the sake of performance comparison, we also include the Hausdorff and Wasserstein distances as baselines. Using message passing, AP provides good approximate solutions to problem (5)-(6) [42], [25], thereby determining the number of clusters automatically from the data (see details in section III-B). Compared to k-medoids (used in BAMIC), AP can find clusters faster with considerably lower error [25] and does not require random initialization of cluster centers (since AP first considers all observations as exemplars). In addition, the OSPA distance does not suffer from the undesirable effects as the Hausdorff distance used in BAMIC, as well as being more flexible (section II-C).
B. AP clustering with set distances The AP algorithm has been widely used in several applications due to its ability to automatically infer the number of clusters and fast execution time. The AP algorithm uses the similarity values between all pairs of observations in the data set D = {X1 , ..., XN } and user defined exemplar preferences, as input and returns the ‘best’ set of exemplars. The similarity values of interest in this work are the negatives of the OSPA distances between the PPs in D. The preference value for a datum Xn is the negative of the penalty, i.e., −γ(Xn ), the larger its preference, the more likely that Xn is an exemplar. In AP, the exemplar for an observation Xn (which could be Xn itself or another observation) is represented by a variable cn , where cn = k means that Xk is the exemplar for Xn . Note that a configuration (c1 , . . . , cN ) provides an equivalent representation of the decision variable µ : D → D in problem (5)-(6) by defining µ (Xn ) = Xk iff cn = k. Treating each cn as a random variable, a factor graph with nodes c1 , . . . , cN can be constructed by encoding into the functional potentials the similarities between pairs of observations, the preferences for each observation, as well as constraints that ensure valid cluster configurations. Constraint (6) means that in a valid configuration (c1 , . . . , cN ), ccn = cn , i.e., if Xk is an exemplar for any observation, then the exemplar of Xk is Xk . This constraint can be enforced by setting the potential of any configuration (c1 , . . . , cN ) with ccn 6= cn to −∞. Ideally, performing max-sum message-passing yields a configuration that maximizes the sum of all potentials in this factor graph, and hence a solution to the clustering problem (5)-(6). AP is an efficient approximate max-sum message-passing algorithm using a protocol originally derived from loopy propagation on factor graphs [25].5 Further details on the AP algorithm can be found in [25], [42]. In what follows, we discuss specific details for the clustering of PP data summarized in Algorithm 1. The algorithm starts by computing all pairwise similarities input for AP: s(n, k) = −dO (Xn , Xk ), and preferences s (k, k) = −γ(Xk ). A common practice is to give all observations the same preference, e.g., the median of the similarities (which results in a moderate number of clusters) or the minimum of the similarities (which results in a small number of clusters) [25]. The AP algorithm passes two types of messages. The responsibility r(n, k), defined in (7) indicating how well Xn trusts Xk as its exemplar, is sent from observation Xn to its candidate exemplar Xk . Then, the availability a(n, k), defined in (8) reflecting the accumulated evidence for Xk to be an exemplar for Xn , is sent from a candidate exemplar Xk to Xn . Note from (7)-(8) that the responsibility r (n, k) is calculated from availability values that Xn receives from its potential exemplar, whereas the availability a (n, k) is updated using the ‘support’ from observations that consider Xk as their candidate exemplar. Note from (8) that when an observation 5 An equivalent binary graphical model representation for AP was later proposed in [43]. Instead of creating a latent node for each individual observation as in [25], a binary node bn,k is created for each pair (Xn , Xk ) and bn,k = 1 if Xk is an exemplar for Xn . Message-passing on this new factor graph representation yields the same solution.
6
Algorithm 1: Clustering of PP data using set distances. See text for values of γ(Xn ). Input: PP dataset D = {X1 , ..., XN }, Stopping threshold θ. Output: Cluster labels cn where n ∈ {1, ..., N }. for n, k ∈ {1, ..., N } do // Compute similarities s(n, k) = −dO (Xn , Xk ); // Assign preferences s(n, n) = −γ(Xn ); // Initialize messages r(n, k) = 0; a(n, k) = 0; end repeat for n, k ∈ {1, ..., N } do // Update responsibilities r (n, k) = s (n, k) − max {a (n, k 0 ) + s (n, k 0 )}; (7) 0 k 6=k
// Update availabilities X a (n, k) = min{0, r (k, k)}+ max{0, r (n0 , k)}; n0 ∈{n,k} /
(8) a (k, k) =
X
0
max{0, r (n , k)};
(9)
n0 6=k
end until change of any r(·, ·) or a(·, ·) < θ; // Return cluster assignments for n ∈ {1, ..., N } do cn = argmax (r(n, k) + a(n, k)); k
end
is assigned to exemplars other than itself, its availability falls below zero. Such negative availabilities in turn decrease the effect of input similarities s (n, k 0 ) in (7), thereby eliminating the corresponding PPs from the set of potential exemplars. The loopy propagation is usually terminated when changes in the messages fall below a threshold (see Algorithm 1), or when the cluster assignments stay constant for some iterations, or when number of iterations reaches a given value [25]. The cluster label cn is the value of k that maximizes the sum r(n, k) + a(n, k) [25]. C. Experiments In this section we evaluate the performance of the proposed AP-based clustering algorithm on both simulated and real PP data. In particular, we compare the clustering performance amongst the Hausdorff, Wasserstein and OSPA distances. Note that BAMIC (which uses the k-medoids algorithm instead of AP) can be treated as AP clustering with the Hausdorff distance. Since the result of the AP algorithm depends on the choice of exemplar preferences, we first empirically select the exemplar preference that yields the best performance in terms of number of clusters for each distance, and then benchmark the best case performance of one distance against the others. The
relevant performance indicators are: Purity (Pu), Normalized mutual information (NMI), Rand index (RI), F1 score (F1) [44]. 1) Clustering with simulated data: In this experiment, we consider three simulated datasets. Each dataset consists of 3 clusters, each cluster consists of 200 PPs generated from a Poisson point process (PPP) with a 2-D Gaussian intensity.6 In brief, a PP is sampled from a PPP with Gaussian intensity parameterized by (λ, µ, Σ), by first sampling the number of points from a Poisson distribution with rate λ, and then sampling the corresponding number points independently from the Gaussian with mean and covariance (µ, Σ). The parameters for the PPPs used in this experiment are shown in Fig. 6. Three diverse scenarios are considered: in dataset (i) features of the PPs from each cluster are well separated from those of the other clusters, but their cardinalities significantly overlap (see Fig. 6a); in data set (ii) cardinalities of the PPs from each cluster are well separated from those of the other clusters, but their features significantly overlap (see Fig. 6b); dataset (iii) is a mix of (i) and (ii) (see Fig. 6c). Three different cutoff values for the OSPA distance are experimented: c = 1 (small); c = 12 (moderate); and c = 26 (large). Note that c = 1 is a typical value of the intra-PP base distance (i.e., base distance between the features within the PPs in the dataset), c = 26 is an estimate of the maximum intra-PP base distance, and c = 12 is a moderate value of the intra-PP base distance. In dataset (i) (Fig. 6a), the Hausdorff, Wasserstein and OSPA distances with small and moderate cutoffs show good performance. The OSPA distance with a large cutoff tends to emphasize the cardinality dissimilarities (which are negligible in this scenario) over feature dissimilarities (see subsection II-C) leading to poor clustering performance. In dataset (ii) (Fig. 6b), where cardinality difference is the main discriminative information, the Hausdorff and Wasserstein distances perform poorly since they are unable to capture cardinality dissimilarities between the PPs. The OSPA distance with a small cutoff tends to emphasize feature dissimilarities (which are negligible in this scenario) over cardinality dissimilarities (see section II-C) leading to poor performance. On the other hand the OSPA distance with moderate and large cutoffs perform better since they can appropriately capture cardinality dissimilarities. In dataset (iii) (Fig. 6c), the results again confirm the discussions above. The OSPA distance with moderate cutoff provides a balanced emphasis on both feature and cardinality dissimilarities, yielding the best performance. 2) Clustering with the Texture dataset: This experiment involves clustering images from the classes “T14 brick1”, “T15 brick2”, and “T20 upholstery” of the Texture images dataset [46]. Each class consists of 40 images, with some examples shown in Fig. 7. Each image is compressed into a PP of 2-D features by first applying the SIFT algorithm (using the VLFeat library [47]) to produce a PP of 128-D SIFT features, which is then further compressed into a 2-D PP by Principal 6 This dataset is similar to that of [45]. In fact, they simulated by the same mechanism.
Cluster 2 Cluster 3
12
Cluster 2 Cluster 3
0.14
0.6
0.12
0.12
Cluster 1 Cluster 2 Cluster 3
8 6 4
2
0.08
0
14
0.04
2
0.02
0
0
0 Pu
NMI
RI
F1
PPP parameters
0.02 0
0.6
0
10 20 30 Cardinality n Cardinality histogram
Clustering performance 1
0.16
0.4
Cluster 1 Cluster 2 Cluster 3
12
performance
Cluster 1 Cluster 2 Cluster 3
0.14
0.2
0.8
Hausdorff Wasserstein
0.6OSPA with c=1
0.12
OSPA with c=12
5
10
15
10
0
10
0
20 30 8 Cardinality n
40
y
x
(a) Dataset (i)
6
10
0.25
8
0.2
Frequency
y
0.8
5 10 x Features
0.06
0.2
0.08
0.04
Cluster 1 Cluster 2 Cluster 3
7
0.4
0.1
0.06 Clustering
1
6 4
Frequency
y
4
0.1
Frequency
10
8
6 histogram Cardinality
Features 12
Frequency
y
10
0.8
0.4OSPA with c=26
0.1
Pu
NMI
RI
F1 0.2
0.08
0
0.06
Pu
1 0.8
0.02
0.6
0
0.4
0.16
0
0.15 0.1
14
0.05
12
0
10
5 10 x Features Cluster 1 Cluster 2 Cluster 3
0
10 20 30 Cardinality n Cardinality histogram
0.14
0.2
0
10
40
y
x
0
20 30 8 Cardinality n
(b) Dataset (ii)
6
Frequency
10
0.15
NMI
RI
F1 0.2
0.08
0 Pu
0.8
0.02
0.6
0
NMI
RI
F1
PPP parameters
0.04
12
0.8
0.4
0.1
Pu
0.06
4
Clustering performance
0.6
1 14
F1
1 Cluster 1 Cluster 2 Cluster 3
0.12
5
RI
2
2 0
NMI
PPP parameters
0.04
4
2
Frequency
y
10 8 6
0.1
0
5
10
0
10
20 30 Cardinality n
NMI
RI
x
0.4 0.05
4
0.2
2 0 0
5
10 x
0 0
10
20 30 Cardinality n
40
Pu
F1
(c) Dataset (iii)
Fig. 6: Clustering performance for three diverse scenarios. Dataset (i): well-separated in feature but overlapping in cardinality; dataset (ii): well-separated in cardinality but overlapping in feature; data set (iii): a mix of (i) and (ii). Performance indicators: Purity (Pu); Normalized mutual information (NMI); Rand index (RI); and F1 score (F1). Class: T14_brick1, image: 8
Class: T15_brick2, image: 6
Class: T20_upholstery, image: 6
is due to the significant overlap in the features and their inability to measure cardinality dissimilarities in the data.
Fig. 7: Example images from the Texture dataset. From left to right: image from class “T14 brick1”, “T15 brick2”, and “T20 upholstery”. Circles mark detected SIFT keypoints.
Component Analysis (PCA). Fig. 8 shows the superposition of the 2-D PPs from the three classes along with their cardinality histograms. Fig. 8 shows that the OSPA distances (especially with c = 20) outperform the Hausdorff and Wasserstein distances, since it can incorporate both feature and cardinality information. The poor performance of the Hausdorff and Wasserstein distances
3) Clustering with the StudentLife dataset: This experiment involves WiFi scan data from the StudentLife dataset [48] collected from smartphones carried by students at Dartmouth College. At every preset interval, the phone automatically scans for surrounding WiFi access points and records detected ones. Therefore, each observation is a PP of WiFi access point IDs (called WiFi IDs). The logs of these WiFi scans can be used to infer the history of visited places since scans containing similar PPs of WiFi IDs are normally recorded at close-by locations. Thus, estimating the visited locations from WiFi IDs PPs can be formulated as a clustering problem, where each cluster represents a visited location. In the StudentLife data collection, the location of each scan (at the building level) is retrieved by mapping the detected WiFi IDs to the WiFi deployment
12
0.6
0.12 Frequency
y
10 8
0.4
0.1
0
0.06
6
8
0.2
0.08
Pu
0.04
4
0.02 0 5
10
0
10
x
Features
20 30 Cardinality n
Cardinality histogram
Cluster 1 Cluster 2 Cluster 3
12
F1
40
Clustering performance 1
0.16
14
RI
Hausdorff Wasserstein OSPA with c=20 OSPA with c=300 OSPA with c=800
2 0
NMI
Cluster 1 Cluster 2 Cluster 3
0.14
0.8 0.6
0.12
y
Frequency
0.4 Fig. 8: PP data from images of classes “T14 brick1”,10 “T15 brick2”, and “T20 0.1 upholstery” of the Texture dataset, and clustering performance for various distances. 0.2 8 0.08
Feature histogram Loc 1 Loc 2 Loc 3 Loc 4
Frequency
0.06 0.04 0.02
0.25
6 Cardinality histogram 4
0.2 2
Frequency
0.08
0.15
0
5 x
Loc 1 Loc 2 Loc 3 10 Loc 4
200 400 WiFi access point ID
0 Clustering performance Pu
0.04 0.02
NMI
RI
F1
Hausdorff Wasserstein OSPA with c=300
0.6
0 0
10
0.4
20 30 Cardinality n
40
0.2
0 0
0.8
0.1 0.05
0
0.06
0
5
10 15 20 Cardinality n
25
Pu
NMI
RI
F1
Fig. 9: PP data from the StudentLife dataset and clustering performance for various distances. information provided by Dartmouth Network Services. However, this deployment information is highly protected and is not available to the general public. In this experiment data from a random participant is preprocessed so as to keep only WiFi IDs appearing at least 10 times (544 such WiFi IDs). Further, only 4 locations that received more observations than the number of WiFi IDs are considered. Fig. 9 shows the frequency histograms of WiFi IDs and cardinality histogram of the observations collected from 4 considered locations. For performance assessment, we use the locations provided in the dataset as ground-truth. Observe from Fig. 9 that the OSPA distance (other cutoff values have similar performance to that with c = 300 and are not shown) performs better than both the Hausdorff and Wasserstein distances. However, the improvement is not drastic since there are substantial overlaps in both features and cardinalities between different clusters.
which do not require knowledge of the data model. Among non-parametric classifiers such as Support Vector Machine (a binary classifier) [51], [52], Parzen window [53], k-Nearest Neighbors (k-NN) [27], [28], k-NN is more suited to PP data classification using set distances. The k-NN classifier has two phases: training and classifying. Contrary to eager learning algorithms in which a model is learned from training data in the training phase, the kNN algorithm delays most of its computational effort to the classifying (or test) phase. In the training phase, the only task is storing class labels of the training observations. In the test phase, when a new observation is passed to query its label, the algorithm determines its k nearest observations, with respect to some distance, in the training set. The queried observation is then assigned the most popular label among its k nearest neighbours. A. k-NN classification with set distances
IV. C LASSIFICATION OF P OINT PATTERNS Classification is the supervised learning task of assigning a class label ` ∈ {1, . . . , Nclass } to each input observation X [49]. Unlike its unsupervised counterpart, i.e., clustering (section III), classification relies on training data, which are train fully-observed input-output pairs Dtrain = {(Xn , `n )}N n=1 [38]. Classification is arguably the most widely used form of supervised machine learning, spanning various fields of study [38], [50]. The classification problem can be approached with or without knowledge of the underlying data model [27]. In this paper, we focus on the so-called non-parametric classifiers,
In MI learning, PP classifiers based on the k-NN algorithm using set distances such as Hausdorff [20], Chamfer [21], and Earth Mover’s [22], [23] have been proposed. However, the OSPA distance is more versatile and better at capturing feature and cardinality dissimilarities between PPs. Hence, the OSPA distance would be more effective with the k-NN algorithm for PP classification. Unlike existing k-NN classification that only stores the class labels in the training phase, our proposed approach exploits training data to learn a suitable dissimilarity measure. Since the fully observed training data can be used to assess whether the set distance agrees with the notion of
9
similarity/dissimilarity of the application under consideration, in principle, a suitable distance can be learned. A simple approach is to perform cross-validation on the training data for a range of distances and select the best. Intuitively, a suitable distance entails small dissimilarities between observations in the same class, but large dissimilarities between observations from different classes. Hence, for a given training dataset, we seek a distance (or its parameterization) that minimizes the ratio of inter-class dissimilarity to intra-class dissimilarity. In general, learning an arbitrary distance from training data is numerically intractable. However, it is possible to learn low dimensional parameters such as the cut-off parameter in the OSPA distance. The OSPA distance provides the capability for adapting the weighing between feature dissimilarity and cardinality dissimilarity via the cut-off parameter c. While the right balance between feature and cardinality dissimilarities varies from one application to another, it can be learned from the fully observed training data via cross-validation. However, cross-validation is not suitable for small training datasets. In the following, we describe an alternative approach that also accommodates small datasets. (p,c) Let d¯O (X, C) denote the average OSPA distance, with cut-off c, from a PP X to its k nearest neighbours in a collection C (of PPs), and let C` denote the class of PP observations with class label ` in the training set. Then the ˆ (p,c) (C` ) = inter-class dissimilarity for C` is defined by D (p,c) maxX∈C` dO (X, C` ) while its intra-class dissimilarity is ˇ (p,c) (C` ) = minj6=` minX∈C d(p,c) defined by D (X, Cj ). To O ` enforce small inter-class dissimilarity and large intra-class dissimilarity, we seek cut-off parameters that minimize the worst-case (over the training data set) ratio of inter-class dissimilarity to intra-class dissimilarity ! ˆ O(p,c) (C` ) D ρ(c) = max ` ˇ O(p,c) (C` ) D The operations max, min in the definition of ρ can be replaced by averaging or a combination thereof. For large training datasets averaging is preferable. B. Experiments In the following experiments, we benchmark the classification performance of the OSPA distance against the Hausdorff7 and Wasserstein8 distances on both simulated and real data. Since the performance depends on the choice of k (the number of nearest neighbours), we ran our experiments for each k ∈ {1, ..., 10} and benchmark the best case performance of one distance against the others. 1) Classification of simulated data: This experiment examines the classification performance on the three diverse scenarios from the simulated datasets of section III-C1. Using a 10-fold cross validation, the average classification performance is summarized in Fig. 10. Observe that in dataset (i), where features of the PPs from one cluster are well separated 7 and 8 and
hence the Chamfer “distance”, see subsection II-A. hence the Earth Mover’s distance, see subsection II-B.
from those of the other clusters, all distances perform well. In dataset (ii) and (iii), where features of the PPs from one cluster overlap with those of the other clusters, the OSPA distance outperforms the Hausdorff and Wasserstein since it can appropriately capture the cardinality dissimilarities in the data (Fig. 10). Dataset (i)
Dataset (ii)
Dataset (iii)
Hausdorff (k=1) 100.0'0.0%
Hausdorff (k=13) 79.8'5.6%
Hausdorff (k=3) 96.7'1.9%
Wasserstein (k=1) 100.0'0.0%
Wasserstein (k=1) 72.2'4.4%
Wasserstein (k=3) 92.8'3.6%
OSPA (k=1) 100.0'0.0%
OSPA (k=5) 95.2'3.6%
OSPA (k=2) 99.8'0.5%
0
50
100
0
Average accuracy
50
100
0
Average accuracy
50
100
Average accuracy
Fig. 10: Classification performance on simulated data for various distances (k is the number of nearest neighbours used). The error-bars represent standard deviations of the accuracies. 2) Classification of Texture data: This experiment examines the classification of the extracted PP data in section III-C2, consisting of three classes from the Texture images dataset. Using a 4-fold cross validation, the average performance is summarized in Fig. 11a. Observe that in this dataset, the OSPA distance also performs best, since it can give a good balance between feature and cardinality dissimilarities. 3) Classification of StudentLife data: This experiment examines the classification of the StudentLife WiFi dataset of section III-C3. Using a 10-fold cross validation, the average performance is summarized in Fig. 11b. For this dataset, all the Hausdorff, Wasserstein and OSPA achieve good performance, since the features (i.e., WiFi IDs) from the PPs of each cluster are well-separated from those of the other clusters. Hausdorff (k=3) 86.7'5.4%
Hausdorff (k=1) 97.3'1.9%
Wasserstein (k=1) 80.0'7.2%
Wasserstein (k=3) 94.5'3.4%
OSPA (k=3) 93.3'5.4%
OSPA (k=3) 99.7'0.4%
0
50
100
0
50
Average accuracy
Average accuracy
(a)
(b)
100
Fig. 11: Classification performance on (a) Texture data, (b) StudentLife data, for various distances.
V. N OVELTY D ETECTION FOR P OINT PATTERNS Novelty detection is the task of identifying new or strange data that are significantly different from ‘normal’ training data [54], [31]. Note that novelty detection is not a special case of classification because anomalous or novel training data is not available [17]. There are typically two phases in novelty detection: training and detection. Since its training phase requires only normal data, novelty detection is considered as semi-supervised learning [55], [17]. Novelty detection is a fundamental problem in data analysis with a plethora of
10
application areas ranging from intrusion detection [56], fraud detection [57], structural health monitoring [58], to tumor detection from MRI images [55]. However, novelty detection for point pattern data has not been studied. This section introduces a solution to the novelty detection problem for PP data by incorporating set distances into nearest neighbour algorithm. Like classification, novelty detection can be approached with or without knowledge of the underlying data model. The most common non-parametric novelty detection technique is nearest neighbour [31], which is based on the assumption that normal observations are closer to the training data than novelties [59]. This approach requires a suitable notion of distance between observations [31].
A. Novelty detection with set distances If the distance (e.g., Hausdorff, Wasserstein or OSPA) between the candidate PP and its nearest normal neighbour (NNN)9 is greater than a given threshold, then the candidate is deemed a novelty, otherwise it is normal. A suitable threshold can be chosen experimentally [54]. One suitable threshold is the 95th -percentile of the inter-class distances (between normal training observations and their NNNs). However, no single threshold is guaranteed to work well for all cases. Similar to classification with OSPA (section IV-A), training data can be used to determine a suitable balance between feature dissimilarity and cardinality dissimilarity. However, there is no inter-class dissimilarity, and hence minimizing the intra-class dissimilarity for normal data yields the trivial solution c = 0. To determine a suitable balance, consider the (p) cardinality dissimilarity dcard (X, Y ) = n1 (n − m) and feature �p Pm (p) dissimilarity dfeat (X, Y ) = n1 minπ∈Πn i=1 d xi , yπ(i) between all pairs of observations X, Y in the normal training set (assuming the cardinality m of Y is not greater than the (p) cardinality n of X, otherwise we compute dcard (Y, X) and (p) (p) dfeat (Y, X)). Note that for dfeat we use the base distance d to capture the absolute feature dissimilarity rather than the capped feature dissimilarity from base distance d(c) . To decide whether a test PP T is novel, we need to determine its cardinality dissmilarity and feature dissimilarity relative to the normal data. The relative cardinality dissmilarity and feature dissimilarity of T (with respect to the normal data) can (p) (p) (p) (p) be defined as dcard (T, T ∗ ))/mcard and dfeat (T, T ∗ )/mfeat , (p) (p) where T ∗ is T ’s NNN, mcard and mfeat are large values (e.g., (p) (p) th maximum or 95 -percentile) of dcard (Y, X) and dfeat (Y, X)) in the normal data set, respectively. Observe that summing the (p) relative dissmilarities and scaling by mfeat gives the uncapped OSPA “distance” (p)
(p)
(dO (T, X(T )))p =
mfeat (p)
mcard
(p)
(p)
dcard ((T, T ∗ ) + dfeat (T, T ∗ )
� �1/p (p) (p) Hence, a suitable cut-off parameter is c = mfeat /mcard . 9 This can be interpreted as the Hausdorff distance between the candidate and the normal data class.
B. Experiments In this section, we examine the novelty detection performance of the Hausdorff, Wasserstein and OSPA distances on both simulated and real data. 1) Novelty detection with simulated data: In this experiment, we consider cluster 2 from the simulated data set in subsection III-C1 as normal data, and clusters 1 and 3 as novel data. This allows us to study three diverse scenarios: dataset (i), see Fig. 6a, is an example of feature novelty, where novel observations are similar in cardinality with normal training data, but dissimilar in feature; dataset (ii), shown in Fig. 6b, is an example of cardinality novelty, where novel observations are similar in feature with normal training data, but dissimilar in cardinality; dataset (iii), shown in Fig. 6c, is a mix of feature and cardinality novelty. Dataset (i)
0
Dataset (ii)
Dataset (iii)
Hausdorff 0.97'0.02
Hausdorff 0.63'0.06
Hausdorff 0.93'0.02
Wasserstein 0.98'0.01
Wasserstein 0.58'0.06
Wasserstein 0.95'0.02
OSPA 0.98'0.02
OSPA 0.91'0.03
OSPA 0.98'0.01
0.5
Average F 1 score
1
0
0.5
Average F 1 score
1
0
0.5
1
Average F 1 score
Fig. 12: Novelty detection performance on simulated data for various distances. Using a 10-fold cross validation, the average performance summarized in Fig. 12. Fig. 13 shows boxplots of the distances between the test PPs and theirs NNNs. Observe that in datasets (i) and (iii), where novelties are dissimilar with normal data in feature (see Figs. 6a and 6c), all distances perform well. In dataset (ii), where novelties are dissimilar with normal data in cardinality, but similar in feature (see Fig. 6b), the OSPA distance outperforms the Hausdorff and Wasserstein since it can appropriately penalize the cardinality dissimilarity between normal and novel data (see Fig. 13b). 2) Novelty detection with Texture data: Using the Texture dataset from subsection III-C2, we consider normal data are taken from class “T14 brick1” and novel data are taken from class “T20 upholstery”. We use 4-fold cross validation. In each fold, the training data consist of 75% of images from normal class (30 images), the testing set includes the remaining images from normal class (10 images) and 25% of images from novel class (10 images). Observe that the performance of set distances (Hausdorff, Wasserstein, and OSPA) on this dataset is similar to that of set distances on the simulated dataset in section V-B1. Since normal and novel data are dissimilar in feature (see the feature plot in Fig. 8), all distances perform well (Fig. 14). 3) Novelty detection with StudentLife WiFi data: Using the StudentLife WiFi dataset described in subsection III-C3, we consider observations from locations 1 and 2 as normal data and observations from locations 3 and 4 as novelties. Using a 10-fold cross validation, the average performance is summarized in Fig. 16. Observe that all three distances (OSPA, Hausdorff and Wasserstein distance) perform similar for this dataset with average F1 score about 0.83.
11
al
110
rm No
180 200
2.6
3
80
rm al Ab
no
al rm No
no
No
Ab
Ab
rm
al
rm al
(b) Dataset (ii) 8
2.8 6
3
2.4
5 4 3
2.2 2 1.8 1.6
2
1.4
2
1.2
al no rm Ab
No
rm
al
al no rm Ab
No
rm
al
al no rm Ab
rm
al
1
No
80 70 60
40
rm al
al rm
rm al
No
al
Fig. 15: Boxplots of various NNN distances for one data fold of the Texture dataset. Thick lines across the boxes indicate the chosen thresholds.
algorithm. In MI novelty detection, a solution developed using the set distances between the candidate PP and its nearest normal neighbour in the training set.
2.6
OSPA dist.
Wasserstein dist.
Hausdorff dist.
4
100
No
1.2
rm al no
al rm No
No
1
5
150
50
60
1.4
6
90
50
1.8
rm
2
7
100
1.6
1.5
1.5
100
no
2.5
2
120
Ab
3
2
2.2
140
rm al
3.5
2.5
OSPA dist.
Wasserstein dist.
4
2.4
Wasserstein distance
2.8
5
Hausdorff dist.
Hausdorff distance
160
al
al no r Ab
Ab
No
no r
rm
m
al
al m
al rm
Fig. 14: Novelty detection performance on the Texture data for various distances.
0.8
(a) Dataset (i)
4.5
1
rm
1
No
0.5
Average F 1 score
1
2 1
0
no
2
1.2
Ab
3
OSPA 0.98'0.05
1.4
OSPA distance
4
Wasserstein 0.95'0.06
no
3
1.6
Ab
4
5
al
5
1.8
m
6
6
Hausdorff 0.95'0.05
no r
Wasserstein dist.
Hausdorff dist.
7
2
Ab
8
7
OSPA dist.
9
(c) Dataset (iii)
Numerical experiments on simulated and real data demonstrated that the OSPA distance offers more flexibility in design choices as well as the ability to better capture dissimilarities between sets compared to the other distances. We reiterate that while the OSPA distance does offer some merits over the other distances, there is no single distance that works for all applications. In practice, to determine which distance (and parameters) are better suited to which application, it is important to assess whether the distance agrees with the notion of similarity/dissimilarity specific to that application.
Fig. 13: Boxplots of distances between test data and their NNNs for one data fold of the simulated dataset. Thick lines across the boxes indicate the chosen thresholds.
Hausdorff 0.83'0.11 Wasserstein 0.82'0.09
VI. C ONCLUSIONS In this paper, algorithms for clustering, classification, and novelty detection with point pattern data using the OSPA distance have been presented. In clustering, AP is combined with the OSPA (or others such as Wasserstein and Hausdorff) distance as dissimilarity measure. In classification, the OSPA distance is incorporated into the k-nearest neighbour (k-NN)
OSPA 0.84'0.09 0
0.5
1
Average F 1 score
Fig. 16: Novelty detection performance on the StudentLife data for various set distances.
12
50
60
30 20
80
50
OSPA dist.
Wasserstein dist.
40
40 30
60 40
20 20
10
10
al
al
no rm Ab
No rm
No rm
0
al Ab no rm al
0
al Ab no rm al
0
No rm
Hausdorff dist.
100
70
Fig. 17: Boxplots of distances between test data and their NNNs for one data fold of the StudentLife dataset. Thick lines across the boxes indicate the chosen thresholds. R EFERENCES [1] T. G. Dietterich, R. H. Lathrop, and T. Lozano-P´erez, “Solving the multiple instance problem with axis-parallel rectangles,” Artificial intelligence, vol. 89, no. 1, pp. 31–71, 1997. [2] F. Minhas and A. Ben-Hur, “Multiple instance learning of calmodulin binding sites,” Bioinformatics (Oxford, England), vol. 28, no. 18, pp. i416–i422, 2012. [3] J. Amores, “Multiple instance classification: Review, taxonomy and comparative study,” Artificial Intelligence, vol. 201, pp. 81–105, 2013. [4] J. Foulds and E. Frank, “A review of multi-instance learning assumptions,” The Knowledge Engineering Review, vol. 25, no. 01, pp. 1–25, 2010. [5] J. Moller and R. P. Waagepetersen, Statistical inference and simulation for spatial point processes. CRC Press, 2003. [6] T. Joachims, “A probabilistic analysis of the rocchio algorithm with tfidf for text categorization.” DTIC Document, Tech. Rep., 1996. [7] A. McCallum and K. Nigam, “A comparison of event models for naive Bayes text classification,” in AAAI-98 Workshop learning for text categorization, vol. 752. Citeseer, 1998, pp. 41–48. [8] G. Csurka, C. Dance, L. Fan, J. Willamowski, and C. Bray, “Visual categorization with bags of keypoints,” in Workshop statistical learning in computer vision, ECCV, 2004. [9] L. Fei-Fei and P. Perona, “A Bayesian hierarchical model for learning natural scene categories,” in IEEE Comput. Soc. Conf. Comput. Vision and Pattern Recognition (CVPR), 2005, vol. 2. IEEE, 2005, pp. 524– 531. [10] R. B. Rusu and S. Cousins, “3d is here: Point cloud library (pcl),” in IEEE Int. Conf. Robotics and Automation (ICRA), 2011. IEEE, 2011, pp. 1–4. [11] A. Sitek, R. H. Huesman, and G. T. Gullberg, “Tomographic reconstruction using an adaptive tetrahedral mesh defined by a point cloud,” IEEE Trans. Medical Imaging, vol. 25, no. 9, pp. 1172–1179, 2006. [12] H. Woo, E. Kang, S. Wang, and K. H. Lee, “A new segmentation method for point cloud data,” Int. Journal Machine Tools and Manufacture, vol. 42, no. 2, pp. 167–178, 2002. [13] S. Guha, R. Rastogi, and K. Shim, “Rock: A robust clustering algorithm for categorical attributes,” in Proc. 15th Int. Conf. Data Eng., 1999. IEEE, 1999, pp. 512–521. [14] Y. Yang, X. Guan, and J. You, “Clope: a fast and effective clustering algorithm for transactional data,” in Proc. 8th ACM SIGKDD Int. Conf. Knowledge Discovery and Data Mining. ACM, 2002, pp. 682–687. [15] C.-H. Yun, K.-T. Chuang, and M.-S. Chen, “An efficient clustering algorithm for market basket data based on small large ratios,” in Comput. Softw. and Appl. Conf., 2001. COMPSAC 2001. 25th Annual Int. IEEE, 2001, pp. 505–510. [16] I. V. Cadez, S. Gaffney, and P. Smyth, “A general probabilistic framework for clustering individuals and objects,” in Proc. 6th ACM SIGKDD Int. Conf. knowledge discovery and data mining. ACM, 2000, pp. 140– 149. [17] V. J. Hodge and J. Austin, “A survey of outlier detection methodologies,” Artificial Intelligence Review, vol. 22, no. 2, pp. 85–126, 2004.
[18] M.-L. Zhang and Z.-H. Zhou, “Multi-instance clustering with applications to multi-instance prediction,” Appl. Intell., vol. 31, no. 1, pp. 47–68, 2009. [19] D. Zhang, F. Wang, L. Si, and T. Li, “M3ic: Maximum margin multiple instance clustering,” in IJCAI, vol. 9, 2009, pp. 1339–1344. [20] D. P. Huttenlocher, J. J. Noh, and W. J. Rucklidge, “Tracking non-rigid objects in complex scenes,” in Proc. 4th Int. Conf. Comput. Vision, 1993. IEEE, 1993, pp. 93–101. [21] D. M. Gavrila and V. Philomin, “Real-time object detection for ”smart” vehicles,” in Proc. 7th Int. Conf. Comput. Vision, 1999, vol. 1. IEEE, 1999, pp. 87–93. [22] J. Zhang, M. Marszałek, S. Lazebnik, and C. Schmid, “Local features and kernels for classification of texture and object categories: A comprehensive study,” Int. J. Comput. Vision, vol. 73, no. 2, pp. 213–238, 2007. [23] Y. Rubner, C. Tomasi, and L. J. Guibas, “A metric for distributions with applications to image databases,” in 6th Int. Conf. Comput. Vision, 1998. IEEE, 1998, pp. 59–66. [24] D. Schuhmacher, B.-T. Vo, and B.-N. Vo, “A consistent metric for performance evaluation of multi-object filters,” IEEE Trans. Signal Process., vol. 56, no. 8, pp. 3447–3457, 2008. [25] B. J. Frey and D. Dueck, “Clustering by passing messages between data points,” Sci., vol. 315, no. 5814, pp. 972–976, 2007. [26] Q. N. Tran, B.-N. Vo, D. Phung, and B.-T. Vo, “Clustering for point pattern data,” in 23rd Intl. Conf. Pattern Recognition (ICPR), Dec. 2016. [27] T. M. Cover and P. E. Hart, “Nearest neighbor pattern classification,” IEEE Trans. Inf. Theory, vol. 13, no. 1, pp. 21–27, 1967. [28] J. M. Keller, M. R. Gray, and J. A. Givens, “A fuzzy k-nearest neighbor algorithm,” IEEE Trans. Systems, Man and Cybernetics, no. 4, pp. 580– 585, 1985. [29] J. R. Hoffman and R. P. Mahler, “Multitarget miss distance via optimal assignment,” IEEE Trans. Systems, Man and Cybernetics, Part A: Systems and Humans, vol. 34, no. 3, pp. 327–336, 2004. [30] A. K. Jain, “Data clustering: 50 years beyond k-means,” Pattern recognition letters, vol. 31, no. 8, pp. 651–666, 2010. [31] M. A. Pimentel, D. A. Clifton, L. Clifton, and L. Tarassenko, “A review of novelty detection,” Signal Process., vol. 99, pp. 215–249, 2014. [32] D. P. Huttenlocher, G. A. Klanderman, and W. J. Rucklidge, “Comparing images using the hausdorff distance,” IEEE Trans. Pattern Anal. Mach. Intell., vol. 15, no. 9, pp. 850–863, 1993. [33] W. J. Rucklidge, “Locating objects using the hausdorff distance,” in Proc. 5th Int. Conf. Comput. Vision, 1995. IEEE, 1995, pp. 457–464. [34] P. Cignoni, C. Rocchini, and R. Scopigno, “Metro: measuring error on simplified surfaces,” in Comput. Graphics Forum, vol. 17, no. 2. Wiley Online Library, 1998, pp. 167–174. [35] A. Baddeley, “Errors in binary images and an lp version of the hausdorff metric,” Nieuw Archief voor Wiskunde, vol. 10, no. 4, pp. 157–183, 1992. [36] A. K. Jain, M. N. Murty, and P. J. Flynn, “Data clustering: a review,” ACM Comput. surveys (CSUR), vol. 31, no. 3, pp. 264–323, 1999. [37] S. Russell and P. Norvig, Artificial Intelligence: A modern approach. Prentice Hall, 2003. [38] K. P. Murphy, Machine learning: a probabilistic perspective. MIT press, 2012. [39] R. C. Tryon, Cluster analysis: correlation profile and orthometric (factor) analysis for the isolation of unities in mind and personality. Edwards brothers, 1939. [40] R. Xu and D. Wunsch, “Survey of clustering algorithms,” IEEE Trans. Neural Networks, vol. 16, no. 3, pp. 645–678, 2005. [41] M. Baum, B. Balasingam, P. Willett, and U. D. Hanebeck, “Ospa barycenters for clustering set-valued data,” in 18th Int. Conf. Inf. Fusion (Fusion). IEEE, 2015, pp. 1375–1381. [42] D. Dueck and B. J. Frey, “Non-metric affinity propagation for unsupervised image categorization,” in 11th Int. Conf. Comput. Vision (ICCV). IEEE, 2007, pp. 1–8. [43] I. E. Givoni and B. J. Frey, “A binary variable model for affinity propagation,” Neural computation, vol. 21, no. 6, pp. 1589–1600, 2009. [44] C. D. Manning, P. Raghavan, and H. Sch¨utze, Introduction to information retrieval. Cambridge univ. press Cambridge, 2008, vol. 1. [45] B.-N. Vo, Q. N. Tran, D. Phung, and B.-T. Vo, “Model-based classification and novelty detection for point pattern data,” in 23rd Intl. Conf. Pattern Recognition (ICPR), Dec. 2016. [46] S. Lazebnik, C. Schmid, and J. Ponce, “A sparse texture representation using local affine regions,” IEEE Trans. Pattern Anal. Mach. Intell., vol. 27, no. 8, pp. 1265–1278, 2005. [47] A. Vedaldi and B. Fulkerson, “Vlfeat: An open and portable library of comput. vision algorithms,” http://www.vlfeat.org/, 2008.
13
[48] R. Wang, F. Chen, Z. Chen, T. Li, G. Harari, S. Tignor, X. Zhou, D. Ben-Zeev, and A. T. Campbell, “StudentLife: assessing mental health, academic performance and behavioral trends of college students using smartphones,” in Proc. 2014 ACM Int. Joint Conf. Pervasive and Ubiquitous Comput. ACM, 2014, pp. 3–14. [49] C. M. Bishop, Pattern recognition and machine learning. Springer, 2006. [50] I. H. Witten and E. Frank, Data Mining: Practical machine learning tools and techniques. Morgan Kaufmann, 2005. [51] B. E. Boser, I. M. Guyon, and V. N. Vapnik, “A training algorithm for optimal margin classifiers,” in Proc. 5th Annual Workshop Computational Learning Theory. ACM, 1992, pp. 144–152. [52] C. Cortes and V. Vapnik, “Support-vector networks,” Machine learning, vol. 20, no. 3, pp. 273–297, 1995. [53] R. O. Duda, P. E. Hart, and D. G. Stork, Pattern classification (2nd edition). John Wiley & Sons, 2001. [54] M. Markou and S. Singh, “Novelty detection: a review – part 1: statistical approaches,” Signal Process., vol. 83, no. 12, pp. 2481–2497, 2003. [55] V. Chandola, A. Banerjee, and V. Kumar, “Anomaly detection: A survey,” ACM Comput. Surveys (CSUR), vol. 41, no. 3, p. 15, 2009. [56] T. Garfinkel, M. Rosenblum et al., “A virtual machine introspection based architecture for intrusion detection,” in NDSS, vol. 3, 2003, pp. 191–206. [57] R. J. Bolton and D. J. Hand, “Statistical fraud detection: A review,” Statistical Sci., pp. 235–249, 2002. [58] C. R. Farrar and K. Worden, “An introduction to structural health monitoring,” Philosophical Trans. Royal Soc. London A: Mathematical, Physical and Engineering Sci., vol. 365, no. 1851, pp. 303–315, 2007. [59] V. Hautam¨aki, I. K¨arkk¨ainen, and P. Fr¨anti, “Outlier detection using k-nearest neighbour graph,” in ICPR, 2004, pp. 430–433.