arrival process, this rate guarantee can be translated into .... As a matter of fact, no single rate is good ... A good approximation to this ideal service policy is to.
1132
IEEE JOURNAL ON SELECTED AREAS IN COMMUNICATIONS, VOL. 15, NO. 6, AUGUST 1997
Multirate Scheduling of VBR Video Traffic in ATM Networks Debanjan Saha, Sarit Mukherjee, and Satish K. Tripathi, Fellow, IEEE
Abstract—One of the major attractions of asynchronous transfer mode (ATM) networks for transporting bursty video traffic is its ability to exploit the multiplexing gains of packet switching while providing quality of service guarantees. Unfortunately, most of the multiplexing mechanisms proposed in the literature fail to exploit the multiplexing gains of ATM. In this paper, we propose a multirate service mechanism that allows a session to be served at different rates at different times. Applications generating bursty data, such as variable bit-rate (VBR) video, can take advantage of multirate service by requesting a high rate of service for brief periods of bursty arrivals and a much lower rate of service for all other times. Consequently, the applications can improve their delay performance without reserving a high bandwidth for the entire duration of the sessions. Furthermore, the scheduler can multiplex the peaks and the lulls in service rates of different sessions and improve the utilization of the system. Using MPEG video traces from a number of applications, we show that multirate servers outperform single-rate PGPS (packet-by-packet generalized processor sharing) servers and CBR (constant bit-rate) servers in terms of number of connections admitted, while providing the same level of service guarantees. We also investigate the performance of multirate service when service quality need not be guaranteed. We refer to this as predictive service. We propose a measurement-based admission control procedure for predictive service, and show that it helps increase the size of the admissible region even further. Index Terms—ATM, multirate, scheduling, VBR video.
I. INTRODUCTION
O
NE of the major attractions of asynchronous transfer mode (ATM) networks is its ability to exploit the multiplexing gains of packet switching while providing quality of service guarantees. A number of service architectures have been proposed [1] to realize this goal. At the heart of all of these service architectures is a multiplexing policy that is used to allocate link capacities to competing connections at the switching nodes. The manner in which multiplexing is performed has a profound effect on what service guarantees are provided and to what extent the multiplexing gain is exploited. Multiplexing mechanisms proposed for ATM networks can be broadly divided into two classes: 1) ones that provide Manuscript received May 1, 1996; revised October 2, 1996. The work of S. Mukherjee was supported in part by the AFOSR under Grant F49620-93-C0063. The work of S. K. Tripathi was supported in part by NSF Grant CCR 9318933 and by an IBM equipment grant. D. Saha is with the IBM T. J. Watson Research Center, Yorktown Heights, NY 10598 USA. S. Mukherjee is with the Department of Computer Science and Engineering, University of Nebraska, Lincoln, NE 68588 USA. S. K. Tripathi was with the Department of Computer Science, University of Maryland, College Park, MD 20742 USA. He is now with the College of Engineering, University of California, Riverside, CA 92521 USA. Publisher Item Identifier S 0733-8716(97)04194-2.
guarantees on maximum delay at the switching nodes and 2) ones that guarantee a minimum throughput. The multiplexing disciplines providing delay guarantees [24], [5] typically use static or dynamic priority-based scheduling to bound the worst case delay of a connection at each switching node. The end-to-end delay is computed as the sum of the delays at the switching nodes on the path of the connection. The multiplexing disciplines providing throughput guarantees [2], [7], [15], [25], [20], [19], [18] typically use variations of fair queueing or frame-based scheduling to guarantee a minimum rate of service at each switching node. Knowing the traffic arrival process, this rate guarantee can be translated into guarantees on other performance metrics, such as delay, delay jitter, worst case buffer requirement, etc. Rate-based schemes are preferred over schemes providing delay guarantees primarily because of their simplicity. Typically, they offer a fixed rate of service to a connection for the entire duration of its lifetime. While a fixed rate of service is adequate for constant bit-rate traffic, it is quite unsuitable for bursty traffic, such as variable bit-rate (VBR) video. For example, an MPEG-coded [13] video stream generates traffic at significantly different rates at different times, and no singlerate service is sufficient to transport it across the network. We propose a multirate service mechanism to address this problem. In our scheme, a connection is served at different rates at different times. For example, a session can be serviced at the peak rate during the times of bursty arrivals and at a lower rate at all other times. In general, we can have more than two rates of service. The length and the service rate of each of the service periods are specified by the applications at the time of connection setup. A multirate service discipline is superior to its single-rate counterpart in two ways. It allows the applications generating bursty data to request a higher rate of service for the periods of bursty arrivals and a lower average rate of service at other times. Consequently, applications can improve their delay performance without reserving a high bandwidth for the entire duration of the session. The scheduler can exploit this feature by multiplexing the peaks and the lulls in service rates of different sessions, and thereby increasing the utilization of the system. The complexity of the scheduling mechanism underlying multirate service is comparable to that of packet-by-packet processor sharing (PGPS) [15] and selfclocked fair queueing (SFQ) [8]. Recently, it has been shown [22] that variations of PGPS and SFQ can be implemented with complexity, where is the queue length. We consider two different service models: 1) guaranteed service and 2) predictive service. In the guaranteed service
0733–8716/97$10.00 1997 IEEE
SAHA et al.: MULTIRATE SCHEDULING OF VIDEO TRAFFIC
model, each connection is guaranteed a lossless delivery with a specific end-to-end delay and jitter. Although some applications cannot do without a guaranteed service, there exists a large class of applications that are robust against occasional cell losses and delay violations. The predictive service is designed for these applications. In predictive service, each connection is promised a specific grade of service with the understanding that it may be violated at times. If the applications are robust to these violations, the lack of strict guarantees can help increase the system utilization. The scheduling mechanisms used for both guaranteed and predictive services are the same. They differ only in the admission control process. In the guaranteed case, we always assume the worst case scenario. A new connection is admitted if and only if its admittance does not violate the service qualities promised to all connections, assuming worst case traffic arrivals. In the predictive service, the same admission control process is administered with the difference that, instead of the worst case estimate, we use a measurement-based estimate of traffic arrivals [10]. Using MPEG video traces from a variety of real-life applications (including news clips, basketball games, class lecture, and music videos), we have shown that multirate servers outperform single-rate PGPS servers and CBR servers in terms of the number of connections admitted while providing the same level of service guarantees. We also investigate the performance of multirate scheduling in the context of predictive service. We propose a measurement-based admission control procedure for predictive service, and show that it helps increase the size of the admissible region even further. Except for some very recent works, multirate service mechanisms have not undergone a very through investigation. In [6], a hop-by-hop shaping mechanism is proposed. It can be adapted to provide multirate service. However, the impact of this service mechanism on real-life application traffic is not addressed. A multiple time scale characterization of traffic has been proposed in [11] and [12]. In [11] and [12], the improvement in network utilization due to this enhanced traffic characterization is demonstrated in the context of ratecontrolled static priority scheduling (RCSP). Authors show that when the characterization of the sources is sufficiently accurate, a high network utilization is achievable. However, it is difficult to characterize a source accurately using commonly used usage parameter control (UPC) mechanisms, such as leaky buckets. The rest of the paper is organized as follows. In Section II, we discuss how a bursty source can be smoothed to a multirate source. Section III is dedicated to the scheduling mechanism, its realization, and the admission control algorithm. Numerical results are presented in Section IV. We conclude in Section V. II. TRAFFIC PROFILES In order to understand the suitability of multirate service for bursty traffic, let us consider an application generating MPEG-coded video. From uncompressed video data, an MPEG encoder produces a sequence of encoded frames. There are three types of encoded frames: (intracoded), (predicted), and (bidirectional). The sequence of frames is
1133
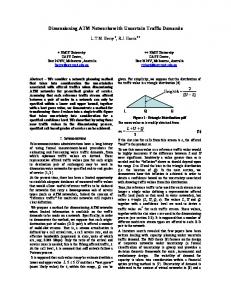
Fig. 1. Example of an MPEG coded stream.
specified by two parameters: the distance between and frames, and the distance between frames. For example, when is 2 and is 5, the sequence of encoded frames is (see Fig. 1). The pattern repeats indefinitely. The interarrival time between two successive frames is fixed, and depends on the frame rate. In general, an frame is much larger than a frame, and a frame is much larger than a frame. Typically, the size of an frame is larger than the size of a frame by an order of magnitude. Let us assume that and are the sizes of and frames, respectively.1 Now, consider the problem of choosing a single rate of service for the video stream described above. We can either choose a long-term average rate, a short-term peak rate, or any rate in between. If we choose the peak rate of service, that is, delay in the network is minimal. However, since the source generates traffic at the peak rate only for a small fraction of the time, a peak rate allocation leads to severe underutilization of network resources. If we choose the average rate of service, that is, the network utilization is high, but only at the cost of increased network delay. Clearly, neither the average rate nor the peak rate is a good choice. As a matter of fact, no single rate is good choice since the source generates traffic at different rates at different times. The ideal approach is to have a service curve [4]2 that mimics the traffic generation pattern of the source. Unfortunately, this is not a feasible since: 1) it is difficult to capture the traffic generation pattern of an arbitrary source accurately, and 2) it results in a complex service curve that is very difficult to realize using a simple scheduling mechanism. A good approximation to this ideal service policy is to model a bursty source as a multirate source that generates traffic at a few different rates over different periods of time. We can then use a service curve that resembles this approximated source. For example, we can approximate the MPEG video source described above as one that generates traffic at the peak rate over a period of time but maintains an average rate of over a period of length We show in the next section that a service curve that mimics the traffic generation pattern of this approximated source is easily realizable using a simple scheduling mechanism. In the rest of the discussion, we assume that the traffic generated by a source is passed through a shaper before entering the network. The shaper smoothes an arbitrarily bursty 1 In general, jI j; jP j; and jBj are random variables. However, it is not unreasonable to assume that jI j is larger than jP j and jP j is larger than jBj: 2 A service curve is defined as the plot of service received against time.
1134
IEEE JOURNAL ON SELECTED AREAS IN COMMUNICATIONS, VOL. 15, NO. 6, AUGUST 1997
Fig. 2. Shaping with multiple leaky buckets.
source to a multirate source that generates traffic at a finite number of different rates over different periods of time. The service curve used at the network nodes mimics the traffic envelope enforced by the shaper. Besides smoothing traffic, the shaper also plays the dual role of policing a connection so that it conforms to its advertised traffic envelope. Several shaping mechanisms enforcing different classes of traffic envelopes have been proposed in the literature. The most popular among them are leaky bucket, jumping window, and moving window [16]. In this paper, we restrict ourselves to leaky-bucket shapers only. However, the techniques developed here can be extended to moving- and jumping-window shapers also. A leaky-bucket shaper consists of a token counter and a timer. The counter is incremented by one each units of time, and can reach a maximum value A cell is admitted into the system/network if and only if the counter is positive. Each time a cell is admitted, the counter is decremented by one. The traffic generated by a leaky-bucket regulator consists of a burst of up to cells, followed by a steady stream of cells with a minimum intercell time of A single leaky bucket enforces a specific rate constraint on a source, typically a declared peak or average rate. To enforce multiple rate constraints, we can use multiple leaky buckets, each enforcing different rate constraints. For example, two leaky buckets arranged in series can be used to enforce a short-term peak rate and a long-term average rate on a source. The traffic envelope enforced by a composite leaky bucket is the intersection of the traffic envelopes of the constituent leaky buckets. In Fig. 2, a composite leaky bucket consisting of leaky buckets and is shown. The composite traffic envelope is marked by the dark line. The exact shape of the envelope depends on the number of components and the associated parameters. Inappropriate choice of shaper parameters may give rise to redundant components which may not have any role in defining the traffic envelope. For example, is a redundant component in the composite shaper shown in Fig. 2. For ease of exposition, in the rest of the paper, we assume that all traffic sources are shaped using two leaky buckets. One of the buckets monitors the short-term peak rate of the source, and the other controls the long-term average rate. So far, we have focused on characterizing traffic coming out of shapers and entering the network. The more difficult
problem is to choose appropriate shaper parameters given the characterization of the traffic source [9], [14], [17], [23]. We assume that the source is orchestrated, that is, we know the exact form of the traffic generated by the source. We characterize a traffic source as a finite sequence of tuples of the form where is the volume of data generated at time Although all traffic sources can be mapped into this model, it is particularly useful for characterizing video sources. In the rest of the discussion, we assume that ’s and ’s are all known. First, let us consider the simpler problem of choosing the parameters for a simple leaky bucket. A single leaky bucket is characterized by where is the size of the bucket and is the rate of token generation. Let us denote by the number of tokens available at time Precisely speaking, is equal to the number of tokens in the token bucket when it holds a nonzero number of tokens. When there are no equals the number of cells tokens in the token bucket, in the shaper buffer with the sign reversed (negative). That is, represents the current state of the shaper. A positive value represents a credit, and a negative value represents a debit. The following lemma expresses in terms of and the traffic arrival pattern. Lemma 2.1: Given an arrival sequence and a leaky bucket , the number of tokens (positive or negative) present at time can be expressed as
where is the sum of ’s from to Proof: We prove this by induction. Base Case: For we have which is the number of tokens in the leaky bucket at the system initialization time. Inductive Hypothesis: Assume that the premise holds for all To prove that it holds for all we need to show that it holds for
This completes the proof. If is the size of shaper buffer, to guarantee lossless shaping, we have to satisfy the set of constraints, shown at the bottom of the next page (top). This is a linear programming formulation [21] (the linear constraints), and can be easily solved when the objective function is linear. For some specific nonlinear objective functions also, the problem is solvable. This linear programming formulation can be extended to a composite leaky bucket. Assume leaky buckets such that and for We denote by the number of tokens (credit or debit) available in bucket Using the results from Lemma 2.1, we can express in terms of and the traffic arrival pattern. Let
SAHA et al.: MULTIRATE SCHEDULING OF VIDEO TRAFFIC
1135
Fig. 3. Service curve of a session.
denote the number of tokens available for the composite leaky bucket at time instant Observe that is the minimum of ’s, where Now, if is the size of the shaper buffer, to guarantee lossless shaping, we have to satisfy the set of conditions shown at the bottom of the page (bottom). Given a linear objective function, we can use commonly available solvers to find ’s and ’s satisfying the constraint set. The results derived in this section are used in Section IV to obtain the leaky-bucket parameters for PGPS that maximize the number of connections admitted, given a traffic trace. III. MULTIRATE SERVICE In this section, we discuss a scheduling mechanism to realize a multirate service curve. We also present the admission control algorithms for both guaranteed and predictive services. In general, the service curve [4] for a session can be any convex function of piecewise linear components, where each component corresponds to a different rate of service over a period of time. For simplicity, we assume that the service curve (see Fig. 3) consists of two components and where and The envelope enforces the higher rate component over a shorter time frame. envelope enforces the lower rate component The over a longer period. Observe that the service curve mimics
Fig. 4. Multirate scheduling.
the traffic envelope enforced by a dual leaky-bucket shaper
A. Scheduling Mechanism The scheduling mechanism is a generalization of timestamp-based priority scheduling. As the cells arrive, they are stamped with their expected transmission deadlines. We compute the transmission deadline of th cell of a session with a service curve as the following:
In the expressions above, is the transmission deadline of the th cell of a session that follows a service curve with slope (or rate) and an initial credit of cells. We assume that is the arrival time of the th cell, and cell transmission time is the unit of time. Similarly, is the transmission deadline
1136
IEEE JOURNAL ON SELECTED AREAS IN COMMUNICATIONS, VOL. 15, NO. 6, AUGUST 1997
Fig. 5. Architecture of the buffer manager.
of the th cell of a session that follows the service curve with rate and an initial credit of cells. We get by taking the maximum of and Note that system time is initialized to 0 at system start-up, and both and to The time-stamping algorithm is an extension to the algorithms used in virtual clock, PGPS, and SFQ. In each one of these, a session is assigned a single rate of service, say As the cells from this session arrive, they are time stamped as follows:
In the above expression, is the expected finish time of the th cell of the session, and is its arrival time. The virtual clock, PGPS, and SFQ differ in the way they assign the arrival time Now, if the service curve is a little more complex than like a simple rate curve and has a bounded burst component a leaky bucket, we can revise the time-stamping algorithm as follows:
The implication of having a burst component is that the cells, and can session starts with an initial credit of accumulate a credit of up to cells during the periods of inactivity. This credit is reflected in the time stamp as the subtractive factor Note that is the point where the service curve in Fig. 3 intersects the time axis. The service curve in our case is the composition (minimum) of two such segments, and Hence, the time stamp on the cell is the maximum of and A time stamp computed this way may be negative. We round up the negative time stamps to zero. The cells from different sessions are placed in a single queue sorted in the increasing order of their time stamps. The cells are served from the head of the queue if and only if the time stamp on the cell at the head of the queue is less than or equal to current time. In Fig. 4, we formally describe the algorithm.
B. Realization of the Scheme In this section, we outline the architecture of a buffer manager (Fig. 5) that can be used to implement the scheduling mechanisms in an output-buffered switch. It consists of a cell pool, an idle address FIFO, a connection table, and a sequencer. The cells are stored in the cell pool. The connection table stores session states of different connections. The idle address FIFO contains addresses of the current empty cell locations in the pool. The sequencer stores a tuple consisting of the buffer address and time stamp for each cell in the cell pool. The tuples are ordered in the increasing order of the time stamps. When a new cell arrives, it is stored in the cell pool at the address given by the idle address FIFO. While the cell is being stored in the cell pool, its connection (virtual channel) identifier is extracted. The connection identifier is used to retrieve the session state of the connection from the connection table. Once the session state is extracted, the time stamp for the cell is computed, and an entry consisting of the buffer address of the cell and the time stamp is inserted into the sequencer. During each transmission cycle, the tuple at the head of the sequencer is examined. If the time-stamp field in the selected entry is greater than or equal to the current time, the corresponding cell is scheduled for transmission. The cell buffer address is returned to the idle address FIFO. The most complex part of the buffer manager is the sequencer. It is a priority queue ordered in the increasing order of the time stamps. For a detailed design and implementation of the sequencer, refer to [3]. Note that any implementation of time-stamp-based scheduling such as PGPS, SFQ, or virtual clock has to use a sequencer or a similar component. The only additional complexity in our scheme is the computation of the second time stamp, which is minor compared to the length of the data path from the reception of a cell to its transmission. C. Properties of the Scheduling Algorithm In order to analyze the properties of the scheduling algorithm, we introduce the concept of a universal utilization
SAHA et al.: MULTIRATE SCHEDULING OF VIDEO TRAFFIC
1137
Fig. 6. Universal utilization curve.
Fig. 8. Buffer build-up at the switch.
Fig. 7. Updating the universal utilization curve.
curve or UUC. Informally, the UUC is the superposition of normalized service curves of all sessions assuming that they start their busy periods at the same time. It is a convex and piecewise linear function where each linear segment represents the aggregate rate of arrivals of all sessions over that period. We normalize the aggregate rate by the link speed. We represent the UUC as a sequence of tuples where and are the effective utilization3 and length of the th segment of the UUC, respectively. The utilization of one or more segments of the UUC may exceed one. However, in order for the system to be stable, the utilization of the last segment has to be less than one. Fig. 6 shows the UUC when two sessions and are active at a switching node. In this example, the UUC consists of three segments where We can compute ’s from the time axis coordinates of the points of inflection of the service curves. If is the link speed, we can compute ’s as and As connections join and leave the system, the UUC can be updated incrementally. For example, the UUC in Fig. 7 consists of three segments where When a new connection joins the system, it is updated to the new UUC shown in the figure. In this example, the new UUC has one more segment than the previous one. The new break point in the UUC coincides with the point of inflection of the service curve of the new connection. The steps involved in computing the new UUC is straightforward. All 3 We define effective utilization of the system as the ratio of aggregate rate of arrivals and rate of clearance, i.e., link speed.
segments of the UUC on the left of the point of inflection of the service curve are incremented by and all segments on the right of the point of inflection are incremented by Note that the point of inflection is at Updating of the UUC is linear in time with the number segments in the UUC which, in the worst case, is equal to the number of connections in the system. When a connection leaves the system, the UUC can be updated incrementally in a similar fashion. In the following, we present a few key results on buffer requirements and session delays. Lemma 3.1: Given the and a set of session the maximum backlog at a switching node is bounded by
where is the link speed, and Proof: The worst case backlog occurs when all sessions start their busy periods4 at the same time. The term on the right-hand side of the expression represents the buffer required to absorb the initial bursts from all the sessions. The second term corresponds to the build-up due to the mismatch between the arrival rate and the service rate. Observe that the rate of arrival into the switch is greater than the rate of departure from the switch when is greater than one. For example, in Fig. 8, buffer accumulation continues over the interval of length During this interval, the product of link speed and is more than Consequently, the shaded area under the curve is the maximum size of accumulation. Note that the rate of accumulation at any point of time is where is the utilization of the system at that point. Clearly, the summation on the right-hand side enumerates to remains the total accumulation over the duration for which above one. Lemma 3.2: Given the the maximum backlog of a session characterized by 4 The busy period of a session is defined to be the time interval during which the session is backlogged.
1138
IEEE JOURNAL ON SELECTED AREAS IN COMMUNICATIONS, VOL. 15, NO. 6, AUGUST 1997
cannot exceed
where Proof: The backlog of a session increases as long as stays over one. The session backlog reaches its highest point when the UUC changes its slope from to If the service curve of the session consisted only of the the maximum session backlog would have segment been If the service curve consisted only of the maximum session backlog would have been Since the actual service curve is the minimum of these two segments, the maximum session backlog cannot exceed the minimum of the backlogs computed using each of these segments in isolation. Lemma 3.3: Given the the maximum delay suffered by any cell belonging to a session characterized by cannot exceed
where and
is the maximum session backlog, and are such that
TABLE I CHARACTERISTICS OF THE MPEG TRACES; SIZE IS IN BYTES AND FRAME SEQUENCE IS IBBPBB
is shaped using a single leaky bucket, and is characterized by a tuple where is the burst size and is the arrival rate. In order to achieve stability, PGPS keeps the aggregate arrival rate from all sessions at all times below the link speed. Another point to note here is that the scheduler does not introduce any delay if the UUC is always less than one. Hence, we can compute the end-to-end delay of a session using Lemma 3.3 if we know the UUC’s of all the switching nodes on the path of the connection. D. Admission Control
Proof: We compute the worst case bound on delay by enumerating the time taken to clear the worst possible backlog. We compute the clearing times in two cases: 1) using service segment and 2) using service segment If we consider the service curve the maximum delay suffered by any cell is the time required to clear a backlog of The backlog is cleared only after drops below 1. Assume that is the first that is less than one. Hence, the time to clear the backlog of is equal to where is a fraction of and
Similarly we can find the time required to clear the backlog when is the service curve. The worst case delay is the minimum of the two. One of the interesting points to note here is that the aggregate rate of arrivals can exceed the link capacity for a finite length of time. The buffers in the switch are used to absorb this mismatch between the arrival and the service rates. This is an important difference between the multirate service discipline proposed and the ones that offer a singlerate guarantee. In single-rate PGPS, for example, input traffic
We discuss admission control policies for two different classes of service: 1) guaranteed service and 2) predictive service. In the guaranteed service, each session is guaranteed a certain target delay and lossless delivery of data. In the predictive service, designed for adaptive applications prepared to tolerate occasional cell losses and delay violations, a session is promised a delay target with the understanding that it may be violated at times and there may be cell losses once in a while. In the following, we discuss the admission control algorithms for each of these classes of service. Guaranteed Service: We assume that each session is characterized by The process of admitting a new connection includes three steps: 1) computing the new UUC, 2) checking that the worst case system backlog does not exceed switch buffer limit, and 3) checking that the delay bound for each connection is satisfied. In the following, we discuss each of these steps in detail. The UUC can be updated incrementally. Note that the new UUC has at most one more point of discontinuity which coincides with the point of inflection of the service curve of the new connection. Also, the value of for each segment of the curve goes up by or depending on whether the segment is on the left or on the right of the point of inflection introduced by the new connection. Using the result from Lemma 3.1, we can check if the admission of the new connection can lead to buffer overflow. As we update the UUC, we can add up for
SAHA et al.: MULTIRATE SCHEDULING OF VIDEO TRAFFIC
1139
(a)
(b)
(c)
(d)
Fig. 9. MPEG compressed video traces. Frame sequence is IBBPBB.
each segment until changes from values higher than one to less than one. Once this sum is known, checking for the buffer overflow is trivial. For the purpose of quick and easy computation, it may be worthwhile to keep the cumulative sum for each segment of the UUC. We can also along with compute the maximum backlog of each session in the same pass. These results are prerequisite to delay computation for individual sessions. We can compute the session delays using the results from Lemma 3.3. For quick computation, we can store the cumustarting from the point where lative sum of changes from values greater than one to less than one. Note that delay bounds of all the sessions can be computed in one complexity, where is the number pass, and it is of of connections. Predictive Service: In the predictive service, a session is given a loose guarantee on delay and loss. We exploit this laxity to improve network utilization and expedite admission
control checks. In predictive service, the utilization of the system is measured rather than computed. When a new flow is to be admitted, delay and buffer occupancy are estimated based on the measured utilization. In the following, we explain the procedure in detail. We measure the utilization of the system over different time scales. Let us assume that the measurement is taken over and where The three time scales measurement process counts the number of arrivals and over a period of and respectively. We and as compute the utilization of the system in and respectively. From these measurements, we can estimate the UUC as where and The measured values of and are updated every unit of time, where To be on the conservative side, we update ’s with the highest recorded in the last measurement period
1140
IEEE JOURNAL ON SELECTED AREAS IN COMMUNICATIONS, VOL. 15, NO. 6, AUGUST 1997
(a) Fig. 10.
Comparison with PGPS server—percentage improvement in number of connections admitted for the basketball trace.
(a) Fig. 11.
(b)
(b)
Comparison with PGPS server—percentage improvement in number of connections admitted for the MTV video trace.
The admission control test for a new connection, characterconsists of the following steps. ized by • Estimate the new UUC of the system after the admittance of the new flow from the current UUC and the service curve of the new connection. If the utilization of the last segment of the updated UUC is greater than one, the connection is rejected right away. • If any segment of the UUC is greater than one, we using Lemma 3.1. estimate system buffer occupancy where is a multiplicative factor less than If is the switch buffer size, the connection is one, and rejected. • Delay estimates for each connection, including the new one, are recomputed using the modified UUC and the original traffic specification of each connection.
If the delay estimate of any connection exceeds the promised/requested maximum bound, the connection is rejected. Estimation of system utilization is a very important component of the admission control algorithm. The number and the lengths of the measurement periods determine the accuracy of the measurement, and consequently impact the size of the admissible region and discrepancy between the estimated and actual delay and loss characteristics. The value of also has a significant impact on the system performance. The higher the value (less than one), the more optimistic is the admission control process. However, a higher value of also increases the risk of buffer overflows and cell losses. On the other hand, a conservative choice of reduces the chance of cells losses, but only at the cost of lower utilization.
SAHA et al.: MULTIRATE SCHEDULING OF VIDEO TRAFFIC
(a) Fig. 12.
(b)
Comparison with PGPS server—percentage improvement in number of connections admitted for the news clip trace.
(a) Fig. 13.
1141
(b)
Comparison with PGPS server—percentage improvement in number of connections admitted for the lecture trace.
IV. NUMERICAL RESULTS In this section, we compare the performance of a multirate server with that of single rate servers employing PGPS and constant bit-rate (CBR) service in providing guaranteed service. We investigate multiplexing gains of predictive service over that of guaranteed service. We also present numerical results comparing multirate and single-rate predictive services. 240 video clips (see In our study, we used four 320 Table I), each approximately 10 min long. In order to understand the effects of traffic variability on the performance of multirate service, we selected videos with different degrees of scene changes. The first video is an excerpt from a very fast scene-changing basketball game. The second clip is a music video (MTV) of the rock group REM. It is composed
of rapidly changing scenes in tune with the song. The third sequence is a clip from CNN Headline News where the scene alternates between the anchor reading news and different news clips. The last one is a lecture video with scenes alternating between the speaker talking and the viewgraphs. The only moving objects here are the speaker’s head and hands. Fig. 9 plots frame sizes against frame number (equivalently, time) for all four sequences for an appreciation of the burstiness in different sequences. In all traces, frames are sequenced as IBBPBB and the frame rate is 30 frames/s. Observe that, in terms of the size of GOP5 and that of an average frame, basketball and lecture video are at the two extremes (the largest
5 The repeating sequence (IBBPBB in this case) is called a GOP or group of pictures.
1142
IEEE JOURNAL ON SELECTED AREAS IN COMMUNICATIONS, VOL. 15, NO. 6, AUGUST 1997
(a) Fig. 14.
Comparison with CBR service—percentage improvement in number of connections admitted for the basketball trace.
(a) Fig. 15.
(b)
(b)
Comparison with CBR service—percentage improvement in number of connections admitted for the MTV video trace.
and the smallest, respectively), with the other two videos in between. Guaranteed Service: For this study, we consider a network consisting of nodes in tandem, connected by OC-3 (155 Mbit/s) links and transporting fixed-size ATM cells. Data from the source are passed through a shaper and then fed to the network. All connections traverse from the source to the sink through five switches. We assume that the end-to-end delay bound is 300 ms. The sets of graphs of Figs. 10–13 compare the number of connections admitted when PGPS is used in conjunction with a leaky-bucket shaper and multirate service is used in conjunction with a dual leaky-bucket shaper. We use results from Section II to compute the leaky-bucket parameters that maximize the number of connections admitted by the PGPS
server. The choice of shaper parameters for multirate service 0 and use the results from is bit more ad hoc.6 We pick Section II to find the minimum that guarantees lossless shaping. We use two different values for The first plot for each set (for a particular sequence) uses 1000 cells and the second plot uses 3000 cells. In each case, we find the corresponding lowest that guarantees lossless shaping. We have plotted the percentage improvement in the number of connections admitted using a multirate server over that of the PGPS server for different switch and shaper buffer sizes. We have also experimented with other values of and have
6 This is because we do not have a closed-form delay bound for multirate service, and hence we cannot use the linear programming formulation to find the optimal parameters.
SAHA et al.: MULTIRATE SCHEDULING OF VIDEO TRAFFIC
(a) Fig. 16.
(b)
Comparison with CBR service—percentage improvement in number of connections admitted for the news clip trace.
(a) Fig. 17.
1143
(b)
Comparison with CBR service—percentage improvement in number of connections admitted for the lecture trace.
observed similar improvements in the number of connections admitted. For all sequences, the smaller the shaper buffer, the larger is the improvement. A smaller buffer results in a burstier stream coming out of the shaper and entering the network. The more bursty a stream is, the more beneficial it is to use multirate service. Also observe that for all sequences, as the size of the switch buffer increases, the improvement due to using multirate service also increases. For the basketball, MTV, and CNN clips, the curve reaches a peak, and then declines as the switch buffer size increases further. For the lecture video, it keeps increasing with the size of the switch buffer. However, we have examined that it also reaches its peak at a certain buffer size (larger than the range shown in the plot) and then goes down. This behavior is also due to the fact that multirate service is more effective for bursty traffic. Initially, with an
increase in switch buffer size, the benefits of using multirate service increase since it effectively uses this buffer to multiplex the peaks and the lulls of different sessions. During the same time, the best leaky-bucket parameters for the PGPS server consist of a small burst and a large token rate. The number of connections admitted by the PGPS server is computed as the ratio of the link speed and the token rate, and a high token rate results in a small number of connections being admitted. Therefore, we observe a very sharp increase in the percentage gain. However, if the buffer size is increased even further, the advantage becomes less effective since the PGPS server uses this extra buffer to choose leaky-bucket parameters consisting of larger bursts but smaller token rates. Also note that with a higher value of the peak shifts toward the right. A higher signifies a longer peak rate segment (for multirate service).
1144
Fig. 18.
IEEE JOURNAL ON SELECTED AREAS IN COMMUNICATIONS, VOL. 15, NO. 6, AUGUST 1997
(a)
(b)
(c)
(d)
Percentage improvement in number of connections admitted, predictive versus guaranteed service.
If we analyze the results for different sequences, we observe that the improvement due to multirate service is the lowest for the lecture video. This can be explained from the fact that it is the least bursty of all the clips. Here, even with a small amount of shaper buffer, the difference between the peak and the average rate is not as much as the other more bursty clips. Consequently, the multiplexing gain is also less. Graphs in Figs. 14–17 compare multirate service with CBR service. We used the same setup as described above. For CBR service, we compute the the minimum rate of service for each video sequence for different shaper buffer sizes for lossless shaping. As in the last example, for multirate service, 0, and use the results from Section II to find we use that guarantees lossless shaping. We use the minimum The first plot for each set (for a two different values for 1000 cells and the second plot particular sequence) uses 3000 cells. In each case, we find the corresponding uses that guarantees lossless shaping. We have plotted lowest
the percentage improvement in the number of connections admitted using multirate service over that of the CBR service for different switch and shaper buffer sizes. The results shows similar characteristics as observed in the comparison between multirate and PGPS server. However, as expected, the order of improvement in the number of connections admitted by the multirate server is much larger in this case, and does not saturate for most switch buffer sizes considered in our study. Predictive Service: For this study, we consider the same network configuration used for the guaranteed case. We assume that desired end-to-end delay is 300 ms. The graphs of Fig. 18 compare the number of connections admitted for guaranteed and predictive services, both using multirate scheduling. Note that while we compute the number of connections admitted in the guaranteed case, the number of connections admitted in the predictive case is obtained through simulation. To make the comparison fair, we use results from only those simulation runs that result in zero
SAHA et al.: MULTIRATE SCHEDULING OF VIDEO TRAFFIC
Fig. 19.
1145
(a)
(b)
(c)
(d)
Percentage improvement in number of connections admitted using multirate scheduling for predictive service.
cell loss. At each switching node, we estimate the UUC by measuring utilization over three time scales, cell time, cell time, and cell time. cell time. We The measurement period is to achieve lossless vary the buffer utilization factor delivery. In Fig. 18, we have plotted the percentage improvement in the number of connections admitted in the predictive service over that of guaranteed service. We observe that for all video sequences, the improvement in the number of connections admitted increases initially with the increase in switch buffer size. For basketball, MTV video, and the news clips, the increase in improvement ceases at a certain switch buffer size. For the lecture sequence, it actually decreases with increasing buffer size. The initial increase in improvement with an increase in switch buffer size is because of the fact that predictive service effectively uses this buffer to multiplex traffic. The rate of increase is higher for the lower switch
buffer due to the fact that, during this time, the multiplexing gain is hardly exploited by the deterministic scheme. However, as the buffer size keeps increasing, so does the number of connections, and ultimately the multiplexing gain tapers off. At this point, the number of connections admitted in both guaranteed and predictive services becomes (more or less) constant (at different values, of course). The decrease in the percentage improvement for the lecture sequence comes as a bit of surprise. This is because the lecture video is quite smooth to start with. Therefore, as the buffer in the switch increases, the deterministic policy can do much better in exploiting multiplexing gain than for the other bursty clips. With the increase in buffer size, the multiplexing gain achieved by both the schemes becomes comparable, and the gain starts to fall (note that the absolute number of connections admitted by the predictive scheme is more than a factor of two higher than that of the the deterministic scheme at all times).
1146
IEEE JOURNAL ON SELECTED AREAS IN COMMUNICATIONS, VOL. 15, NO. 6, AUGUST 1997
The next set of graphs (Fig. 19) compares the number of connections admitted using multirate and single-rate predictive service. We used the same experimental setup and the same set of traffic parameters as used in the comparative study of the multirate and PGPS servers for guaranteed service. The only difference is in the admission control algorithm. We used the measurement-based admission control algorithm with 50 cell time, 250 cell time, and 500 cell time. The measurement period is 1000 cell time. We vary the buffer utilization factor to achieve lossless delivery. We plot the percentage improvement in the number of connections admitted using multirate service over that of single-rate service. When the switch buffer size is in the range of 100–500 cells, we get 100–200% improvement for all sequences. However, with increasing buffer size, the improvement due to multirate service goes down and stabilizes at around 50%. From the results presented in this section, we make the following conclusions. • For guaranteed service, the multirate server outperforms the single-rate PGPS server. Multirate scheduling is more effective for bursty traffic. • The benefits of using multirate scheduling goes down as the buffering in the switch increases. Note, however, that most of the currently available switches use no more than couple of hundred cells of buffer per port. Due to space and power limitations on the switch wafer, this number is not expected to increase dramatically in the near future. In this operating range, the benefits of multirate scheduling are very significant. • If hard guarantees on service quality is not a requirement, predictive service can be used to improve system utilization significantly. For typical switches currently available, multirate scheduling far outperforms single-rate scheduling.
V. CONCLUSION We have proposed a multirate service mechanism for ATM networks that is particularly suitable for transporting VBR video traffic. We have shown how this multiplexing mechanism can be effective in providing both deterministic and empirical service guarantees. The major contributions of this paper are as follows. • A scheduling mechanism that can provide different rates of service at different times. It is particularly suitable for bursty traffic, such as VBR video. • We have shown that multirate scheduling can outperform PGPS in terms of the number connections admitted while maintaining the same level of service guarantees. Our experiments with video traces demonstrate that multirate scheduling can be very effective for VBR video traffic. • We have shown that by relaxing the service guarantees and using a measurement-based admission control process, we can improve the system utilization significantly. Our experiments using real-life video traces demonstrate that we can achieve a factor of two
improvement in utilization with almost no degradation in service quality. This study can be extended in many ways. In the predictive mode of service, the number and the lengths of measurement intervals have a profound impact on the stability and the utilization of the system. We are currently in the process of analyzing these interactions. Another interesting direction for future work is to apply multirate scheduling for data traffic. For example, it can be used to provide short response times to telnet sessions by reserving a high peak rate for a short duration and low average rate. The ftp sessions, on the other hand, can be optimized for throughput by reserving a relatively higher average rate of service, and a peak rate that is the same as or close to the average rate. REFERENCES [1] C. M. Aras, J. F. Kurose, D. S. Reeves, and H. Schulzrinne, “Real-time communication in packet-switched networks,” Proc. IEEE, vol. 82, Jan. 1994. [2] S. Keshav, C. R. Kalmanek, and H. Kanakia, “Rate controlled servers for very high speed networks,” in Proc. IEEE GLOBECOM, Dec. 1990. [3] H. J. Chao, “Architecture design for regulating and scheduling user’s traffic in ATM networks,” in Proc. SIGCOMM, Aug. 1992. [4] R. L. Cruz, “Quality of service guarantees in virtual circuit switched networks,” IEEE J. Select. Areas Commun., vol. 13, Aug. 1995. [5] L. Georgiadis, R. Guerin, and A. Parekh, “Optimal multiplexing on single link: Delay and buffer requirements,” in Proc. IEEE INFOCOM, June 1994. [6] L. Georgiadis, R. Guerin, V. Peris, and K. N. Sivarajan, “Efficient network QoS provisioning based on per node traffic shaping,” in Proc. IEEE INFOCOM, Mar. 1996. [7] S. J. Golestani, “A framing strategy for congestion management,” IEEE J. Select. Areas Commun., vol. 9, Sept. 1991. [8] , “A self-clocked fair queuing scheme for broadband applications, in Proc. IEEE INFOCOM, June 1994. [9] F. Guillemin, C. Rosenberg, and J. Mignault, “On characterizing an ATM source via the sustainable cell rate traffic descriptor,” in Proc. IEEE INFOCOM, Apr. 1995. [10] S. Jamin, P. Danzig, S. Shenker, and L. Zhang, “A measurement-based admission control algorithm for integrated services packet networks,” in Proc. SIGCOMM, Oct. 1995. [11] E. W. Knightly, “H-BIND: A new approach to providing statistical performance guarantees to VBR traffic,” in Proc. IEEE INFOCOM, Mar. 1996. [12] E. W. Knightly and H. Zhang, “Traffic characterization and switch utilization using a deterministic bounding interval dependent traffic model,” in Proc. IEEE INFOCOM, Apr. 1995. [13] D. Legall, “MPEG—A video compression standard for multimedia applications,” Commun. ACM, vol. 34, no. 4, 1991. [14] B. L. Mark and G. Ramamurthy, “Real-time estimation of UPC parameters for arbitrary traffic sources in ATM networks,” in Proc. IEEE INFOCOM, Mar. 1996. [15] A. K. Parekh and R. G. Gallager, “A generalized processor sharing approach to flow control in integrated services network: The single node case,” IEEE/ACM Trans. Networking, vol. 1, June 1993. [16] E. Rathgeb, “Modeling and performance comparison of policing mechanisms for ATM networks,” IEEE J. Select. Areas Commun., vol. 9, no. 3, 1991. [17] A. R. Reibman and A. W. Berger, “Traffic descriptors for VBR video teleconferencing over ATM networks,” IEEE/ACM Trans. Networking, vol. 3, June 1993. [18] D. Reininger, D. Raychaudhuri, B. Melamed, B. Sengupta, and J. Hill, “Statistical multiplexing of VBR MPEG compressed video on ATM networks,” in Proc. IEEE INFOCOM, 1993. [19] J. L. Rexford, A. G. Greenberg, and F. G. Bonomi, “Hardware-efficient fair queueing architecture for high-speed networks,” in Proc. IEEE INFOCOM, Mar. 1996. [20] D. Saha, S. Mukherjee, and S. K. Tripathi, “Carry-over round robin: A simple cell scheduling mechanism for ATM networks,” in Proc. IEEE INFOCOM, Mar. 1996. [21] J. K. Strayer, Linear Programming and Its Applications. Berlin, Germany: Springer-Verlag, 1989.
SAHA et al.: MULTIRATE SCHEDULING OF VIDEO TRAFFIC
[22] S. Suri, G. Varghese, and G. P. Chandranmenon, “Leap forward virtual clock: An (log log ) fair queuing scheme with guaranteed delays and throughput fairness,” Dept. Comput. Sci., Washington Univ., St. Louis, MO, Tech. Rep., 1996. [23] D. E. Wrege and J. Liebeherr, “Video traffic characterization for multimedia networks with a deterministic service,” in Proc. IEEE INFOCOM, Mar. 1996. [24] H. Zhang and D. Ferrari, “Rate controlled static priority queuing,” in Proc. IEEE INFOCOM, 1993. [25] L. Zhang, “Virtual clock: A new traffic control algorithm for packet switching networks,” in Proc. IEEE SIGCOMM, 1990.
O
N
Debanjan Saha was born on October 3, 1969. He received the B.Tech. degree in computer science and engineering from the Indian Institute of Technology, Kharagpur, in 1990, and the M.S. and Ph.D. degrees in computer science from the University of Maryland, College Park, in 1992 and 1995, respectively. He is currently with the Communications Systems Division, IBM T. J. Watson Research Center, Yorktown Heights, NY. His research interests include high-speed networking, multimedia applications, and real-time systems.
Sarit Mukherjee received the B.Tech. degree in computer science and engineering from the Indian Institute of Technology, Kharagpur, in 1987, and the M.S. and Ph.D. degrees in computer science from the University of Maryland, College Park, in 1990 and 1993, respectively. Currently, he is an Assistant Professor in the Department of Computer Science and Engineering, University of Nebraska, Lincoln. His research interests include high-speed network architectures and protocols, multimedia applications, modeling, and performance evaluation. Dr. Mukherjee is a member of the IEEE Communications Society and ACM SIGCOMM.
1147
Satish K. Tripathi (M’86–SM’86–F’97) attended the Banaras Hindu University, the Indian Statistical Institute, the University of Alberta, Edmonton, Alta., Canada, and the University of Toronto, Toronto, Ont., Canada. He received the Ph.D. degree in computer science from the University of Toronto in 1978. From 1978 to 1996, he was on the faculty of the Department of Computer Science, University of Maryland, College Park. He served as the Department Chair during 1988–1995. He is currently the Johnson Chair Professor and the Dean of Engineering, University of California, Riverside. For the last 20 years, he has been actively involved in research related to performance evaluation, networks, real-time systems, and fault tolerance. He has published more than 100 papers in international journals and refereed conferences. In the networking area, his current projects are in mobile computing, ATM networks, and operating systems. Dr. Tripathi has served as a member of the Program Committee and Program Chairman for various international conferences. He has guest edited special issues of many journals, and serves on the editorial boards of Theoretical Computer Science, Multimedia Systems, IEEE TRANSACTIONS ON COMPUTERS, and IEEE/ACM TRANSACTIONS ON NETWORKING. He has edited books on performance evaluation and parallel computing, and has authored a book on multimedia systems.