connection admission control and the monitoring of traffic generated by ..... inserted can be calculated (allocated bandwidth, free transmission capacity and ...
Neural Networks in B-ISDN Flow Control: ATM Traffic Prediction or Network Modeling? Joaquim E. Neves, M´ ario J. Leit˜ ao, and Lu´ıs B. Almeida
The combination of shared bandwidth and rejection rate parameters, together with the quality of service predicted by neural networks in a novel strategy for connection admission control and call routing.
The Broadband Integrated Service Digital Network (B-ISDN), which uses the Asynchronous Transfer Mode (ATM) technique based on fixed length packets called cells, requires complex flow control mechanisms to support narrow and broadband services. Since the communications networks based on synchronous time division multiplexing provide a quality of service independent of the load, the flow control mechanisms only need to reject the new connections when no resources are available. On the other hand, in packet based data networks, since the quality of service is load dependent, the flow control acts on the packet stream to guarantee a minimum quality of service. The B-ISDN requires a connection establishment phase within which the user and the network negotiate the quality of service of the connections which support the call, with some parameters being established on a probability basis, due to the competitive nature of the network. This implies that the control mechanisms must cover a wide variety of complex functions and the traditional analytical models become intractable. The application of neural networks and other artificial intelligence techniques is being recommended by many authors to implement a number of control functions in the B-ISDN. After the first work in this area presented in [1], many other publications in the last years have proposed feedforward or recurrent neural networks for applications such as connection admission control and call routing, service coding and traffic prediction, routing cells in spatial and temporal switches, policing functions of the usage parameters and selective cell discard, fault detection and network management. This paper discusses the use of neural networks for flow control applications. The simulation models of ATM traffic sources and B-ISDN components are briefly described and, based on these models, the traffic parameters are shown to be adequately predicted by neural networks. This capability is the basis of a novel technique for connection admission control and call routing which is also described. With this technique the admission decision is made according to the prediction of a few quality of service parameters expected for the new connections.
Why Neural Networks in B-ISDN Flow Control? The flow control functions in ATM networks include preventive and reactive actions. The connection admission control and the monitoring of traffic generated by users are examples of preventive actions, while the discarding of lower priority cells and some other congestion control mechanisms are included in the reactive actions. The B-ISDN control entities should also incorporate mechanisms for usage parameter control by policing the traffic generated by the calls at user interfaces and taking appro-
1
priate actions if the values of the information flow violate the negotiated quality of service parameters. This task can be carried out by neural networks trained to perform the traffic prediction in the access interfaces. For instance, in [2] a technique is described using two feedforward neural networks to perform the policing, in the access interfaces, of the peak and the average bit rates of the traffic sources. To perform congestion control functions some sort of network modeling is needed. As an example, for the generation of a pre-congestion indication to be used by the network to discard non-priority cells or by the user to reduce the rate of cell generation, the control entity may incorporate neural networks trained to model the behavior of B-ISDN components. The knowledge of ATM traffic profiles inside the network is a pre-requisite for the connection admission control. Since the acceptance of a connection should guarantee the quality of service negotiated, without affecting already established connections, traffic prediction is an essential step that must be supported by a suitable model for B-ISDN components. As it will be shown, neural networks can also perform this task in a convenient way. As the ATM traffic and the behavior of B-ISDN components are nonlinear and complex in nature, artificial neural networks are more suitable than analytical techniques to carry out control functions. They not only lead to a high flexibility, allowing the satisfaction of specific service needs in the user and network operator perspectives, but are also very efficient to optimize the resource allocation under high network load conditions. However, the inclusion of neural networks increases the complexity of the flow control implementation and requires a training phase before operation. Moreover, when the total amount of traffic does not load significantly the broadband network components, the use of neural networks can even be disadvantageous because very simple and fast flow control procedures can be more appropriate than any optimized but more complicated mechanism.
Simulation Models The implementation of control procedures using neural networks requires traffic patterns for training. These should ideally be taken from a real operating communications network in different traffic situations. As the B-ISDN is not available yet, the use of real time simulation models for ATM traffic and network components is unavoidable, and the reliability of the results is strongly dependent on the accuracy of such models.
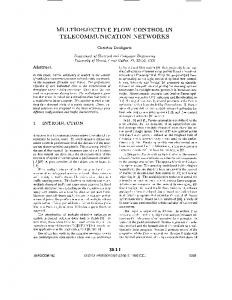
ATM Traffic Most of the simulation results reported in the literature are obtained by ATM traffic models characterized by two alternating states with exponentially distributed durations. The cells are generated during the active state at constant (peak) rate, while in the silent state no cells are generated. This model is used both in analytical and in real time simulations. Because the state durations are exponentially distributed in this model, the number of cells generated in the active state is also exponentially distributed. Due to a high number of states of short duration and a small number of states of longer duration, and also due to the discrete nature of the cell generation process, the average and the peak cell rate observed in the traffic produced by this model deviate from the values obtained from the analytical law, especially when the average state duration becomes short compared to the interval between consecutive cells. The parameters of the model are only valid if the average peak duration is at least ten times greater than the time between cells; but even in this case, the model is quite limited because it is too simplistic and incapable of simulating bursty sources. To overcome the drawbacks of the traffic models with exponentially distributed state durations, the model presented in [3] defines three functional levels to control the generation of the ATM traffic at B-ISDN user network interfaces. The relationship between these levels is presented in figure 1. The generation level characterizes a set of timing relationships of the information flow variations for any traffic source, which in this model are defined in a Markovian state space. Since in B-ISDN the information flow events can be connection requests or the generation of ATM cells, each ATM traffic source will be actually defined by two Markovian state
2
spaces. The discipline imposed by the state transition probability matrix determines the time evolution of staying or leaving a traffic state. The quantum duration of each state and the probability distribution functions of the event duration and the time between events are the specific parameters of each traffic state. Although the quantum duration of each state is a deterministic parameter, the time that the traffic source stays in each state is in general stochastic with a geometric distribution. The synchronization level incorporates the timing characteristics of the environment, which include the discrete nature of the generation entities. This level introduces the network cell clock to synchronize all events. The adaptation level acts as a finite length buffer for the events provided by the generation level and performs a low pass filter function. This level guarantees, at the B-ISDN user network interface, the peak cell rate negotiated at the establishment of the connection and affects other characteristics, such as the burstiness; if disabled, it allows to introduce violations of peak parameters by the traffic sources. The number of expected call connections and the average cell rate can be analytically calculated by this model, independently of the probability distribution functions within each traffic state. Although this traffic model is in general stochastic, it can generate deterministic traffic or deterministic components of stochastic traffic. Simulations support the adequacy of this model to generate broadband ATM traffic.
B-ISDN Components The deployment of broadband ATM networks requires major efforts in studies and field trials, with the aid of simulation tools which contribute to provide a better view of the complex network mechanisms. The cell transmission function in B-ISDN is responsible for cell loss due to errors in the transmission links and their effects in the cell delineation process, and introduces propagation delay proportionally to the distance between the endpoints. In the switching nodes the inputs share common resources, creating the possibility of increased total delay and delay variation, due to accumulation of cells in buffers in high load conditions. In the limit, if overflow is reached, cell loss will occur. A suitable B-ISDN simulation model has been proposed [4] incorporating the previously indicated traffic effects in its network components. According to this model, B-ISDN components are Switching Nodes and Transmission Links, modeled by buffers in which the cells are always read by a first in first out (FIFO) discipline. As sketched in figure 2, each node or link is characterized by the following parameters: Buffer Length, Throughput Capacity, Cell Loss Rate and Minimum Delay. Specific nodes generating calls incorporate a set of parameters to control the generation of the connections and the cells of each ATM service, according to the traffic model mentioned in the previous section. The main network simulation procedures regarding the user traffic are connection and cell generation and cell transfer, while the procedures relevant to network control are connection admission and call routing. Switching nodes can be connected, without restrictions, by transmission links, to obtain any desired network topology. In each switching node there is a routing table which points, for each connection, to the outgoing link of the call path, while in each transmission link, the routing table only points to the link destination node. All nodes and links can monitor the actual traffic load and its relevant statistics, namely the number of active calls and connections of each service, the buffer occupation, the delay and the cell loss rate. Reports dealing with variables are evaluated over short, medium or long time intervals.
Traffic Prediction Based on B-ISDN Modeling Many flow control mechanisms require the prediction of traffic statistics, in order to provide faster and more accurate control actions to avoid the effects of excessive load situations. The prediction of traffic parameters within the switching nodes and transmission links can be made using analytical models for the traffic sources and B-ISDN components, or by
3
processing samples of the traffic parameters observed on these components. Since the prediction by analytical techniques is usually based on convolution operations, which become very complex for realistic traffic and network models, it is preferable to perform the prediction by processing the traffic parameters, which can be easily done by neural networks.
Neural Network Architecture Any neural network paradigm suitable for supervised training could, in principle, be used to model the B-ISDN components and to predict the ATM traffic parameters. Among the supervised training paradigms, multilayer perceptrons (MLPs) are the most frequently used, since they usually yield the simplest and most accurate solutions. Other paradigms (e.g. radial basis function networks) are normally used only when MLPs present limitations. Usually the main limitation is an excessively long training time. As discussed in [5], a fully connected feedforward neural network with a layered topology is suitable for predicting the ATM traffic parameters in the switching nodes and in the transmission links, with a reasonable training time. The neural network must have at least one hidden layer and the neurons of each layer can be connected by synapses to any neuron of the contiguous layers. A linear activation function is recommended for the neurons of the output layer and several activation functions are suitable for the neurons of the input and hidden layers, as discussed later. Figure 3 presents the block diagram of the neural network training in real time, for modeling the behavior of a B-ISDN component, in order to perform the prediction of ATM traffic parameters. The sampling of the outputs is delayed from the instants in which the input traffic variables are measured. The value of this delay, which corresponds to the prediction time, must be chosen according to the B-ISDN operation environment. For instance, to predict cell loss rate, delay and delay variation, the prediction time needs to be of the same order of magnitude as the time constants of the traffic sources and the measurement window of these parameters.
Neural Network Training The training of the neural network can be carried out with traffic patterns sampled from the results of the simulations performed by the previously described ATM traffic and B-ISDN models, without any flow control mechanism in operation. The variables of the training patterns have to be chosen according to the requirements of the flow control procedure. As an example, if the bandwidths allocated to the connections of different types of services are used as the input traffic variables for call control purposes, as in the case presented later in this paper, then each training pattern consists of an input vector with these variables and an output vector with traffic parameters observed in those nodes or links. For training the neural network, the backpropagation algorithm can be used with adaptive learning rate parameters [6] and with the sum of squared errors over the training patterns as cost function. According to the adaptive learning rate technique, in every pair of consecutive epochs, if the derivative of the cost function relative to neural network weight changes sign, the respective learning rate parameter is reduced by a small amount; otherwise it is increased. After the training phase which, according to executed tests, can usually take only a few hundreds of epochs for some thousands of training patterns, the neural network can be used in the normal operation of the B-ISDN. Simulation results show that, irrespective of the network topology and of the number of neurons in the hidden layer, symmetric activation functions, such as the hyperbolic tangent and the inverse tangent, present much better accuracy than asymmetric functions such as the logistic. As shown in figure 4, the relative error observed after some tens of training epochs in neural networks with the inverse tangent and with the hyperbolic tangent activation functions decreases to approximately 10% of the initial value, which is almost half of the error observed in neural networks with the logistic activation function. It is not difficult to obtain neural networks that generalize well the behavior of a B-ISDN component to other traffic patterns that have not been present in the training phase, pro-
4
vided that some care is taken to ensure that the training patterns are statistically significant. In the case of the proposed neural network, tests made with a different set of patterns have shown that the relative error is very close to the error with the training set.
Call Control Because of the statistical nature of ATM traffic, the resource allocation in B-ISDN must be related both to the traffic parameters and to the quality of service negotiated between the user and the network at the establishment of each call. The user has to specify the traffic characteristics of the connections and the requested quality of service. On the other hand, the network control entity can accept the request and allocate network resources for the support of the service, propose alternatively a lower quality of service, or in the limit, reject the connection, if enough network resources are not available.
Connection Admission Most of the published connection admission criteria allocate resources based either on the availability of bandwidth effectively necessary to guarantee the negotiated quality of service, or on the prediction of the values of the quality of service parameters expected for a given allocated bandwidth. Since it is difficult to estimate those parameters for realistic models of the ATM traffic and the B-ISDN components, some simplifications are usually introduced. The initial approaches were based on the use of the peak or average cell rate as basic admission criteria. A more elaborated method introduced the concept of equivalent capacity [7] which gives a value between the peak and average, depending on the type of traffic and desirable maximum cell loss rate. However, the method has several shortcomings since the equivalent capacity parameter is calculated assuming a simplistic traffic model with two alternating states. A new strategy for call admission control has been recently proposed [5], which manages the competitive access of new connections related to different services, and considers quality of service objectives established in terms of time and semantic transparency. As this technique requires traffic prediction, the call control unit inquires neural networks associated to each node and link of the path to decide the admission of each new connection. This method defines a quality of operation function as a measure of network performance. This function can be quantified and applied both to the whole network or to some of its parts, using a set of traffic variables weighted by control parameters, which are set according to the operational objectives of the services, grouped in classes with common characteristics. The values of these parameters are currently constant but it is not excluded the use of adaptive parameters during the operation of the B-ISDN in different traffic situations and operation scenarios. To manage the competitive access of new connections belonging to different classes of services, the quality of operation function incorporates as variables the allocated bandwidth, the free transmission capacity and the connection rejection rate. The time and semantic transparency variables incorporated in the quality of operation are cell loss rate, delay and delay variation. The decision to accept or reject a new connection is based on the expected quality of operation, with and without the inclusion of the new connection, in each node and link of the path. The basic philosophy is that a new connection is accepted if it increases the quality of operation (e.g. increasing the allocated bandwidth without any large increase of delay and cell loss). Figure 5 sketches the block diagram of the connection admission control mechanism. When a node or link is asked to allocate resources to a connection, the quality of operation variables related to connections already established are known to its control entity. The variables that are related to the traffic that will be generated if the new connection is inserted can be calculated (allocated bandwidth, free transmission capacity and connection rejection rate) or predicted by the neural network (quality of service variables). The quality of operation can then be computed with and without the inclusion of the new connection.
5
Finally, the resources are allocated to the call if the expected quality of operation in every B-ISDN node and link of the call route is higher with the new connection than without it.
Call Routing When a call has alternative routes available, the cost or quality function of the routing algorithm may be based on the quality of operation function. A linear combination of the quality of operation values expected for each node and link of the call path is a suitable routing quality function. This has the advantage of allowing a fast adaptation to the network load fluctuations, since the routing decision is based on the prediction of the traffic parameters when the connections of the new call will be effectively active, as opposed to other methods which adopt a cost function of the past samples of traffic parameters. The values of the quality of operation control parameters for the routing processing are not generally the same as those used in connection admission control. For instance, the allocated bandwidth variable is essential for the connection admission decision, but if its control parameter was included in the routing quality function with considerable weight, the routing of each call would have a tendency to follow the more loaded nodes and links. If the number of alternative routes and the number of nodes of each route is small, the best path of each call can be found in real time for each call; otherwise the best routing can be determined periodically and all calls within the same time interval follow the established route.
Simulation Results The tests carried out show that this new admission control technique based on the quality of operation and the use of neural networks presents, for a variety of load situations, better results than other methods based on the bandwidth requested for each call, such as the peak and average cell rate or on the equivalent capacity. A simulation illustrating this comparison is presented next, for the case of a single node with throughput capacity of 155 520 kbit/s and a buffer length of 100 cells. Three service classes (SC.1, SC.2 and SC.3) were considered, loading the node during 4 hours of operation. For simplicity, it was assumed that each call was supported on a single connection. The generation of connections and cells was controlled by a set of probability parameters, according to the previously presented ATM traffic model. To simulate several network load conditions, the connection generation processes had one silence state without connection generation and one active state with exponentially distributed times between connections with averages of 3, 9 and 60 seconds, respectively for the service classes SC.1, SC.2 and SC.3. The quantum duration of both states was 25 minutes and the transition probability between states was 70%. The duration of the connections was exponentially distributed with an average of 35 minutes for all service classes, which is a value long enough to reach overflow situations if all connections were accepted. The cell stream was also generated by Markovian state processes with different number of states and control parameters for each service class, leading to the cell rates presented in table 1 (the equivalent capacities are given for cell loss rates of 10−8 , according to [7]). Service classes SC.1, SC.2 and SC.3 represent respectively services with high burstiness and low average bit rate, small burstiness and medium average bit rate and high constant bit rate. Figure 6 shows the average allocated bandwidth used by the connections, for the above mentioned admission methods. It can be seen that, with the allocation by the first three methods (i.e. the average cell rate, the peak cell rate and the equivalent capacity), the service class with smallest requested bandwidth (average, peak and equivalent bandwidth, respectively) dominates the competition for network resources, especially during the significantly loaded periods. With the proposed technique based on the quality of operation, all the service classes share the available resources even when demand is higher. Each allocation method has a different impact on the quality of service parameters. With the average allocation method, a full buffer occupation can easily be reached, which implies that the cell loss rate becomes high. In contrast, and as expected, tests have shown that
6
with the peak allocation method the buffer is always lightly loaded and the node capacity is poorly utilized. Regarding the equivalent capacity method, although the buffer utilization lies between the previous methods, its application is limited to simplistic traffic models, and the fact that the allocation is indirectly controlled by only one parameter (cell loss rate) implies that it does not allow a good control over other quality of service parameters, such as delay. With the proposed quality of operation technique, the load in the node does not suffer from any of the problems of the other methods. Moreover, the competition to access the network resources by the calls generated from different service classes as well as the time and semantic transparency associated to the cell stream can be controlled in advance by the parameters of the quality of operation function.
Summary This paper has discussed preventive and reactive actions for flow control of broadband networks, and the possibility of implementing these functions using neural networks. An ATM traffic model has been described in which the connections and cells associated to different services and users are generated by Markovian processes with variable state duration. Within each state, the event duration and the time between event births are defined by suitable distribution functions. It has also been presented a model of the main B-ISDN components which together with the traffic model allows the simulation of network operation. It has been shown that many flow control mechanism require traffic prediction which can be done by neural networks trained to model the behavior of B-ISDN components. During the simulation in different traffic situations, patterns of the traffic load in nodes and links are collected to be used as training patterns of neural networks, for prediction of the quality of service parameters of new connections. The concept of quality of operation has been introduced as an overall B-ISDN quality function which can be used as a decision criterion to control the resource allocation to ATM call connections. When a node or link is requested to allocate resources to a call, its control entity evaluate the quality of operation for admission control and for routing purposes. Call acceptance is based on the neural network response regarding the expected increase in the quality of operation, in every component of an available call path.
Bibliography [1] A. Hiramatsu, “ATM communications network control by neural networks,” IEEE Transactions On Neural Networks, vol. 1, no. 1, pp. 122-130, Mar. 1990. [2] A. A. Tarraf and I. W. Habib, “A novel neural network traffic enforcement mechanism for ATM networks,” IEEE Journal on Selected Areas in Communications, vol. 12, no. 6, pp. 1088-1096, Aug. 1994. [3] J. E. Neves and M. J. Leit˜ao, “A markovian model for ATM traffic generation,” in IEEE - Malaysia International Conference on Communications - MICC 93, (Kuala Lumpur), Nov. 1993. [4] J. E. Neves and M. J. Leit˜ao, “Modeling of B-ISDN for performance simulation of ATM services,” in International Symposium on Modular Information Systems and Networks ICSNET 93, (St. Petersburg, Russia), Sept. 1993. [5] J. E. Neves, L. B. Almeida, and M. J. Leit˜ao, “B-ISDN connection admission and routing strategy with traffic prediction by neural networks,” in SUPERCOMM-ICC 94, (New Orleans, LA, USA), May 1994. [6] F. M. Silva and L. B. Almeida, “Acceleration techniques for the backpropagation algorithm,” in Neural Network EURASIP Workshop Proceedings, Springer-Verlag, 1990. [7] R. Gu´erin, H. Ahmadi, and M. Naghshineh, “Equivalent capacity and its application to bandwidth allocation in high-speed networks,” IEEE Journal on Selected Areas in Communications, vol. 9, no. 7, pp. 968-981, Sept. 91.
7
Biographies Joaquim E. Neves was born in Guimar˜ aes, Portugal, in March 5, 1961. He was graduated in Electrical Engineering by the Faculdade de Engenharia da Universidade do Porto, in 1985. He is presently finishing his Ph.D. thesis on the application of Neural Networks to the BISDN Flow Control. Since 1985 he has been with INESC, where he was involved in R&D Projects on the area of high-speed communication networks. In 1987 he has been in CERN (Switzerland), where he worked within the FASTBUS Development Group. He is also a lecturer at the Universidade do Minho, since 1990.
M´ario J. Leit˜ao was born in Porto, Portugal, in May 15, 1954. He was graduated in Electrical Engineering by the Faculdade de Engenharia da Universidade do Porto in 1976 and obtained a Ph.D. by the University of Bradford in 1984 with a dissertation on prediction of attenuation effects on satellite links. He has authored two papers in this area which received the Marconi and J. J. Thomson IEE awards. Since 1976 he has been with the Faculdade de Engenharia do Porto, where he is now assistant professor. He has joined INESC in 1985 where he has been responsible for several R&D projects in broadband networks. He has also been Director of INESC from 1989 to 1995.
Lu´ıs B. Almeida was born in Lisbon, Portugal in April 15, 1950. He graduated in Electrical Engineering by the Instituto Superior T´ecnico, Lisbon, in 1972, and obtained a ”Doutor” degree by the Universidade T´ecnica de Lisboa, in 1983, with a thesis on nonstationary modeling of voice speech. Since 1972 he has been with the Instituto Superior T´ecnico, where he presently is a full professor. Since 1984 he has been head of the Neural Network and Signal Processing Group of INESC. He has authored a large number of scientific papers, one of which was awarded the ”IEEE Signal Processing Area ASSP Senior Award”.
8
Generation
Generation
Connections
Connections
Cells
Synchronisation
Cells
Adaptation
Adaptation
B-ISDN Acess Interface
Figure 1: Relationships between the traffic in the B-ISDN interface and the generation of connections and cells by ATM traffic sources.
9
Cell
Call Control Parameters
Buffer Length Throughput Capacity
Routing Table
Cell Loss Rate
Traffic Statistics
Minimum Delay
Cell
Figure 2: Simulation model of the B-ISDN switching nodes and transmission links.
10
Cell
Call Control Parameters
Buffer Length
Traffic Variables
Throughput Capacity
Routing Table
Cell Loss Rate
Traffic Statistics
Minimum Delay
Cell
Traffic Parameters
Switching Node or Transmission Link
∑
Delay
Backpropagation 1 1
.. . .. i .
+ -
...
i-1
1
.. .
i
H
I
i+1
Feedforward Neural Network
.. .
O
Figure 3: Simulation model of the B-ISDN components and neural network training for prediction of the ATM traffic functions.
11
Neural Network Training Error
1.
Normalised Quadratic Error
By Three Activation Functions
Logistic
Arc Tangent
0.1 Hyperbolic Tangent
250
1250
2500
Training Ephoc
Figure 4: Average error observed during the training phase of three neural networks with different activation functions: logistic, inverse tangent and hyperbolic tangent.
12
Bandwidth Variables
Connection Request
Admission Decision
Rejection Rates
Resource Allocation
Time and Semantic Transparency
Quality of Operation
Figure 5: Block diagram of the connection admission control with admission decision based on the quality of operation.
13
Table 1: Main characteristics of the traffic sources used in the simulations reported in figure 6.
Traffic Variable (kbit/s)
Service Class
Average Cell Rate
Equivalent Capacity
Peak Cell Rate
SC.1 SC.2 SC.3
680 1 590 8 480
856 1 735 8 480
4 240 2 120 8 480
14
1.5 Bandwidth Allocated by
Bandwidth Allocated by
Average Cell Rate
Peak Cell Rate
1
Normalized Bandwidth
Normalized Bandwidth
1.5
SC.1
0.5
1
0.5
SC.2
SC.2
SC.1 SC.3
0
0 0
4.
2.
SC.3
0
Time (Hours)
1.5
1.5 Bandwidth Allocated by
Bandwidth Allocated by
Equivalent Capacity
Quality of Operation
1
Normalized Bandwidth
Normalized Bandwidth
4.
2.
Time (Hours)
SC.1
0.5
1 SC.2
0.5
SC.3
SC.2 SC.1
0
0
SC.3
0
2.
4.
0
Time (Hours)
2.
4.
Time (Hours)
Figure 6: Mean bandwidth (normalized to the throughput capacity) allocated to three service classes by the average cell rate, peak cell rate, equivalent capacity and quality of operation methods.
15