loss probabilities, cell and message delay jitter distributions, and the number of cells brought to destination that ... with the traffic contract between the user and the network. Preventive UPC is ...... of COST 242, Cam- bridge, UK, January 1995.
7 SIMULATION OF TRAFFIC SHAPING ALGORITHMS IN ATM NETWORKS* M.Ajmone Marsan a , T.Y.Dob, L.Jereb b, R.Lo Cigno·, R.Pasqualia, A.Tonietti C • Dipartimento di Elettronica, Politecnico di Torino, Corso Duca degli Abruzzi 24, 10129 Torino - Italy Department of Telecommunications, Technical University of Budapest, Sztoczek 2, 1111 Budapest - Hungary
b
C
CSELT, Yia G.Reiss Romoli 274, 10148 Torino - Italy
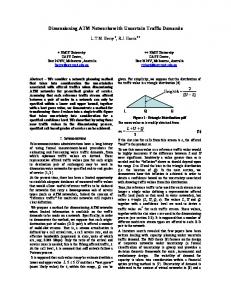
Simulation is used to investigate and compare the impact of two different traffic shaping policies on the quality of connectionless services in two ATM network topologies with various levels of traffic load. The first topology is asymmetric and bicentric, and is a possible candidate for an Italian ATM network. The second topology is symmetric and monocentric, and is a possible candidate for a Hungarian ATM network. The performance parameters collected during the execution of simulation runs comprise cell and message loss probabilities, cell and message delay jitter distributions, and the number of cells brought to destination that must be discarded because some other cells of the same message were lost. Keyword Codes: C.2.1; 1.6.3; 1.6.5 Keywords: Computer-Communication Networks, Architecture and Design; Simulation and Modelling, Applications; Model Development 1. Introduction
The quality of service (QOS) requirements in Broadband Integrated Services Digital Networks (B-ISDNs) are very tight, both for connection-oriented (CO) and connectionless (CL) services. QOS requirements are mainly expressed in terms of cell loss probability and cell delay jitter. The former is more important for the majority of CL services, but the latter is crucial for many CO services. Many performance analyses of B-ISDN have shown that acceptable QOS cannot be achieved without call admission control (CAC) mechanisms for CO services, and some form of control of the user behavior. It is thus necessary to implement usage parameter control (UPC) functions, that can either be preventive or repressive. Repressive UPC is performed within the network, and mainly consists in discarding cells that do not comply with the traffic contract between the user and the network. Preventive UPC is performed at the source user, and consists in functions that make sure that the traffic that crosses 'This work was performed in the framework of a research contract between Politecnico di Torino and CSELT (Centro Studi e Laboratori Telecomunicazioni), and with the support of the European Community through the PHARE-ACCORD contract n. H-9112-0353.
D. D. Kouvatsos (ed.), Performance Modelling and Evaluation of ATM Networks © Springer Science+Business Media Dordrecht 1995
106
Part Two
Traffic Control
the user-to-network interface (UNI) complies with such a contract. Preventive UPC is often called traffic shaping, while repressive UPC is often called traffic policing. In this paper we present simulation results that show the impact of two different traffic shaping mechanisms on the QOS of CL services. Two network topologies are considered, one being essentially bicentric, and the other being essentially monocentric. The former topology is a possible candidate for an Italian ATM network, and the latter for a Hungarian ATM network. Simulation results were obtained with a software tool named CLASS (CL ATM Services Simulator) [1], whose first version was developed at Politecnico di Torino, and is now being jointly upgraded by Politecnico di Torino and the Technical University of Budapest. Two similar shaping policies were investigated; an adaptation of the Generic Cell Rate Algorithm (GCRA) specified in the ITU -T Recommendation 1.371 [2] for traffic policing, and a Token Bucket Algorithm (TBA) [3-5]. The paper is organized as follows. In the next section we briefly outline the main features of CLASS, the simulator used in the study. Section 3 describes the structure of the considered shaping device, as well as the adopted shaping algorithms. Section 4 summarizes the main characteristics of the two networks used for the derivation of the numerical results that are presented in Section 5. A wide variety of results is enclosed and commented in the paper for the comparison of alternative solutions for traffic shaping, with different parameters and traffic loads. The numerical results allow the illustration of the impact of the features of the two networks on the gains obtained with the traffic shaping function, and the impact of shaping on the performance provided to the end user. Finally, Section 6 offers some conclusive remarks. 2. CLASS
CLASS [1] is a slotted synchronous simulator, entirely written in standard C language to achieve good portability. CLASS aims at the estimation of the performances of connectionless services in ATM networks, i.e., services that are based on the exchange of messages. Messages are segmented into cells by the ATM Adaptation Layer (AAL) before transmission, and they are reconstructed before the information is delivered to the destination. Thus, the estimation of the performances of connectionless services requires the computation of performance parameters both at the cell and at the message levels. The performance parameters computed with CLASS can be divided into three categories, as follows. Cell and message loss probabilities - These parameters are measured considering both the whole network, and individual buffers and connections (virtual channelsVCs). Loss probabilities can be further subdivided in three different contributions: the first is due to overflows in the user transmission buffers (the whole message, i.e., all of its cells, are discarded in this case); the second is due to overflows in the buffers associated with links between network nodes; the third is due to overflows in the buffers associated with the links that connect the destination node to the final destination (a user). A message is considered to be lost when at least one of its cells is lost.
Simulation of traffic shaping algorithms in ATM networks
107
Cell and message delay jitters - Cell and message delays comprise a constant part, due to propagation delays along links, and processing delays within nodes, and of a variable part, due to the waiting time in the user transmission buffer, and to queuing in the buffers associated with links between nodes. Only the variable part is considered and measured. For each delay jitter, the histogram, the average value, and the variance are computed. Also these performance parameters are computed considering both the whole network, and individual links and VCs. Number of useless cells brought to destination - Since the loss of only one cell causes the loss of the entire message to which the cell belongs, all the other cells of the same message that successfully reach their destination result in a useless effort by the network. It is important to count these useless cells, since their number can be greatly affected by different traffic control policies. The number of useless cells is measured considering both the whole network, and individual links and VCs. We call useless load the fraction of useless cells that are brought to destination. The wide variety of possible application scenarios in B-ISDN translates in the need for traffic generation models of different nature, so as to adequately describe different characteristic traffic patterns. Many different types of traffic sources are available in CLASS, in order to generate a representative synthetic workload for the functional model of the ATM network operations. The user models available in CLASS are described in [1). In the work that we report in this paper, a very simple traffic source model was used in which traffic generators produce user messages that are subsequently segmented by the AAL sublayer into cells that must be transmitted on the network. Users generate traffic whose average level and destination are controlled by a traffic matrix that specifies each individual traffic relation. The destination is randomly selected on a message basis. Messages are generated according to a Poisson arrival process. The length of the messages is distributed according to a truncated geometric with mean equal 20 cells and truncation value equal 200 cells. 3. Shaping the user traffic Traffic shaping is a preventive traffic control function. It is performed close to the traffic source, in order to decrease the burstiness of the offered traffic by smoothing the flow of cells, so as to ensure that the traffic crossing the UNI meets the characteristics specified during the connection establishment phase through the CAC functions. Traffic shaping may be performed directly at the connectionless traffic source or at the LAN jWAN interworking unit. The traffic shaping function is thus interposed between the traffic source and the node of the ATM network, and it can be combined with some fair queuing service algorithms such as the Virtual Spacing Scheduling proposed by Roberts [10) in order to guarantee a minimal service rate for best effort services. The shaping algorithm considered in this paper differs from other algorithms described in the literature, since it is specifically designed to suit the connectionless traffic environment where cells are generated in batches. Instead of discarding cells as in the case of policing or in the case of the cell spacer described in [7), our shaping algorithm delays cells
108
Part Two
Message generation
.
Segmentation
Segmentation
Message generation
Traffic Control ;---
Qs[ M
Cx cy Cz
U X
~
Tt, Tty Ttz
• •
•
•
•
U
•
Segmentation Segmentation
X
QSN
M U X
M
TX queue
]It
I-
Qt
C, Cb Cc
rft, Ttt Ttc
~
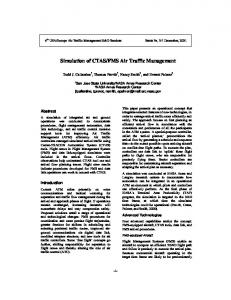
Figure 1. Architecture for traffic shaping
until they comply with the traffic contract. In the cell spacer described in [7~9], Boyer et al. proposed the insertion of a spacing function after the policing function at the UNI and NNI (network node interface) in order to decrease the CDY (cell delay variation) of connection-oriented traffic which may become intolerable when a circuit emulation has to be performed. Therefore, in their device only the conforming cells are spaced. The architecture of the traffic shaping device that we have considered is depicted in Fig. 1. Message generations correspond to the invocation of AAL service primitives from higher layer protocols. Messages are then segmented into cells, and batches of cells corresponding to whole messages are forwarded to the shapers, that implement a specified shaping algorithm on the traffic referring to a given group of YCs. When more than one YC belongs to a group, multiplexing the YCs into groups is necessary before shaping. Batches of cells (deriving from one message) are multiplexed at this stage. A further multiplexing of the shaped cell streams is necessary before crossing the UNI when more than one group is defined at a user. Single cells are multiplexed in this second multiplexer. Several different architectures may be devised for the implementation of the traffic shaping functions, and their performances may significantly differ. A quantification of the relative merits of different shaping approaches is left for further study.
3.1. Multiplexing ves into groups As we noted before, the shaping function is applied to groups of YCs that originate from a common user; thus, messages belonging to a given group must be multiplexed before shaping. Many different groupings of YCs can be defined. At one extreme, each YC can be individually shaped; at the other extreme, all the YCs originating from one user are collectively shaped. As intermediate solutions, different groupings of YCs can be considered.
Simulation of traffic shaping algorithms in ATM networks
109
In principle, YCs can be grouped in any arbitrary way, but a specific performance objective should suggest to group the YCs on the basis of some common characteristics, such as the destination node, the path through part of the network, or other.
3.2. The shaping algorithms Two similar shaping policies were investigated. The first policy is an adaptation of the Generic Cell Rate Algorithm (GCRA) specified in the ITU-T Recommendation 1.371 [2] for traffic policing. While there the GCRA is recommended for cell marking or discarding, the adaptation that we consider delays cells until they are considered compliant by the algorithm. The second policy is a shaping version of a simple leaky bucket, where again cells are delayed rather than discarded; similar to what is done in the literature, we refer to this policy with the name Token Bucket Algorithm (TBA) [3-5]. Both the GCRA and the TBA depend on two key parameters. 1. The bandwidth allocated to the group of YCs on which a shaper operates; this parameter defines the token generation rate for the TBA, and the nominal cell interarrival time, denoted by T, in the GCRA.
2. The allowed cell burst length; this parameter defines the token buffer size for the TBA and the cell delay variation tolerance for the GCRA. The token buffer size for the TBA is denoted by T BS; the cell delay variation tolerance for the GCRA is denoted by T. For both algorithms, the goal is to compute the allowed transmission time for an incoming cell, given its theoretical arrival time, and its actual arrival time. • The actual arrival time of cell Gi , Tai, is the generation time of the message to which Gi belongs. • The theoretical arrival time of cell G;, T ATi , is determined as a function of the nominal interarrival time, and of the actual arrival times of previous cells. • The allowed transmission time of cell G;, Tti, is the time at which Gi is eligible for transmission. Cells arriving at a shaper are tagged with a time stamp equal to the message generation time, that is used for shaping and cell delay jitter computation. The allowed transmission time Tti for each cell G; of the YCs in the n-th group is computed by the n-th shaper which places the cells into its output queue QSn' together with the computed value of Tti. Note that, due to the presence of the output multiplexer, the allowed transmission time of Gi in general does not coincide with its actual transmission time, except for the case in which the shaper operates only on one group of YCs.
3.2.1. The GCRA shaper The GCRA shaper is defined by slot for each shaper operating on a iC Tai = TIME - if Tai ~ TAT; - if T ATi - T :::; Tai < TAT; - if Tai < TATi - T
the following algorithm to be executed at every time group of YCs. TIME identifies the current slot. then then then
Tti = Ta;, Tt; = Tai, Tti = TATi -
T,
TATi+1 TATi+l TATi+!
Ta; + T TAT; + T TATi + T
Part Two
110
Traffic Control
3.2.2. The TBA shaper The TBA shaper is defined by the following algorithm to be executed at every time slot for each shaper operating on a group of YCs. The admission of every cell into the ATM network requires the removal of one token from the bucket. TIME identifies the current slot; NT is the number of tokens in the token bucket; Tnt is the future time slot when the first token (not reserved to a queued cell), will arrive into the token buffer. The algorithm is made of two steps that must be executed in the given order.
• Step 1: if Tnt = TIME - then NT = NT + 1 -if NT
'0
.~
i:E
u" 0
1 0.1
1
10 Average net cell delay jitter
100
Figure 11. Coefficient of variation of the cell delay jitter inside the network versus average cell delay jitter inside the two networks with T = 20
Simulation of traffic shaping algorithms in ATM networks
121
le-03
~
t
le-04
.s'"'" .,u
le-05
S
le-06
I + H X SVG ---FBGDNG ........ VCG ---
=
~
le-07
le-M
~--~--~~~~~--~--~~~~~----~~~~~~
10
100 1000 Average V-V cell delay jitter
10000
Figure 12. Cell loss probability versus the average user-to-user cell delay jitter for the two networks and the four groupings
performed with (3 = 10.) These results are not surprising: when shaping tightly controls the admission of cells into the network, the user-to-user cell delay jitter is high, but the cell delay jitter inside the network is low. The flow of cells is very smooth inside the network, so that the coefficient of variation of the cell delay jitter inside the network is low. However, source user buffers are heavily loaded because cells must wait for a significant amount of time before being allowed to enter the ATM network, so that the coefficient of variation of the user-to-user cell delay jitter is high. When the cell admission control enforced by shaping becomes looser, the user-to-user cell delay jitter decreases, but the cell delay jitter inside the network grows. The occupancy of buffers inside the network is quite variable, and the coefficient of variation of the cell delay jitter inside the network grows. The time spent in the source user buffers before admission into the network is reduced, however its variability remains large, and the coefficient of variation of the user-to-user cell delay jitter does not change significantly. Finally, when hardly any shaping is performed, the buffers inside the network are often full, some cells with the longest delay are lost, so that the coefficient of variation of the cell delay jitter inside the network decreases again. The time spent in the source user buffers becomes short, and the coefficient of variation of the user-to-user cell delay jitter decreases significantly. In Fig. 12 we show the curves of the cell loss probability versus the average user-to-user cell delay jitter for the two networks and the four groupings. These curves are quite interesting for the comparison of the different groupings, since we have on the horizontal axis the price to be paid in terms of the user-to-user cell delay jitter, and on the vertical
Part Two
122
Traffic Control
i'.l
.:;1
;.:
~ ~
e
Ie-03
Q.
'"
'" ,g
=., u
~
§
total N-V
~
+
X
SVG ---FBG -
Ie-04
DNG
VCG ---
~
10
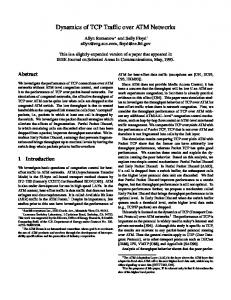
Figure 13. Total and N-U cell loss probabilities versus the bandwidth allocation factor (3, in the I network for a total load equal to 800 Mbit/s and with T = 20
axis the gain in terms of the cell loss probability. Of course, the better the shaping policy, the more its points remain low and to the left. From these results the impact of the different groupings is more clear, and we can conclude once more that VCG is the most effective grouping, and that the two intermediate groupings do not provide performance gains that justify their implementation complexity.
5.2. The bottlenecks in the I network We now turn our attention to the comparison of the I and H networks. Several observations are possible from the plots that were presented so far. The behaviors of the different shaping policies in the two networks appear to be fairly similar, however, some significant differences exist. On the one hand, the increase in the average user-to-user cell delay jitter can be seen to be similar for the two networks. Instead, although the range of the values is almost identical some differences exist for the reduction of the average cell delay jitter inside the networks, but these do not clearly favor one of the two networks. On the other hand, the I network shows higher values and smaller reductions of cell loss probabilities, moreover higher values in the coefficient of variation can also be observed. Some of the differences in the coefficient of variation can be explained by the fact that the H network is symmetric, with users injecting similar amounts of traffic into the network, while in the I network the input traffic varies significantly for the different users. The large number of losses in the I network is mainly due to the bottleneck effect occurring when cell streams traveling on a 600 Mbit/s link must be forwarded on a 150
Simulation of traffic shaping algorithms in ATM networks
123
-'- -- ---+ ------------------ -+ - -- --- --- -- :.:.:.:.:.:.:.:.:.:.:.:.:.:.:.:.:.:.~
Ie-03
-.
• • __ a • • • • • • • • • • • • • • • •
Ie-04
total
Ie-OS
+
N-V X
SVG ----
FBG DNG ....... .
Ie-06
VCG ---
Ie-07
Ie-08
I
10
~
Figure 14. Total and N-U cell loss probabilities versus the bandwidth allocation factor (3, in the H network for a total load equal to 600 Mbit/s and with T = 20
Mbit/s link. The effect of this bottleneck is illustrated by the results in Figs. 13 and 14, where the total cell loss probability curves are shown together with the curves of the loss probability in the buffers associated with the link connecting the destination node with the destination user (N-U loss), for the I and H networks, respectively. In Fig. 13, the curves show that in the I network a vast majority of the cell losses (as well as the delay jitter inside the network) take place within the buffers connecting destination nodes to destination users, and this is true in particular at those destination nodes that can be reached with a 600 Mbit/s link. This effect is stressed even more by the fact that in the I network the 600 Mbit/s links carry a large fraction of the traffic. Instead, in the H network, where all links have the same data rate and such a bottleneck effect is not present, when the cell loss probability is significant, cell losses are more evenly distributed in all the network buffers. The cell loss probability can be reduced by more than three orders of magnitude in the observable range, and even larger reductions are certainly achieved for those cases in which no losses were observed. Fig. 14 clearly shows this behavior, since for large values of the bandwidth allocation factor (3, the N-U loss only amounts to about 10% of the total loss. For small values of (3, no cell loss occurs also inside the H network. Another interesting observation is that the results in the H network clearly demonstrate that the cell shaping performed at the source has a much greater impact on the cell loss probability inside the network rather than on the cell loss probability at the buffer between the destination node and the destination user. This is due to the fact that the multiplexing stages inside the network can drastically alter the characteristics of the traffic. In other
Part Two
124
Traffic Control
10 I
t ~
:=
+
H X
x .....
SUG _._FBGDNG ....... . VCG ---
'"'" ..9 ~ u
30 ~
X.
;:s ]
~
'" ..9 ..,'"
co
~
..,'"
~
I
L-~~~~~
le-08
le-07
__
__ __ __ le-06 Ie-OS 0.0001 Total cell loss probability
~u-~
~~~
~~~
__ 0.001
~~
~~
Figure 15. Message loss probability over cell loss probability versus the cell loss probability for the two networks and the four groupings
words, if we focus onto a specific buffer in the network, and onto the loss probability in this buffer, the closer is the buffer to the shaper, the more effective is the shaping function on the loss probability in this buffer. 5.3. Message-level performance Results concerning message loss probabilities and message delay jitters are crucial in the evaluation of the performances of connectionless services. At first sight, the results available for the message loss probability and the message delay jitter show a behaviour very similar to the same parameters referred to cells. For this reason, in order to reduce the number of figures to be presented, we only describe some interesting features of the message-level quantitative results. In Figs. 15 and 16 we plot the curves of the ratio between the message loss probability and the total cell loss probability as well as the curves of the ratio between the number of useless cells brought to destination and the number of cells lost, versus the cell loss probability for the two networks and the four groupings, respectively. As expected, the two figures behave similarly: in both cases a higher burstiness of the cell loss events reduces the value of the ratio. It is important to observe that the ratios decrease for increasing cell loss probability. This result is due to the fact that when cell losses inside the network are very rare, messages are discarded because of the loss of a small number of cells and at the destination a greater number of cells must be discarded for each cell lost at any buffer inside nodes of the ATM network; hence we can conclude that the correlation among cell loss events is
Simulation of traffic shaping algorithms in ATM networks
t ~ '"
'" ..9
125
I + H X SUG ---FBGDNG ....... .
x.........
VCG ---
~---------------------~.:.~:::.
10
'il