Hindawi Publishing Corporation Mathematical Problems in Engineering Volume 2015, Article ID 805357, 25 pages http://dx.doi.org/10.1155/2015/805357
Research Article Multithreshold Segmentation by Using an Algorithm Based on the Behavior of Locust Swarms Erik Cuevas,1,2 Adrián González,1 Fernando Fausto,1 Daniel Zaldívar,1,2 and Marco Pérez-Cisneros3 1
Departamento de Electr´onica, Universidad de Guadalajara, CUCEI, Avenida Revoluci´on 1500, 44430 Guadalajara, JAL, Mexico 2 Centro Tapat´ıo Educativo AC, Vicente Guerrero 232, Colonia Zapopan Centro, 45100 Zapopan, JAL, Mexico 3 Centro Universitario de Tonal´a, Avenida Nuevo Perif´erico No. 555 Ejido San Jos´e Tatepozco, 48525 Tonal´a, JAL, Mexico Correspondence should be addressed to Erik Cuevas;
[email protected] Received 7 October 2014; Revised 25 May 2015; Accepted 10 June 2015 Academic Editor: Bogdan Dumitrescu Copyright © 2015 Erik Cuevas et al. This is an open access article distributed under the Creative Commons Attribution License, which permits unrestricted use, distribution, and reproduction in any medium, provided the original work is properly cited. As an alternative to classical techniques, the problem of image segmentation has also been handled through evolutionary methods. Recently, several algorithms based on evolutionary principles have been successfully applied to image segmentation with interesting performances. However, most of them maintain two important limitations: (1) they frequently obtain suboptimal results (misclassifications) as a consequence of an inappropriate balance between exploration and exploitation in their search strategies; (2) the number of classes is fixed and known in advance. This paper presents an algorithm for the automatic selection of pixel classes for image segmentation. The proposed method combines a novel evolutionary method with the definition of a new objective function that appropriately evaluates the segmentation quality with respect to the number of classes. The new evolutionary algorithm, called Locust Search (LS), is based on the behavior of swarms of locusts. Different to the most of existent evolutionary algorithms, it explicitly avoids the concentration of individuals in the best positions, avoiding critical flaws such as the premature convergence to suboptimal solutions and the limited exploration-exploitation balance. Experimental tests over several benchmark functions and images validate the efficiency of the proposed technique with regard to accuracy and robustness.
1. Introduction Image segmentation [1] consists in grouping image pixels based on some criteria such as intensity, color, and texture and still represents a challenging problem within the field of image processing. Edge detection [2], region-based segmentation [3], and thresholding methods [4] are the most popular solutions for image segmentation problems. Among such algorithms, thresholding is the simplest method. It works by considering threshold (points) values to adequately separate distinct pixels regions within the image being processed. In general, thresholding methods are divided into two types depending on the number of threshold values, namely, bilevel and multilevel. In bilevel thresholding, only a threshold value is required to separate the two objects of an image (e.g., foreground and background). On the other hand, multilevel thresholding divides pixels into more
than two homogeneous classes that require several threshold values. The thresholding methods use a parametric or nonparametric approach [5]. In parametric approaches [6, 7], it is necessary to estimate the parameters of a probability density function that is capable of modelling each class. A nonparametric technique [8–11] employs a given criteria such as the between-class variance or the entropy and error rate, in order to determine optimal threshold values. A common method to accomplish parametric thresholding is the modeling of the image histogram through a Gaussian mixture model [12] whose parameters define a set of pixel classes (threshold points). Therefore, each pixel that belongs to a determined class is labeled according to its corresponding threshold points with several pixel groups gathering those pixels that share a homogeneous grayscale level.
2 The problem of estimating the parameters of a Gaussian mixture that better model an image histogram has been commonly solved through the Expectation Maximization (EM) algorithm [13, 14] or gradient-based methods such as Levenberg-Marquardt, LM [15]. Unfortunately, EM algorithms are very sensitive to the choice of the initial values [16], meanwhile gradient-based methods are computationally expensive and may easily get stuck within local minima [17]. As an alternative to classical techniques, the problem of Gaussian mixture identification has also been handled through evolutionary methods. In general, they have demonstrated to deliver better results than those based on classical approaches in terms of accuracy and robustness [18]. Under these methods, an individual is represented by a candidate Gaussian mixture model. Just as the evolution process unfolds, a set of evolutionary operators are applied in order to produce better individuals. The quality of each candidate solution is evaluated through an objective function whose final result represents the similarity between the mixture model and the histogram. Some examples of these approaches involve optimization methods such as Artificial Bee Colony (ABC) [19], Artificial Immune Systems (AIS) [20], Differential Evolution (DE) [21], Electromagnetism Optimization (EO) [22], Harmony Search (HS) [23], and Learning Automata (LA) [24]. Although these algorithms own interesting results, they present two important limitations. (1) They frequently obtain suboptimal approximations as a consequence of a limited balance between exploration and exploitation in their search strategies. (2) They are based on the assumption that the number of Gaussians (classes) in the mixture is preknown and fixed; otherwise, they cannot work. The cause of the first limitation is associated with their evolutionary operators employed to modify the individual positions. In such algorithms, during their evolution, the position of each agent for the next iteration is updated yielding an attraction towards the position of the best particle seen so far or towards other promising individuals. Therefore, as the algorithm evolves, these behaviors cause that the entire population rapidly concentrates around the best particles, favoring the premature convergence and damaging the appropriate exploration of the search space [25, 26]. The second limitation is produced as a consequence of the objective function that evaluates the similarity between the mixture model and the histogram. Under such an objective function, the number of Gaussians functions in the mixture is fixed. Since the number of threshold values (Gaussian functions) used for image segmentation varies depending on the image, the best threshold number and values are obtained by an exhaustive trial and error procedure. On the other hand, bioinspired algorithms represent a field of research that is concerned with the use of biology as a metaphor for producing optimization algorithms. Such approaches use our scientific understanding of biological systems as an inspiration that, at some level of abstraction, can be represented as optimization processes. In the last decade, several optimization algorithms have been developed by a combination of deterministic rules and randomness, mimicking the behavior of natural phenomena. Such methods include the social behavior of bird flocking
Mathematical Problems in Engineering and fish schooling such as the Particle Swarm Optimization (PSO) algorithm [27] and the emulation of the differential evolution in species such as the Differential Evolution (DE) [28]. Although PSO and DE are the most popular algorithms for solving complex optimization problems, they present serious flaws such as premature convergence and difficulty to overcome local minima [29, 30]. The cause for such problems is associated with the operators that modify individual positions. In such algorithms, during the evolution, the position of each agent for the next iteration is updated yielding an attraction towards the position of the best particle seen so far (in case of PSO) or towards other promising individuals (in case of DE). As the algorithm evolves, these behaviors cause that the entire population rapidly concentrates around the best particles, favoring the premature convergence and damaging the appropriate exploration of the search space [31, 32]. Recently, the collective intelligent behavior of insect or animal groups in nature has attracted the attention of researchers. The intelligent behavior observed in these groups provides survival advantages, where insect aggregations of relatively simple and “unintelligent” individuals can accomplish very complex tasks using only limited local information and simple rules of behavior [33]. Locusts (Schistocerca gregaria) are a representative example of such collaborative insects [34]. Locust is a kind of grasshopper that can change reversibly between a solitary and a social phase, with clear behavioral differences among both phases [35]. The two phases show many differences regarding the overall level of activity and the degree to which locusts are attracted or repulsed among them [36]. In the solitary phase, locusts avoid contact to each other (locust concentrations). As consequence, they distribute throughout the space, exploring sufficiently over the plantation [36]. On the other hand, in the social phase, locusts frantically concentrate around those elements that have already found good food sources [37]. Under such a behavior, locusts attempt to efficiently find better nutrients by devastating promising areas within the plantation. This paper presents an algorithm for the automatic selection of pixel classes for image segmentation. The proposed method combines a novel evolutionary method with the definition of a new objective function that appropriately evaluates the segmentation quality with regard to the number of classes. The new evolutionary algorithm, called Locust Search (LS), is based on the behavior presented in swarms of locusts. In the proposed algorithm, individuals emulate a group of locusts which interact to each other based on the biological laws of the cooperative swarm. The algorithm considers two different behaviors: solitary and social. Depending on the behavior, each individual is conducted by a set of evolutionary operators which mimics different cooperative conducts that are typically found in the swarm. Different to most of existent evolutionary algorithms, the behavioral model in the proposed approach explicitly avoids the concentration of individuals in the current best positions. Such fact allows avoiding critical flaws such as the premature convergence to suboptimal solutions and the incorrect exploration-exploitation balance. In order to automatically define the optimal number of pixel classes
Mathematical Problems in Engineering (Gaussian functions in the mixture), a new objective function has been also incorporated. The new objective function is divided into two parts. The first part evaluates the quality of each candidate solution in terms of its similarity with regard to the image histogram. The second part penalizes the overlapped area among Gaussian functions (classes). Under these circumstances, Gaussian functions that do not “positively” participate in the histogram approximation could be easily eliminated in the final Gaussian mixture model. In order to illustrate the proficiency and robustness of the proposed approach, several numerical experiments have been conducted. Such experiments are divided into two sections. In the first part, the proposed LS method is compared to other well-known evolutionary techniques over a set of benchmark functions. In the second part, the performance of the proposed segmentation algorithm is compared to other segmentation methods which are also based on evolutionary principles. The results in both cases validate the efficiency of the proposed technique with regard to accuracy and robustness. This paper is organized as follows: in Section 2 basic biological issues of the algorithm analogy are introduced and explained. Section 3 describes the novel LS algorithm and its characteristics. A numerical study on different benchmark function is presented in Section 4 while Section 5 presents the modelling of an image histogram through a Gaussian mixture. Section 6 exposes the LS segmentation algorithm and Section 7 the performance of the proposed segmentation algorithm. Finally, Section 8 draws some conclusions.
2. Biological Fundamentals and Mathematical Models Social insect societies are complex cooperative systems that self-organize within a set of constraints. Cooperative groups are good at manipulating and exploiting their environment, defending resources and breeding, yet allowing task specialization among group members [38, 39]. A social insect colony functions as an integrated unit that not only possesses the ability to operate at a distributed manner but also undertakes a huge construction of global projects [40]. It is important to acknowledge that global order for insects can arise as a result of internal interactions among members. Locusts are a kind of grasshoppers that exhibit two opposite behavioral phases: solitary and social (gregarious). Individuals in the solitary phase avoid contact to each other (locust concentrations). As consequence, they distribute throughout the space while sufficiently exploring the plantation [36]. In contrast, locusts in the gregarious phase gather into several concentrations. Such congregations may contain up to 1010 members, cover cross-sectional areas of up to 10 km2 , and a travelling capacity up to 10 km per day for a period of days or weeks as they feed causing a devastating crop loss [41]. The mechanism to switch from the solitary phase to the gregarious phase is complex and has been a subject of significant biological inquiry. Recently, a set of factors has been implicated to include geometry of the vegetation landscape and the olfactory stimulus [42].
3 Only few works [36, 37] that mathematically model the locust behavior have been published. Both approaches develop two different minimal models with the goal of reproducing the macroscopic structure and motion of a group of locusts. Considering that the method in [36] focuses on modelling the behavior for each locust in the group, its fundamentals have been employed to develop the algorithm that is proposed in this paper. 2.1. Solitary Phase. This section describes how each locust’s position is modified as a result of its behavior under the solitary phase. Considering that x𝑖𝑘 represents the current position of the 𝑖th locust in a group of 𝑁 different elements, the new position x𝑖𝑘+1 is calculated by using the following model: x𝑖𝑘+1 = x𝑖𝑘 + Δx𝑖 ,
(1)
with Δx𝑖 corresponding to the change of position that is experimented by x𝑖𝑘 as a consequence of its social interaction with all other elements in the group. Two locusts in the solitary phase exert forces on each other according to basic biological principles of attraction and repulsion (see, e.g., [36]). Repulsion operates quite strongly over a short length scale in order to avoid concentrations. Attraction is weaker and operates over a longer length scale, providing the social force that is required to maintain the group’s cohesion. Therefore, the strength of such social forces can be modeled by the following function: 𝑠 (𝑟) = 𝐹 ⋅ 𝑒−𝑟/𝐿 − 𝑒−𝑟 .
(2)
Here, 𝑟 is a distance, 𝐹 describes the strength of attraction, and 𝐿 is the typical attractive length scale. We have scaled the time and the space coordinates so that the repulsive strength and length scale are both represented by the unity. We assume that 𝐹 < 1 and 𝐿 > 1 so that repulsion is stronger and features in a shorter-scale, while attraction is applied in a weaker and longer-scale; both facts are typical for social organisms [21]. The social force exerted by locust 𝑗 over locust 𝑖 is s𝑖𝑗 = 𝑠 (𝑟𝑖𝑗 ) ⋅ d𝑖𝑗 ,
(3)
where 𝑟𝑖𝑗 = ‖x𝑗 − x𝑖 ‖ is the distance between the two locusts and d𝑖𝑗 = (x𝑗 − x𝑖 )/𝑟𝑖𝑗 is the unit vector pointing from x𝑖 to x𝑗 . The total social force on each locust can be modeled as the superposition of all of the pairwise interactions: 𝑁
S𝑖 = ∑ s𝑖𝑗 . 𝑗=1 𝑗=𝑖̸
(4)
The change of position Δx𝑖 is modeled as the total social force experimented by x𝑖𝑘 as the superposition of all of the pairwise interactions. Therefore, Δx𝑖 is defined as follows: Δx𝑖 = S𝑖 .
(5)
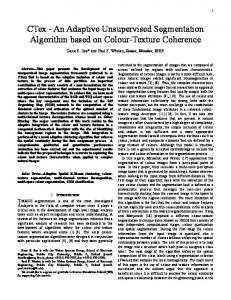
In order to illustrate the behavioral model under the solitary phase, Figure 1 presents an example, assuming a population of
4
Mathematical Problems in Engineering 𝐱1
𝐱2 𝐬21 𝐬23
𝐒2 𝐬32 𝐱3
𝐬13
𝐬12 𝐒1
𝐒3 𝐬31
Figure 1: Behavioral model under the solitary phase.
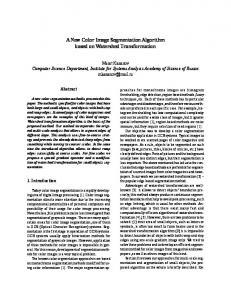
three different members (𝑁 = 3) which adopt a determined configuration in the current iteration 𝑘. As a consequence of the social forces, each element suffers an attraction or repulsion to other elements depending on the distance among them. Such forces are represented by s12 , s13 , s21 , s23 , s31 , and s32 . Since x1 and x2 are too close, the social forces s12 and s13 present a repulsive nature. On the other hand, as the distances ‖x1 − x3 ‖ and ‖x2 − x3 ‖ are quite long, the social forces s13 , s23 , s31 , and s32 between x1 ↔ x3 and x2 ↔ x3 all belong to the attractive nature. Therefore, the change of position Δx1 is computed as the vector resultant between s12 and s13 (Δx1 = s12 + s13 ) is S1 . The values Δx2 and Δx3 are also calculated accordingly. In addition to the presented model [36], some studies [43–45] suggest that the social force s𝑖𝑗 is also affected by the dominance of the involved individuals x𝑖 and x𝑗 in the pairwise process. Dominance is a property that relatively qualifies the capacity of an individual to survive, in relation to other elements in a group. The locust’s dominance is determined by several characteristics such as size, chemical emissions, and location with regard to food sources. Under such circumstances, the social force is magnified or weakened depending on the most dominant individual that is involved in the repulsion-attraction process. 2.2. Social Phase. In this phase, locusts frantically concentrate around the elements that have already found good food sources. They attempt to efficiently find better nutrients by devastating promising areas within the plantation. In order to simulate the social phase, the food quality index Fq𝑖 is assigned to each locust x𝑖 of the group as such index reflects the quality of the food source where x𝑖 is located. Under this behavioral model, each of the 𝑁 elements of the group is ranked according to its corresponding food quality index. Afterwards, the 𝑏 elements featuring the best food quality indexes are selected (𝑏 ≪ 𝑁). Considering a concentration radius 𝑅𝑐 that is created around each selected element, a set of 𝑐 new locusts is randomly generated inside 𝑅𝑐 . As a result, most of the locusts will be concentrated around the best 𝑏 elements. Figure 2 shows a simple example of the behavioral model under the social phase. In the example, the configuration includes eight locusts (𝑁 = 8), just as it is illustrated by Figure 2(a) that also presents the food quality index for each locust. A food quality index near to one indicates a better food source. Therefore, Figure 2(b) presents the final configuration after the social phase, assuming 𝑏 = 2.
3. The Locust Search (LS) Algorithm In this paper, some behavioral principles drawn from a swarm of locusts have been used as guidelines for developing a new swarm optimization algorithm. The LS assumes that entire search space is a plantation, where all the locusts interact to each other. In the proposed approach, each solution within the search space represents a locust position inside the plantation. Every locust receives a food quality index according to the fitness value of the solution that is symbolized by the locust’s position. As it has been previously discussed, the algorithm implements two different behavioral schemes: solitary and social. Depending on each behavioral phase, each individual is conducted by a set of evolutionary operators which mimics the different cooperative operations that are typically found in the swarm. The proposed method formulates the optimization problem in the following form: maximize/minimize 𝑓 (l) , subject to
l ∈ S,
l = (𝑙1 , . . . , 𝑙𝑛 ) ∈ R𝑛
(6)
where 𝑓 : R𝑛 → R is a nonlinear function whereas S = {l ∈ R𝑛 | 𝑙𝑏𝑑 ≤ 𝑙𝑑 ≤ 𝑢𝑏𝑑 , 𝑑 = 1, . . . , 𝑛} is a bounded feasible search space, which is constrained by the lower (𝑙𝑏𝑑 ) and upper (𝑢𝑏𝑑 ) limits. In order to solve the problem formulated in (6), a population L𝑘 ({l𝑘1 , l𝑘2 , . . . , l𝑘𝑁}) of 𝑁 locusts (individuals) is evolved inside the LS operation from the initial point (𝑘 = 0) to a total 𝑔𝑒𝑛 number of iterations (𝑘 = 𝑔𝑒𝑛). Each locust l𝑘𝑖 (𝑖 ∈ [1, . . . , 𝑁]) represents an 𝑛-dimensional 𝑘 𝑘 𝑘 , 𝑙𝑖,2 , . . . , 𝑙𝑖,𝑛 } where each dimension corresponds to vector {𝑙𝑖,1 a decision variable of the optimization problem to be solved. The set of decision variables constitutes the feasible search 𝑘 ≤ 𝑢𝑏𝑑 }, where 𝑙𝑏𝑑 and 𝑢𝑏𝑑 space S = {l𝑘𝑖 ∈ R𝑛 | 𝑙𝑏𝑑 ≤ 𝑙𝑖,𝑑 correspond to the lower and upper bounds for the dimension 𝑑, respectively. The food quality index that is associated with each locust l𝑘𝑖 (candidate solution) is evaluated through an objective function 𝑓(l𝑘𝑖 ) whose final result represents the fitness value of l𝑘𝑖 . In the LS algorithm, each iteration of the evolution process consists of two operators: (A) solitary and (B) social. Beginning by the solitary stage, the set of locusts is operated in order to sufficiently explore the search space. On the other hand, the social operation refines existent solutions within a determined neighborhood (exploitation) subspace. 3.1. Solitary Operation (A). One of the most interesting features of the proposed method is the use of the solitary operator to modify the current locust positions. Under this approach, locusts are displaced as a consequence of the social forces produced by the positional relations among the elements of the swarm. Therefore, near individuals tend to repel each other, avoiding the concentration of elements in regions. On the other hand, distant individuals tend to attract to each other, maintaining the cohesion of the swarm. A clear difference to the original model in [20] considers that social forces are also magnified or weakened depending on the most dominant (best fitness values) individuals that are involved in the repulsion-attraction process.
Mathematical Problems in Engineering
5
1 Fq7 = 0.3
Fq4 = 0.9
4
5
3
7
4
Rc Fq5 = 0.2
Fq8 = 0.4 5
2
Fq6 = 1.0
8
6
6 Fq2 = 0.3
8
7
2 Fq3 = 0.1
Fq1 = 0.2
3
1 (a)
(b)
Figure 2: Behavioral model under the social phase. (a) Initial configuration and food quality indexes, (b) final configuration after the operation of the social phase.
𝑘 𝑘 s𝑚 𝑖𝑗 = 𝜌 (l𝑖 , l𝑗 ) ⋅ 𝑠 (𝑟𝑖𝑗 ) ⋅ d𝑖𝑗 + rand (1, − 1) ,
(7)
where 𝑠(𝑟𝑖𝑗 ) is the social force strength defined in (2) and d𝑖𝑗 = (l𝑘𝑗 − l𝑘𝑖 )/𝑟𝑖𝑗 is the unit vector pointing from l𝑘𝑖 to l𝑘𝑗 . Besides, rand(1, −1) is a randomly generated number between 1 and −1. Likewise, 𝜌(l𝑘𝑖 , l𝑘𝑗 ) is the dominance function that calculates the dominance value of the most dominant individual from l𝑘𝑗 and l𝑘𝑖 . In order to operate 𝜌(l𝑘𝑖 , l𝑘𝑗 ), all the individuals from L𝑘 ({l𝑘1 , l𝑘2 , . . . , l𝑘𝑁}) are ranked according to their fitness values. The ranks are assigned so that the best individual receives the rank 0 (zero) whereas the worst individual obtains the rank 𝑁 − 1. Therefore, the function 𝜌(l𝑘𝑖 , l𝑘𝑗 ) is defined as follows: 𝜌 (l𝑘𝑖 , l𝑘𝑗 )
−(5⋅rank(l𝑘 )/𝑁)
𝑖 {𝑒 ={ −(5⋅rank(l𝑘𝑗 )/𝑁) {𝑒
if rank (l𝑘𝑖 ) < rank (l𝑘𝑗 ) if rank (l𝑘𝑖 ) > rank (l𝑘𝑗 ) ,
(8)
1 0.8
𝜌(𝐥ki , 𝐥kj )
In the solitary phase, a new position p𝑖 (𝑖 ∈ [1, . . . , 𝑁]) is produced by perturbing the current locust position l𝑘𝑖 with a change of position Δl𝑖 (p𝑖 = l𝑘𝑖 + Δl𝑖 ). The change of position Δl𝑖 is the result of the social interactions experimented by l𝑘𝑖 as a consequence of its repulsion-attraction behavioral model. Such social interactions are pairwise computed among l𝑘𝑖 and the other 𝑁 − 1 individuals in the swarm. In the original model, social forces are calculated by using (3). However, in the proposed method, it is modified to include the best fitness value (the most dominant) of the individuals involved in the repulsion-attraction process. Therefore, the social force, that is exerted between l𝑘𝑗 and l𝑘𝑖 , is calculated by using the following new model:
0.6 0.4 0.2 0
0
20
40
60 Rank
80
100
(𝐥ki )
Figure 3: Behavior of 𝜌(l𝑘𝑖 , l𝑘𝑗 ) considering 100 individuals.
where the function rank(𝛼) delivers the rank of the 𝛼individual. According to (8), 𝜌(l𝑘𝑖 , l𝑘𝑗 ) yields a value within the interval (1, 0). Its maximum value of one in 𝜌(l𝑘𝑖 , l𝑘𝑗 ) is reached when either individual l𝑘𝑗 or l𝑘𝑖 is the best element of
the population L𝑘 regarding their fitness values. On the other hand, a value close to zero is obtained when both individuals l𝑘𝑗 and l𝑘𝑖 possess quite bad fitness values. Figure 3 shows the
behavior of 𝜌(l𝑘𝑖 , l𝑘𝑗 ) considering 100 individuals. In the figure,
it is assumed that l𝑘𝑖 represents one of the 99 individuals with ranks between 0 and 98 whereas l𝑘𝑗 is fixed to the element with the worst fitness value (rank 99). Under the incorporation of 𝜌(l𝑘𝑖 , l𝑘𝑗 ) in (7), social forces are magnified or weakened depending on the best fitness value (the most dominant) of the individuals involved in the repulsion-attraction process.
6
Mathematical Problems in Engineering 5
5
4
4
3
3
2
2
1
1
0
0
−1
−1
−2
−2
−3
−3
−4
−4
−5 −5
0
5
−5 −5
(a)
5
(b)
5
5
4
4
3
3
2
2
1
1
0
0
−1
−1
−2
−2
−3
−3
−4
−4
−5 −5
0
5
0 (c)
−5 −5
0
5
(d)
Figure 4: Examples of different distributions. (a) Initial condition, (b) distribution after applying 25, (c) 50 and (d) 100 operations. The green asterisk represents the minimum value so far.
Finally, the total social force on each individual l𝑘𝑖 is modeled as the superposition of all of the pairwise interactions exerted over it: S𝑚 𝑖
=
𝑁
∑ s𝑚 𝑖𝑗 . 𝑗=1 𝑗=𝑖̸
(9)
Therefore, the change of position Δl𝑖 is considered as the total social force experimented by l𝑘𝑖 as the superposition of all of the pairwise interactions. Thus, Δl𝑖 is defined as follows: Δl𝑖 = S𝑚 𝑖 .
(10)
After calculating the new positions P ({p1 , p2 , . . . , p𝑁}) of the population L𝑘 ({l𝑘1 , l𝑘2 , . . . , l𝑘𝑁}), the final positions F ({f1 , f2 , . . . , f𝑁}) must be calculated. The idea is to admit only the changes that guarantee an improvement in the search strategy. If the fitness value of p𝑖 (𝑓(p𝑖 )) is better than l𝑘𝑖 (𝑓(l𝑘𝑖 )), then p𝑖 is accepted as the final solution. Otherwise,
l𝑘𝑖 is retained. This procedure can be resumed by the following statement (considering a minimization problem): {p 𝑖 f𝑖 = { l𝑘 {𝑖
if 𝑓 (p𝑖 ) < 𝑓 (l𝑘𝑖 ) otherwise.
(11)
In order to illustrate the performance of the solitary operator, Figure 4 presents a simple example with the solitary operator being iteratively applied. A population of 50 different members (𝑁 = 50) is assumed which adopt a concentrated configuration as initial condition (Figure 4(a)). As a consequence of the social forces, the set of elements tends to distribute throughout the search space. Examples of different distributions are shown in Figures 4(b), 4(c), and 4(d) after applying 25, 50, and 100 different solitary operations, respectively. 3.2. Social Operation (B). The social procedure represents the exploitation phase of the LS algorithm. Exploitation is
Mathematical Problems in Engineering
7
⋅ 𝛽,
(12)
where 𝑢𝑏𝑞 and 𝑙𝑏𝑞 are the upper and lower bounds in the 𝑞th dimension and 𝑛 is the number of dimensions of the optimization problem, whereas 𝛽 ∈ [0, 1] is a tuning factor. Therefore, the limits of 𝐶𝑗 can be modeled as follows: 𝑞
𝑢𝑠𝑠𝑗 = 𝑏𝑗,𝑞 + 𝑒𝑑 , 𝑞
𝑙𝑠𝑠𝑗 = 𝑏𝑗,𝑞 − 𝑒𝑑 , 𝑞
(13)
𝑞
where 𝑢𝑠𝑠𝑗 and 𝑙𝑠𝑠𝑗 are the upper and lower bounds of the 𝑞th dimension for the subspace 𝐶𝑗 , respectively. Considering the subspace 𝐶𝑗 around each element f𝑗 ∈ E, a set of ℎ new particles (Mℎ𝑗 = {m1𝑗 , m2𝑗 , . . . , mℎ𝑗 }) are randomly generated inside bounds fixed by (13). Once the ℎ samples are generated, the individual l𝑘+1 of the next 𝑗 population L𝑘+1 must be created. In order to calculate l𝑘+1 𝑗 ,
the best particle m𝑏𝑒𝑠𝑡 𝑗 , in terms of its fitness value from the ℎ
samples (where m𝑏𝑒𝑠𝑡 ∈ [m1𝑗 , m2𝑗 , . . . , mℎ𝑗 ]), is compared to f𝑗 . 𝑗 If m𝑏𝑒𝑠𝑡 is better than f𝑗 according to their fitness values, l𝑘+1 𝑗 𝑗
is updated with m𝑏𝑒𝑠𝑡 𝑗 ; otherwise, f𝑗 is selected. The elements of F that have not been processed by the procedure (f𝑤 ∉ E) transfer their corresponding values to L𝑘+1 with no change. The social operation is used to exploit only prominent solutions. According to the proposed method, inside each subspace 𝐶𝑗 , ℎ random samples are selected. Since the number of selected samples at each subspace is very small (typically ℎ < 4), the use of this operator substantially reduces the number of fitness function evaluations. In order to demonstrate the social operation, a numerical example has been set by applying the proposed process to a simple function. Such function considers the interval of −3 ≤ 𝑑1 , 𝑑2 ≤ 3 whereas the function possesses one global maxima of value 8.1 at (0, 1.6). Notice that 𝑑1 and 𝑑2 correspond to the axis coordinates (commonly 𝑥 and 𝑦). For this example, a final position population F of six 2-dimensional members (𝑁 = 6) is assumed. Figure 5 shows the initial configuration of the proposed example, with the black points representing half of the particles with the best fitness values (the first three elements of B, 𝑔 = 3) whereas the grey points (f2 , f4 , f6 ∉ E) correspond to the remaining individuals. From Figure 5, it
C5
6
𝐦13
𝐟3
−2
d2
0
8
𝐦23
0
𝐟2
2
2
𝐟1
0
1
4
𝐦25
4
C3
6
𝑛
𝐦15
0 2
∑𝑛𝑞=1 (𝑢𝑏𝑞 − 𝑙𝑏𝑞 )
𝐟5
2
2
4
𝑒𝑑 =
3
−2
𝐦11
0
−1
−2 −4
2 0
−2 −3 −3
−2
−2
𝐦21
C1 2
2
−1
𝐟6
−6
0
−2
the process of refining existent individuals within a small neighborhood in order to improve their solution quality. The social procedure is a selective operation which is applied only to a subset E of the final positions F (where E ⊆ F). The operation starts by sorting F with respect to fitness values, storing the elements in a temporary population B = {b1 , b2 , . . . , b𝑁}. The elements in B are sorted so that the best individual receives the position b1 whereas the worst individual obtains the location b𝑁. Therefore, the subset E is integrated by only the first 𝑔 locations of B (promising solutions). Under this operation, a subspace 𝐶𝑗 is created around each selected particle f𝑗 ∈ E. The size of 𝐶𝑗 depends on the distance 𝑒𝑑 which is defined as follows:
−4
0
1
𝐟4
0
2
3
d1
Figure 5: Operation of the social procedure.
can be seen that the social procedure is applied to all black particles (f5 = b1 , f3 = b2 , and f1 = b3 , f5 , f3 , f1 ∈ E) yielding two new random particles (ℎ = 2), which are characterized by white points m11 , m21 , m13 , m23 , m15 , and m25 , for each black point inside of their corresponding subspaces 𝐶1 , 𝐶3 , and 𝐶5 . Considering the particle f3 in Figure 7, the particle m23 corresponds to the best particle (m𝑏𝑒𝑠𝑡 3 ) from the two randomly generated particles (according to their fitness values) within 𝐶3 . Therefore, the particle m𝑏𝑒𝑠𝑡 will substitute 3 𝑘+1 f3 in the individual l3 for the next generation, since it holds a better fitness value than f3 (𝑓(f3 ) 0, ℎ (𝑔) = 𝑁𝑝 𝐿−1
Np = ∑ 𝑛𝑔 ,
(15)
𝑔=0
𝐿−1
∑ ℎ (𝑔) = 1,
𝑔=0
where 𝑛𝑔 denotes the number of pixels with gray level 𝑔 and Np the total number of pixels in the image. Under such circumstances, ℎ(𝑔) can be modeled by using a mixture 𝑝(𝑥) of Gaussian functions of the form: 𝐾
2
− (𝑥 − 𝜇𝑖 ) 𝑃𝑖 exp [ ], 2𝜎𝑖2 𝑖=1 √2𝜋𝜎𝑖
𝑝 (𝑥) = ∑
(16)
where 𝐾 symbolizes the number of Gaussian functions of the model whereas 𝑃𝑖 is the a priori probability of function 𝑖. 𝜇𝑖 and 𝜎𝑖 represent the mean and standard deviation of the 𝑖th Gaussian function, respectively. Furthermore, the constraint ∑𝐾 𝑖=1 𝑃𝑖 = 1 must be satisfied by the model. In order to evaluate the similarity between the image histogram and a candidate mixture model, the mean square error can be used as follows: 𝐽=
𝐾 2 1 𝐿 ∑ [𝑝 (𝑥𝑗 ) − ℎ (𝑥𝑗 )] + 𝜔 ⋅ (∑𝑃𝑖 ) − 1 , 𝑖=1 𝑛 𝑗=1
(17)
where 𝜔 represents the penalty associated with the constrain ∑𝐾 𝑖=1 𝑃𝑖 = 1. Therefore, 𝐽 is considered as the objective function which must be minimized in the estimation problem. In order to illustrate the histogram modeling through a Gaussian mixture, Figure 6 presents an example, assuming three classes, that is, 𝐾 = 3. Considering Figure 6(a) as the image histogram ℎ(𝑥), the Gaussian mixture 𝑝(𝑥), that is shown in Figure 6(c), is produced by adding the Gaussian functions 𝑝1 (𝑥), 𝑝2 (𝑥), and 𝑝3 (𝑥) in the configuration presented in Figure 6(b). Once the model parameters that better model the image histogram have been determined, the final step is to define the threshold values 𝑇𝑖 (𝑖 ∈ [1, . . . , 𝐾]) which can be calculated by simple standard methods, just as it is presented in [19–21].
6. Segmentation Algorithm Based on LS In the proposed method, the segmentation process is approached as an optimization problem. Computational optimization generally involves two distinct elements: (1) a search strategy to produce candidate solutions (individuals, particles, insects, locust, etc.) and (2) an objective function that evaluates the quality of each selected candidate solution. Several computational algorithms are available to perform the first element. The second element, where the objective function is designed, is unquestionably the most critical. In the objective function, it is expected to embody the full
11
Frequency
Frequency
Mathematical Problems in Engineering
h(x)
p1 (x)
p2 (x)
Gray level
p3 (x)
Gray level
(a)
(b)
Frequency
p(x)
Gray level (c)
Figure 6: Histogram approximation through a Gaussian mixture. (a) Original histogram, (b) configuration of the Gaussian components 𝑝1 (𝑥), 𝑝2 (𝑥), and 𝑝3 (𝑥), and (c) final Gaussian mixture 𝑝(𝑥).
complexity of the performance, biases, and restrictions of the problem to be solved. In the segmentation problem, candidate solutions represent Gaussian mixtures. The objective function 𝐽 (17) is used as a fitness value to evaluate the similarity presented between the Gaussian mixture and the image histogram. Therefore, guided by the fitness values (𝐽 values), a set of encoded candidate solutions are evolved using the evolutionary operators until the best possible resemblance can be found. Over the last decade, several algorithms based on evolutionary and swarm principles [19–22] have been proposed to solve the problem of segmentation through a Gaussian mixture model. Although these algorithms own certain good performance indexes, they present two important limitations. (1) They frequently obtain suboptimal approximations as a consequence of an inappropriate balance between exploration and exploitation in their search strategies. (2) They are based on the assumption that the number of Gaussians (classes) in the mixture is preknown and fixed; otherwise, they cannot work. In order to eliminate such flaws, the proposed approach includes (A) a new search strategy and (B) the definition of a new objective function. For the search strategy, the LS method (Section 4) is adopted. Under LS, the concentration of individuals in the current best positions is explicitly avoided. Such fact allows reducing critical problems such as the premature convergence to suboptimal solutions and the incorrect exploration-exploitation balance. 6.1. New Objective Function 𝐽new . Previous segmentation algorithms based on evolutionary and swarm methods use (17) as objective function. Under these circumstances, each
candidate solution (Gaussian mixture) is only evaluated in terms of its approximation with the image histogram. Since the proposed approach aims to automatically select the number of Gaussian functions 𝐾 in the final mixture 𝑝(𝑥), the objective function must be modified. The new objective function 𝐽new is defined as follows: 𝐽new = 𝐽 + 𝜆 ⋅ 𝑄,
(18)
where 𝜆 is a scaling constant. The new objective function is divided into two parts. The first part 𝐽 evaluates the quality of each candidate solution in terms of its similarity with regard to the image histogram (17). The second part 𝑄 penalizes the overlapped area among Gaussian functions (classes), with 𝑄 being defined as follows: 𝐾 𝐾
𝐿
𝑄 = ∑ ∑ ∑ min (𝑃𝑖 ⋅ 𝑝𝑖 (𝑙) , 𝑃𝑗 ⋅ 𝑝𝑗 (𝑙)) , 𝑖=1 𝑗=1 𝑙=1 𝑗=𝑖̸
(19)
where 𝐾 and 𝐿 represent the number of classes and the gray levels, respectively. The parameters 𝑝𝑖 (𝑙) and 𝑝𝑗 (𝑙) symbolize the Gaussian functions 𝑖 and 𝑗, respectively, that are to be evaluated on the point 𝑙 (gray level) whereas the elements 𝑃𝑖 and 𝑃𝑗 represent the a priori probabilities of the Gaussian functions 𝑖 and 𝑗, respectively. Under such circumstances, mixtures with Gaussian functions that do not “positively” participate in the histogram approximation are severely penalized. Figure 7 illustrates the effect of the new objective function 𝐽new in the evaluation of Gaussian mixtures (candidate solutions). From the image histogram (Figure 7(a)), it is evident that two Gaussian functions are enough to accurately
12
Mathematical Problems in Engineering p2 (x) p3 (x) Frequency
Frequency
h(x) p1 (x)
p4 (x)
Gray level
Gray level (a)
(b)
p2 (x)
p2 (x) p3 (x) Frequency
Frequency
p3 (x) p1 (x) p4 (x)
Q12
Q23
p1 (x)
Q34
Q12
Gray level (c)
Q23 Gray level
p4 (x) Q34
(d)
Figure 7: Effect of the new objective function 𝐽new in the evaluation of Gaussian mixtures (candidate solutions). (a) Original histogram, (b) Gaussian mixture considering four classes, (c) penalization areas, and (d) Gaussian mixture of better quality solution.
approximate the original histogram. However, if the Gaussian mixture is modeled by using a greater number of functions (e.g., four as it is shown in Figure 7(b)), the original objective function 𝐽 is unable to obtain a reasonable approximation. Under the new objective function 𝐽new , the overlapped area among Gaussian functions (classes) is penalized. Such areas, in Figure 7(c), correspond to 𝑄12 , 𝑄23 , and 𝑄34 , where 𝑄12 represents the penalization value produced between the Gaussian function 𝑝1 (𝑥) and 𝑝2 (𝑥). Therefore, due to the penalization, the Gaussian mixture shown in Figures 7(b) and 7(c) provides a solution of low quality. On the other hand, the Gaussian mixture presented in Figure 7(d) maintains a low penalty; thus, it represents a solution of high quality. From Figure 7(d), it is easy to see that functions 𝑝1 (𝑥) and 𝑝4 (𝑥) can be removed from the final mixture. This elimination could be performed by a simple comparison with a threshold value 𝜃, since 𝑝1 (𝑥) and 𝑝4 (𝑥) have a reduced amplitude (𝑝1 (𝑥) ≈ 𝑝2 (𝑥) ≈ 0). Therefore, under 𝐽new , it is possible to find the reduced Gaussian mixture model starting from a considerable number of functions. Since the proposed segmentation method is conceived as an optimization problem, the overall operation can be reduced to solve the formulation of (20) by using the LS algorithm: minimize 𝐽new (x) = 𝐽 (x) + 𝜆 ⋅ 𝑄 (x) , x = (𝑃1 , 𝜇1 , 𝜎1 , . . . , 𝑃𝐾 , 𝜇𝐾 , 𝜎𝐾 ) ∈ R3⋅𝐾 subject to
0 ≤ 𝑃𝑑 ≤ 1, 0 ≤ 𝜇𝑑 ≤ 255 0 ≤ 𝜎𝑑 ≤ 25,
𝑑 ∈ (1, . . . , 𝐾)
(20)
where 𝑃𝑑 , 𝜇𝑑 , and 𝜎𝑑 represent the probability, mean, and standard deviation of the class 𝑑. It is important to remark that the new objective function 𝐽new allows the evaluation of a candidate solution in terms of the necessary number of Gaussian functions and its approximation quality. Under such circumstances, it can be used in combination with any other evolutionary method and not only with the proposed LS algorithm. 6.2. Complete Segmentation Algorithm. Once the new search strategy (LS) and objective function (𝐽new ) have been defined, the proposed segmentation algorithm can be summarized by Algorithm 2. The new algorithm combines operators defined by LS and operations for calculating the threshold values. (Line 1) The algorithm sets the operative parameters 𝐹, 𝐿, 𝑔, 𝑔𝑒𝑛, 𝑁, 𝐾, 𝜆, and 𝜃. They rule the behavior of the segmentation algorithm. (Line 2) Afterwards, the population L0 is initialized considering 𝑁 different random Gaussian mixtures of 𝐾 functions. The idea is to generate an 𝑁-random Gaussian mixture subjected to the constraints formulated in (20). The parameter 𝐾 must hold a high value in order to correctly segment all images (recall that the algorithm is able to reduce the Gaussian mixture to its minimum expression). (Line 3) Then, the Gaussian mixtures are evolved by using the LS operators and the new objective function 𝐽new . This process is repeated during 𝑔𝑒𝑛 cycles. (Line 8) After 𝑔𝑒𝑛 this procedure, the best Gaussian mixture l𝑏𝑒𝑠𝑡 is selected new according to its objective function 𝐽 . (Line 9) Then, 𝑔𝑒𝑛 the Gaussian mixture l𝑏𝑒𝑠𝑡 is reduced by eliminating those functions whose amplitudes are lower than 𝜃 (𝑝𝑖 (𝑥) ≤ 𝜃). (Line 10) Then, the threshold values 𝑇𝑖 from the reduced model are calculated. (Line 11) Finally, the calculated 𝑇𝑖 values are employed to segment the image. Figure 8 shows a flowchart of the complete segmentation procedure.
Mathematical Problems in Engineering
13
(1) Input: 𝐹, 𝐿, 𝑔, 𝑔𝑒𝑛, 𝑁, 𝐾, 𝜆 and 𝜃. (2) Initialize L0 (𝑘 = 0) (3) until (𝑘 = 𝑔𝑒𝑛) Solitary operator (Section 3.1) (4) F ← SolitaryOperation(L𝑘 ) (5) L𝑘+1 ← SocialOperation(L𝑘 , F) Social operator (Section 3.2) (6) 𝑘 = k + 1 (7) end until 𝑔𝑒𝑛 (8) Obtain I𝑏𝑒𝑠𝑡 𝑔𝑒𝑛
(9) Reduce I𝑏𝑒𝑠𝑡 (10) Calculate the threshold values 𝑇𝑖 from the reduced model (11) Use 𝑇𝑖 to segment the image Algorithm 2: Segmentation LS algorithm.
The proposed segmentation algorithm permits to automatically detect the number of segmentation partitions (classes). Furthermore, due to its remarkable search capacities, the LS method maintains a better accuracy than previous algorithms based on evolutionary principles. However, the proposed method presents two disadvantages: first, it is related to its implementation which in general is more complex than most of the other segmentators based on evolutionary basics. The second refers to the segmentation procedure of the proposed approach which does not consider any spatial pixel characteristics. As a consequence, pixels that may belong to a determined region due to its position are labeled as a part of another region due to its gray level intensity. Such a fact adversely affects the segmentation performance of the method.
7. Segmentation Results This section analyses the performance of the proposed segmentation algorithm. The discussion is divided into three parts: the first one shows the performance of the proposed LS segmentation algorithm while the second presents a comparison between the proposed approach and others segmentation algorithms that are based on evolutionary and swam methods. The comparison mainly considers the capacities of each algorithm to accurately and robustly approximate the image histogram. Finally, the third part presents an objective evaluation of segmentation results produced by all algorithms that have been employed in the comparisons. 7.1. Performance of LS Algorithm in Image Segmentation. This section presents two experiments that analyze the performance of the proposed approach. Table 5 presents the algorithm’s parameters that have been experimentally determined and kept for all the test images through all experiments. First Image. The first test considers the histogram shown by Figure 9(b) while Figure 9(a) presents the original image. After applying the proposed algorithm, just as it has been configured according to parameters in Table 5, a minimum model of four classes emerges after the start from Gaussian
Table 5: Parameter setup for the LS segmentation algorithm. 𝐹 0.6
𝐿 0.2
𝑔 20
𝑔𝑒𝑛 1000
𝑁 40
𝐾 10
𝜆 0.01
𝜃 0.0001
Table 6: Results of the reduced Gaussian mixture for the first and the second image. Parameters 𝑃1 𝜇1 𝜎1 𝑃2 𝜇2 𝜎2 𝑃3 𝜇3 𝜎3 𝑃4 𝜇4 𝜎4
First image 0.004 18.1 8.2 0.0035 69.9 18.4 0.01 94.9 8.9 0.007 163.1 29.9
Second image 0.032 12.1 2.9 0.0015 45.1 24.9 0.006 130.1 17.9 0.02 167.2 10.1
mixtures of 10 classes. Considering 30 independent executions, the averaged parameters of the resultant Gaussian mixture are presented in Table 6. One final Gaussian mixture (ten classes), which has been obtained by LS, is presented in Figure 10. Furthermore, the approximation of the reduced Gaussian mixture is also visually compared with the original histogram in Figure 10. On the other hand, Figure 11 presents the segmented image after calculating the threshold points. Second Image. For the second experiment, the image in Figure 12 is tested. The method aims to segment the image by using a reduced Gaussian mixture model obtained by the LS approach. After executing the algorithm according to parameters from Table 5, the resulting averaged parameters of the resultant Gaussian mixture are presented in Table 6. In order to assure consistency, the results are averaged considering 30 independent executions. Figure 13 shows the approximation quality that is obtained by the reduced Gaussian mixture model in (a) and the segmented image in (b).
Mathematical Problems in Engineering
Frequency
14 0.035 0.03 0.025 0.02 0.015 0.01 0.005 0
Input: parameters
0
50
100 150 Gray level
200
F, L, g, gen, N, K, 𝜆, and 𝜃. Image I(x,y)
250
Initialize 𝐋0 (k = 0)
𝐅 ← SolitaryOperation (𝐋k )
𝐋k+1 ← SocialOperation (𝐋k , 𝐅) k= k+1
No
k > gen
LS method Yes gen
0.035 0.03 0.025 0.02 0.015 0.01 0.005 0
Calculate the threshold values Ti from the reduced model 0
50
100 150 Gray level
200
250 Use Ti to segment the image
Figure 8: Flowchart of the complete segmentation procedure. 0.012 0.01 Frequency
Frequency
Reduce 𝐥best
0.008 0.006 0.004 0.002 0
(a)
0
50
100 150 Gray level
200
(b)
Figure 9: (a) Original first image used on the first experiment and (b) its histogram.
250
Mathematical Problems in Engineering
15
0.012
Frequency
0.01 0.008 0.006 0.004 0.002 0
0
50
100
150
200
250
Gray level Histogram Class 1 Class 2 Class 3
Class 4 Reduced Gaussian mixture Eliminated classes
Figure 10: Gaussian mixture obtained by LS for the first image.
Figure 11: Image segmented with the reduced Gaussian mixture.
0.035
Frequency
0.03 0.025 0.02 0.015 0.01 0.005 0
0
50
100
150
200
250
Gray level (a)
(b)
Figure 12: (a) Original second image used on the first experiment and (b) its histogram.
7.2. Histogram Approximation Comparisons. This section discusses the comparison between the proposed segmentation algorithm and other evolutionary-segmentation methods that have been proposed in the literature. The set of methods used in the experiments includes the 𝐽 + ABC [19], 𝐽 + AIS [20], and 𝐽 + DE [21]. These algorithms consider the combination between the original objective function 𝐽 (17) and an evolutionary technique such as Artificial Bee Colony (ABC), the Artificial Immune Systems (AIS), and the Differential Evolution (DE) [21], respectively.
Since the proposed segmentation approach considers the combination of the new objective function 𝐽new (18) and the LS algorithm, it will be referred to as 𝐽new + LS. The comparison focuses mainly on the capacities of each algorithm to accurately and robustly approximate the image histogram. In the experiments, the populations have been set to 40 (𝑁 = 40) individuals. The maximum iteration number for all functions has been set to 1000. Such stop criterion has been considered to maintain compatibility to similar experiments
Mathematical Problems in Engineering
Frequency
16 0.035 0.03 0.025 0.02 0.015 0.01 0.005 0
0
50
100 150 Gray level
Histogram Class 1 Class 2 Class 3
200
250
Class 4 Reduced Gaussian mixture Eliminated classes (b)
(a)
Figure 13: (a) Segmentation result obtained by LS for the first image and (b) the segmented image.
(2)
(3)
(4)
Frequency
(1)
0.05 0.045 0.04 0.035 0.03 0.025 0.02 0.015 0.01 0.005 0
0
50
(a)
100 150 Gray level
200
250
(b)
Figure 14: (a) Synthetic image used in the comparison and (b) its histogram.
that are reported in the literature [18]. The parameter setting for each of the segmentation algorithms in the comparison is described as follows: (1) 𝐽 + ABC [19]: in the algorithm, its parameters are configured as follows: the abandonment limit = 100, 𝛼 = 0.05 and limit = 30. (2) 𝐽 + AIS [20]: it presents the following parameters, ℎ = 120, 𝑁𝑐 = 80, 𝜌 = 10, 𝑃𝑟 = 20, 𝐿 = 22, and 𝑇𝑒 = 0.01. (3) 𝐽 + DE [21]: the DE/Rand/1 scheme is employed. The parameter settings follow the instructions in [21]. The crossover probability is CR = 0.9 and the weighting factor is 𝐹 = 0.8. (4) In 𝐽new + LS, the method is set according to the values described in Table 5. In order to conduct the experiments, a synthetic image is designed to be used as a reference in the comparisons. The main idea is to know in advance the exact number of classes (and their parameters) that are contained in the image so that the histogram can be considered as a ground truth. The
Table 7: Employed parameters for the design of the reference image.
(1) (2) (3) (4)
𝑃𝑖 0.05 0.04 0.05 0.027
𝜇𝑖 40 100 160 220
𝜎𝑖 8 10 8 15
synthetic image is divided into four sections. Each section corresponds to a different class which is produced by setting each gray level pixel 𝑃V𝑖 to a value that is determined by the following model: 2
2
𝑃V𝑖 = 𝑒−((𝑥−𝜇1 ) /2𝜎𝑖 ) ,
(21)
where 𝑖 represents the section, whereas 𝜇𝑖 and 𝜎𝑖 are the mean and the dispersion of the gray level pixels, respectively. The comparative study employs the image of 512 × 512 that is shown in Figure 14(a) and the algorithm’s parameters that have been presented in Table 7. Figure 14(b) illustrates the resultant histogram.
17
0.06
0.06
0.05
0.05
0.04
0.04
Frequency
Frequency
Mathematical Problems in Engineering
0.03 0.02 0.01 0
0.03 0.02 0.01
0
50
100
150
200
250
0
0
50
100 150 Gray level
Gray level Histogram Class 1 Class 2 Class 3 Class 4
Class 5 Class 6 Class 7 Class 8
Histogram Class 1 Class 2
200
250
Class 3 Class 4
(b)
(a)
Figure 15: Convergence results. (a) Convergence of the following methods: 𝐽 + ABC, 𝐽 + AIS, and 𝐽 + DE considering Gaussian mixtures of 8 classes. (b) Convergence of the proposed method (reduced Gaussian mixture).
(a)
(b)
Figure 16: Segmentation results obtained by (a) several methods including 𝐽 + ABC, 𝐽 + AIS, and 𝐽 + DE considering Gaussian mixtures of 8 classes and (b) the proposed method (reduced Gaussian mixture).
In the comparison, the discussion focuses on the following issues: first of all, accuracy; second, convergence; and third, computational cost. Convergence. This section analyzes the approximation convergence when the number of classes that are used by the algorithm during the evolution process is different to the actual number of classes in the image. Recall that the proposed approach automatically finds the reduced Gaussian mixture which better adapts to the image histogram. In the experiment, the methods, 𝐽 + ABC, 𝐽 + AIS, and 𝐽 + DE, are executed considering Gaussian mixtures composed of 8 functions. Under such circumstances, the number of classes to be detected is higher than the actual number of classes in the image. On the other hand, the
proposed algorithm maintains the same configuration of Table 5. Therefore, it can detect and calculate up to ten classes (𝐾 = 10). As a result, the techniques 𝐽 + ABC, 𝐽 + AIS, and 𝐽 + DE tend to overestimate the image histogram. This effect can be seen in Figure 15(a), where the resulting Gaussian functions are concentrated within actual classes. Such a behavior is a consequence of the evaluation that is considered by the original objective function 𝐽, which privileges only the approximation between the Gaussian mixture and the image histogram. This effect can be graphically illustrated by Figure 16(a) that shows the pixel misclassification produced by the wrong segmentation of Figure 14(a). On the other hand, the proposed approach obtains a reduced Gaussian mixture model which allows the detection of each class from
Mathematical Problems in Engineering 0.06
0.06
0.05
0.05
0.04
0.04
Frequency
Frequency
18
0.03 0.02 0.01 0
0.03 0.02 0.01
0
50
100 150 Gray level
200
0
250
0
50
100
200
250
200
250
(b)
0.06
0.05
0.05
0.04
0.04
Frequency
Frequency
(a)
0.06
0.03 0.02
0.03 0.02 0.01
0.01 0
150
Gray level
0
50
100 150 Gray level
Histogram Class 1 Class 2
200
250
Class 3 Class 4
0
0
50
100 150 Gray level
Histogram Class 1 Class 2
Class 3 Class 4
(c)
(d)
Figure 17: Approximation results in terms of accuracy. (a) 𝐽 + ABC, (b) 𝐽 + AIS, (c) 𝐽 + DE, and (d) the proposed 𝐽new + LS approach.
the actual histogram (see Figure 15(b)). As a consequence, the segmentation is significantly improved by eliminating the pixel misclassification, as it is shown by Figure 16(b). It is evident from Figure 15 that the techniques, 𝐽 + ABC, 𝐽 + AIS, and 𝐽 + DE, all need an a priori knowledge of the number of classes that are contained in the actual histogram in order to obtain a satisfactory result. On the other hand, the proposed algorithm is able to find a reduced Gaussian mixture whose classes coincide with the actual number of classes that are contained in the image histogram. Accuracy. In this section, the comparison among the algorithms in terms of accuracy is reported. Most of the reported comparisons [19–26] are concerned about comparing the parameters of the resultant Gaussian mixtures by using real images. Under such circumstances, it is difficult to consider a clear reference in order to define a meaningful error. Therefore, the image defined in Figure 14 has been used in the experiments because its construction parameters are clearly defined in Table 7. Since the parameter values from Table 7 act as ground truth, a simple averaged difference between them and the values that are computed by each algorithm could be used as
comparison error. However, as each parameter maintains different active intervals, it is necessary to express the differences in terms of percentage. Therefore, if Δ𝛽 is the parametric difference and 𝛽 the ground truth parameter, the percentage error Δ𝛽% can be defined as follows: Δ𝛽% =
Δ𝛽 ⋅ 100%. 𝛽
(22)
In the segmentation problem, each Gaussian mixture represents a 𝐾-dimensional model where each dimension corresponds to a Gaussian function of the optimization problem to be solved. Since each Gaussian function possesses three parameters 𝑃𝑖 , 𝜇𝑖 , and 𝜎𝑖 , the complete number of parameters is 3 ⋅ 𝐾 dimensions. Therefore, the final error 𝐸 produced by the final Gaussian mixture is 𝐸=
1 𝐾⋅3 ∑ Δ𝛽 %, 𝐾 ⋅ 3 V=1 V
(23)
where 𝛽V ∈ (𝑃𝑖 , 𝜇𝑖 , 𝜎𝑖 ). In order to compare accuracy, the algorithms, 𝐽 + ABC, 𝐽 + AIS, 𝐽 + DE, and the proposed approach are all executed over the image shown by Figure 14(a). The experiment aims
Mathematical Problems in Engineering
19
(a)
(b)
(c)
(d)
Figure 18: Segmentation results in terms of accuracy. (a) 𝐽 + ABC, (b) 𝐽 + AIS, (c) 𝐽 + DE, and (d) the proposed 𝐽new + LS approach.
to estimate the Gaussian mixture that better approximates the actual image histogram. Methods 𝐽 + ABC, 𝐽 + AIS, and 𝐽 + DE consider Gaussian mixtures composed of 4 functions (𝐾 = 4). In case of the 𝐽new + LS method, although the algorithm finds a reduced Gaussian mixture of four functions, it is initially set with ten functions (𝐾 = 10). Table 8 presents the final Gaussian mixture parameters and the final error 𝐸. The final Gaussian mixture parameters have been averaged over 30 independent executions in order to assure consistency. A close inspection of Table 8 reveals that the proposed method is able to achieve the smallest error (𝐸) in comparison to the other algorithms. Figure 16 presents the histogram approximations that are produced by each algorithm whereas Figure 17 shows their correspondent segmented images. Both illustrations present the median case obtained throughout 30 runs. Figure 18 exhibits that 𝐽 + ABC, 𝐽 + AIS, and 𝐽 + DE present different levels of misclassifications which are nearly absent in the proposed approach case. Computational Cost. The experiment aims to measure the complexity and the computing time spent by the 𝐽 + ABC,
Table 8: Results of the reduced Gaussian mixture in terms of accuracy. Algorithm Gaussian function (1) (2) J + ABC (3) (4) (1) (2) J + AIS (3) (4) (1) (2) J + DE (3) (4) (1) (2) 𝐽new + LS (3) (4)
𝑃𝑖 0.052 0.084 0.058 0.025 0.072 0.054 0.039 0.034 0.041 0.036 0.059 0.020 0.049 0.041 0.052 0.025
𝜇𝑖 44.5 98.12 163.50 218.84 31.01 88.52 149.21 248.41 35.74 90.57 148.47 201.34 40.12 102.04 168.66 110.92
𝜎𝑖 6.4 12.87 8.94 17.5 6.14 12.21 9.14 13.84 7.86 11.97 9.01 13.02 7.5 10.4 8.3 15.2
𝐸 11.79%
22.01%
13.57%
3.98%
20
Mathematical Problems in Engineering J + ABC
J + ABC
J + ABC
J + ABC
J + AIS
J + AIS
J + AIS
J + AIS
J + DE
J + DE
J + DE
J + DE
Jnew + LS
Jnew + LS
Jnew + LS
Jnew + LS
(a)
(b)
(c)
(d)
Figure 19: Images employed in the computational cost analysis.
the 𝐽 + AIS, the 𝐽 + DE, and the 𝐽new + LS algorithm while calculating the parameters of the Gaussian mixture in benchmark images (see Figures 19(a)–19(d)). 𝐽 + ABC, 𝐽 + AIS, and 𝐽 + DE consider Gaussian mixtures that are composed of 4 functions (𝐾 = 4). In case of the 𝐽new + LS method, although the algorithm finds a reduced Gaussian mixture of four functions despite being initialized with ten functions (𝐾 = 10), Table 9 shows the averaged measurements after 30 experiments. It is evident that the 𝐽 + ABC and 𝐽 +
DE are the slowest to converge (iterations) and the 𝐽 + AIS shows the highest computational cost (time elapsed) because it requires operators which demand long times. On the other hand, the 𝐽new + LS shows an acceptable trade-off between its convergence time and its computational cost. Therefore, although the implementation of 𝐽new + LS in general requires more code than most of other evolution-based segmentators, such a fact is not reflected in the execution time. Finally, Figure 19 below shows the segmented images as they are
Mathematical Problems in Engineering
(a)
21
(b)
(c)
(d)
Figure 20: Experimental set used in the evaluation of the segmentation results.
Table 9: Iterations and time requirements of the 𝐽 + ABC, the 𝐽 + AIS, the 𝐽 + DE. and the 𝐽new + LS algorithm as they are applied to segment benchmark images (see Figure 17). Iterations Time elapsed 𝐽 + ABC 𝐽 + AIS 𝐽 + DE 𝐽
new
+ LS
(a)
(b)
(c)
(d)
855 2.72 s 725 1.78 s 657 1.25 s 314 0.98 s
833 2.70 s 704 1.61 s 627 1.12 s 298 0.84 s
870 2.73 s 754 1.41 s 694 1.45 s 307 0.72 s
997 3.1 s 812 2.01 s 742 1.88 s 402 1.02 s
Table 11: Unimodal test functions. Test function 𝑓1 (x) =
∑ 𝑥𝑖2 𝑖=1 𝑛
𝑛
[−100, 100]
0
[−10, 10]𝑛
0
𝑓3 (x) = ∑ (∑ 𝑥𝑗 )
[−100, 100]𝑛
0
𝑓4 (x) = max {𝑥𝑖 , 1 ≤ 𝑖 ≤ 𝑛}
[−100, 100]𝑛
0
[−30, 30]𝑛
0
[−100, 100]𝑛
0
[−1.28, 1.28]𝑛
0
𝑛
𝑓2 (x) = ∑ 𝑥𝑖 + ∏ 𝑥𝑖 𝑖=1 𝑛
𝑖=1
𝑖
𝑖=1
𝑗=1
2
𝑖 𝑛−1
2
2
𝑓5 (x) = ∑ [100 (𝑥𝑖+1 − 𝑥𝑖2 ) + (𝑥𝑖 − 1) ] 𝑖=1 𝑛
𝑓6 (x) = ∑ (𝑥𝑖 + 0.5)
2
𝑖=1 𝑛
Table 10: Evaluation of the segmentation results in terms of the ROS index. Number of classes 𝑁𝑅 = 4 Image (a) 𝐽 + ABC 𝐽 + AIS 𝐽 + DE 𝐽new + LS
0.534 0.522 0.512 0.674
𝑁𝑅 = 3 (b)
𝑁𝑅 = 4 (c)
𝑁𝑅 = 4 (d)
0.328 0.321 0.312 0.401
0.411 0.427 0.408 0.514
0.457 0.437 0.418 0.527
generated by each algorithm. It can be seen that the proposed approach generate more homogeneous regions whereas 𝐽 + ABC, 𝐽 + AIS, and 𝐽 + DE present several artifacts that are produced by an incorrect pixel classification. 7.3. Performance Evaluation of the Segmentation Results. This section presents an objective evaluation of segmentation results that are produced by all algorithms in the comparisons. The ill-defined nature of the segmentation problem makes the evaluation of a candidate algorithm difficult [57]. Traditionally, the evaluation has been conducted by using some supervised criteria [58] which are based on the computation of a dissimilarity measure between a segmentation result and a ground truth image. Recently, the use of unsupervised measures has substituted supervised indexes for the objective evaluation of segmentation results [59]. They
𝑓opt
S
𝑛
𝑓7 (x) = ∑ 𝑖𝑥𝑖4 + rand(0, 1) 𝑖=1
enable the quantification of the quality of a segmentation result without a priori knowledge (ground truth image). Evaluation Criteria. In this paper, the unsupervised index ROS proposed by Chabrier et al. [60] has been used to objectively evaluate the performance of each candidate algorithm. This index evaluates the segmentation quality in terms of the homogeneity within segmented regions and the heterogeneity among the different regions. ROS can be computed as follows: ROS =
𝐷−𝐷 , 2
(24)
where 𝐷 quantifies the homogeneity within segmented regions. Similarly, 𝐷 measures the disparity among the regions. A segmentation result 𝑆1 is considered better than 𝑆2 , if ROS𝑆1 > ROS𝑆2 . The interregion homogeneity characterized by 𝐷 is calculated considering the following formulation: 𝑁
𝐷=
𝜎𝑐 1 𝑅 𝑅𝑐 , ∑ ⋅ 𝑁𝑅 𝑐=1 𝐼 (∑𝑁𝑅 𝜎𝑙 ) 𝑙=1
(25)
where 𝑁𝑅 represents the number of partitions in which the image has been segmented. 𝑅𝑐 symbolizes the number of
22
Mathematical Problems in Engineering J + ABC
J + ABC
J + ABC
J + ABC
J + AIS
J + AIS
J + AIS
J + AIS
J + DE
J + DE
J + DE
J + DE
Jnew + LS
Jnew + LS
Jnew + LS
Jnew + LS
(a)
(b)
(c)
(d)
Figure 21: Segmentation results using in the evaluation.
pixels contained in the partition 𝑐 whereas 𝐼 considers the number of pixels that integrate the complete image. Similarly, 𝜎𝑐 represents the standard deviation from the partition 𝑐. On the other hand, disparity among the regions 𝐷 is computed as follows: 𝑁𝑅 𝑁 𝜇 − 𝜇𝑙 1 𝑅 𝑅𝑐 1 (26) 𝐷= ], ∑ ⋅[ ∑ 𝑐 𝑁𝑅 𝑐=1 𝐼 (𝑁𝑅 − 1) 𝑙=1 255 where 𝜇𝑐 is the average gray level in the partition 𝑐.
Experimental Protocol. In the comparison of segmentation results, a set of four classical images has been chosen to integrate the experimental set (Figure 20). The segmentation methods used in the comparison are 𝐽 + ABC [19], 𝐽 + AIS [20], and 𝐽 + DE [21]. From all segmentation methods used in the comparison, the proposed 𝐽new + LS algorithm is the only one that has the capacity to automatically detect the number of segmentation partitions (classes). In order to conduct a fair comparison, all algorithms have been proved by using the same number
Mathematical Problems in Engineering
23 Table 12: Multimodal test functions.
Test function
S
𝑛
𝑓opt
𝑓8 (x) = ∑ −𝑥𝑖 sin (√𝑥𝑖 )
[−500, 500]𝑛 −418.98 ∗ 𝑛
𝑓9 (x) = ∑ [𝑥𝑖2 − 10 cos (2𝜋𝑥𝑖 ) + 10]
[−5.12, 5.12]𝑛
0
[−32, 32]𝑛
0
[−600, 600]𝑛
0
[−50, 50]𝑛
0
𝑓13 (x) = 0.1 {sin (3𝜋𝑥1 ) + ∑ (𝑥𝑖 − 1) [1 + sin (3𝜋𝑥𝑖 + 1)] + (𝑥𝑛 − 1) [1 + sin2 (2𝜋𝑥𝑛 )]} + ∑ 𝑢(𝑥𝑖 , 5, 100, 4) [−50, 50]𝑛
0
𝑖=1 𝑛 𝑖=1
1 𝑛 1 𝑛 𝑓10 (x) = −20 exp (−0.2√ ∑ 𝑥𝑖2 ) − exp ( ∑ cos (2𝜋𝑥𝑖 )) + 20 𝑛 𝑖=1 𝑛 𝑖=1 𝑛 𝑥𝑖 1 𝑛 2 𝑓11 (x) = ∑ 𝑥 − ∏ cos ( ) + 1 √𝑖 4000 𝑖=1 𝑖 𝑖=1 𝑛−1 𝑛 𝜋 2 2 𝑓12 (x) = {10 sin (𝜋𝑦1 ) + ∑ (𝑦𝑖 − 1) [1 + 10 sin2 (𝜋𝑦𝑖+1 )] + (𝑦𝑛 − 1) } + ∑ 𝑢(𝑥𝑖 , 10, 100, 4) 𝑛 𝑖=1 𝑖=1 𝑚
𝑥 +1 𝑦𝑖 = 1 + 𝑖 4 2
𝑛
𝑘 (𝑥𝑖 − 𝑎) { { { { 𝑢(𝑥𝑖 , 𝑎, 𝑘, 𝑚) = {0 { { { 𝑚 {𝑘 (−𝑥𝑖 − 𝑎) 2
𝑥𝑖 > 𝑎 −𝑎 < 𝑥𝑖 < 𝑎 𝑥𝑖 < −𝑎
2
2
𝑖=1
of partitions. Therefore, in the experiments, the 𝐽new + LS segmentation algorithm is firstly applied to detect the best possible number of partitions 𝑁𝑅 . Once we obtained the number of partitions 𝑁𝑅 , the rest of the algorithms were configured to approximate the image histogram with this number of classes. Figure 21 presents the segmentation results obtained by each algorithm considering the experimental set from Figure 20. On the other hand, Table 10 shows the evaluation of the segmentation results in terms of the ROS index. Such values represent the averaged measurements after 30 executions. From them, it can be seen that the proposed 𝐽new + LS method obtains the best ROS indexes. Such values indicate that the proposed algorithm maintains the best balance between the homogeneity within segmented regions and the heterogeneity among the different regions. From Figure 21, it can be seen that the proposed approach generates more homogeneous regions whereas 𝐽 + ABC, 𝐽 + AIS, and 𝐽 + DE present several artifacts that are produced by an incorrect pixel classification.
8. Conclusions Despite the fact that several evolutionary methods have been successfully applied to image segmentation with interesting results, most of them have exhibited two important limitations: (1) they frequently obtain suboptimal results (misclassifications) as a consequence of an inappropriate balance between exploration and exploitation in their search strategies; (2) the number of classes is fixed and known in advance. In this paper, a new swarm algorithm for the automatic image segmentation, called the Locust Search (LS), has been presented. The proposed method eliminates the typical flaws presented by previous evolutionary approaches by combining a novel evolutionary method with the definition
𝑛
𝑖=1
of a new objective function that appropriately evaluates the segmentation quality with respect to the number of classes. In order to illustrate the proficiency and robustness of the proposed approach, several numerical experiments have been conducted. Such experiments have been divided into two parts. First, the proposed LS method has been compared to other well-known evolutionary techniques on a set of benchmark functions. In the second part, the performance of the proposed segmentation algorithm has been compared to other segmentation methods based on evolutionary principles. The results in both cases validate the efficiency of the proposed technique with regard to accuracy and robustness. Several research directions will be considered for future work such as the inclusion of other indexes to evaluate similarity between a candidate solution and the image histogram, the consideration of spatial pixel characteristics in the objective function, the modification of the evolutionary LS operators to control the exploration-exploitation balance, and the conversion of the segmentation procedure into a multiobjective problem.
Appendix List of Benchmark Functions In Table 11, 𝑛 is the dimension of function, 𝑓opt is the minimum value of the function, and S is a subset of 𝑅𝑛 . The optimum location (xopt ) for functions in Table 11 is in [0]𝑛 , except for 𝑓5 with xopt in [1]𝑛 . The optimum locations (xopt ) for functions in Table 12 are in [0]𝑛 , except for 𝑓8 in [420.96]𝑛 and 𝑓12 -𝑓13 in [1]𝑛 .
Conflict of Interests The authors declare that there is no conflict of interests regarding the publication of this paper.
24
Acknowledgment The present research has been supported under the Grant CONACYT CB 181053.
References [1] H. Zhang, J. E. Fritts, and S. A. Goldman, “Image segmentation evaluation: a survey of unsupervised methods,” Computer Vision and Image Understanding, vol. 110, no. 2, pp. 260–280, 2008. [2] T. Uemura, G. Koutaki, and K. Uchimura, “Image segmentation based on edge detection using boundary code,” International Journal of Innovative Computing, vol. 7, pp. 6073–6083, 2011. [3] L. Wang, H. Wu, and C. Pan, “Region-based image segmentation with local signed difference energy,” Pattern Recognition Letters, vol. 34, no. 6, pp. 637–645, 2013. [4] N. Otsu, “A thresholding selection method from gray-level histogram,” IEEE Transactions on Systems, Man and Cybernetics, vol. 9, no. 1, pp. 62–66, 1979. [5] R. Peng and P. K. Varshney, “On performance limits of image segmentation algorithms,” Computer Vision and Image Understanding, vol. 132, pp. 24–38, 2015. [6] M. A. Balafar, “Gaussian mixture model based segmentation methods for brain MRI images,” Artificial Intelligence Review, vol. 41, no. 3, pp. 429–439, 2014. [7] G. J. McLachlan and S. Rathnayake, “On the number of components in a Gaussian mixture model,” Data Mining and Knowledge Discovery, vol. 4, no. 5, pp. 341–355, 2014. [8] D. Oliva, V. Osuna-Enciso, E. Cuevas, G. Pajares, M. P´erezCisneros, and D. Zald´ıvar, “Improving segmentation velocity using an evolutionary method,” Expert Systems with Applications, vol. 42, no. 14, pp. 5874–5886, 2015. [9] Z.-W. Ye, M.-W. Wang, W. Liu, and S.-B. Chen, “Fuzzy entropy based optimal thresholding using bat algorithm,” Applied Soft Computing, vol. 31, pp. 381–395, 2015. [10] S. Sarkar, S. Das, and S. Sinha Chaudhuri, “A multilevel color image thresholding scheme based on minimum cross entropy and differential evolution,” Pattern Recognition Letters, vol. 54, pp. 27–35, 2015. [11] A. K. Bhandari, A. Kumar, and G. K. Singh, “Modified artificial bee colony based computationally efficient multilevel thresholding for satellite image segmentation using Kapur’s, Otsu and Tsallis functions,” Expert Systems with Applications, vol. 42, no. 3, pp. 1573–1601, 2015. [12] H. Permuter, J. Francos, and I. Jermyn, “A study of Gaussian mixture models of color and texture features for image classification and segmentation,” Pattern Recognition, vol. 39, no. 4, pp. 695–706, 2006. [13] A. P. Dempster, A. P. Laird, and D. B. Rubin, “Maximum likelihood from incomplete data via the EM algorithm,” Journal of the Royal Statistical Society Series B, vol. 39, no. 1, pp. 1–38, 1977. [14] Z. Zhang, C. Chen, J. Sun, and K. L. Chan, “EM algorithms for Gaussian mixtures with split-and-merge operation,” Pattern Recognition, vol. 36, no. 9, pp. 1973–1983, 2003. [15] H. Park, S.-I. Amari, and K. Fukumizu, “Adaptive natural gradient learning algorithms for various stochastic models,” Neural Networks, vol. 13, no. 7, pp. 755–764, 2000. [16] H. Park and T. Ozeki, “Singularity and slow convergence of the em algorithm for gaussian mixtures,” Neural Processing Letters, vol. 29, no. 1, pp. 45–59, 2009.
Mathematical Problems in Engineering [17] L. Gupta and T. Sortrakul, “A Gaussian-mixture-based image segmentation algorithm,” Pattern Recognition, vol. 31, no. 3, pp. 315–325, 1998. [18] V. Osuna-Enciso, E. Cuevas, and H. Sossa, “A comparison of nature inspired algorithms for multi-threshold image segmentation,” Expert Systems with Applications, vol. 40, no. 4, pp. 1213– 1219, 2013. [19] E. Cuevas, F. Senci´on, D. Zaldivar, M. P´erez-Cisneros, and H. Sossa, “A multi-threshold segmentation approach based on artificial bee colony optimization,” Applied Intelligence, vol. 37, no. 3, pp. 321–336, 2012. [20] E. Cuevas, V. Osuna-Enciso, D. Zaldivar, M. P´erez-Cisneros, and H. Sossa, “Multithreshold segmentation based on artificial immune systems,” Mathematical Problems in Engineering, vol. 2012, Article ID 874761, 20 pages, 2012. [21] E. Cuevas, D. Zaldivar, and M. P´erez-Cisneros, “A novel multi-threshold segmentation approach based on differential evolution optimization,” Expert Systems with Applications, vol. 37, no. 7, pp. 5265–5271, 2010. [22] D. Oliva, E. Cuevas, G. Pajares, D. Zaldivar, and V. Osuna, “A multilevel thresholding algorithm using electromagnetism optimization,” Neurocomputing, vol. 139, pp. 357–381, 2014. [23] D. Oliva, E. Cuevas, G. Pajares, D. Zaldivar, and M. PerezCisneros, “Multilevel thresholding segmentation based on harmony search optimization,” Journal of Applied Mathematics, vol. 2013, Article ID 575414, 24 pages, 2013. [24] E. Cuevas, D. Zaldivar, and M. P´erez-Cisneros, “Seeking multithresholds for image segmentation with Learning Automata,” Machine Vision and Applications, vol. 22, no. 5, pp. 805–818, 2011. [25] K. C. Tan, S. C. Chiam, A. A. Mamun, and C. K. Goh, “Balancing exploration and exploitation with adaptive variation for evolutionary multi-objective optimization,” European Journal of Operational Research, vol. 197, no. 2, pp. 701–713, 2009. [26] G. Chen, C. P. Low, and Z. Yang, “Preserving and exploiting genetic diversity in evolutionary programming algorithms,” IEEE Transactions on Evolutionary Computation, vol. 13, no. 3, pp. 661–673, 2009. [27] J. Kennedy and R. Eberhart, “Particle swarm optimization,” in Proceedings of the IEEE International Conference on Neural Networks, pp. 1942–1948, December 1995. [28] R. Storn and K. Price, “Differential Evolution—a simple and efficient adaptive scheme for global optimisation over continuous spaces,” Tech. Rep. TR-95–012, ICSI, Berkeley, Calif, USA, 1995. [29] Y. Wang, B. Li, T. Weise, J. Wang, B. Yuan, and Q. Tian, “Self-adaptive learning based particle swarm optimization,” Information Sciences, vol. 181, no. 20, pp. 4515–4538, 2011. [30] J. Tvrd´ık, “Adaptation in differential evolution: a numerical comparison,” Applied Soft Computing Journal, vol. 9, no. 3, pp. 1149–1155, 2009. [31] H. Wang, H. Sun, C. Li, S. Rahnamayan, and J.-s. Pan, “Diversity enhanced particle swarm optimization with neighborhood search,” Information Sciences, vol. 223, pp. 119–135, 2013. ´ Fialho, Z. Cai, and H. Li, “Adaptive strategy [32] W. Gong, A. selection in differential evolution for numerical optimization: an empirical study,” Information Sciences, vol. 181, no. 24, pp. 5364–5386, 2011. [33] D. M. Gordon, “The organization of work in social insect colonies,” Complexity, vol. 8, no. 1, pp. 43–46, 2002. [34] S. Kizaki and M. Katori, “Stochastic lattice model for locust outbreak,” Physica A: Statistical Mechanics and its Applications, vol. 266, no. 1-4, pp. 339–342, 1999.
Mathematical Problems in Engineering [35] S. M. Rogers, D. A. Cullen, M. L. Anstey et al., “Rapid behavioural gregarization in the desert locust, Schistocerca gregaria entails synchronous changes in both activity and attraction to conspecifics,” Journal of Insect Physiology, vol. 65, pp. 9–26, 2014. [36] C. M. Topaz, A. J. Bernoff, S. Logan, and W. Toolson, “A model for rolling swarms of locusts,” European Physical Journal: Special Topics, vol. 157, no. 1, pp. 93–109, 2008. [37] C. M. Topaz, M. R. D’Orsogna, L. Edelstein-Keshet, and A. J. Bernoff, “Locust dynamics: behavioral phase change and swarming,” PLoS Computational Biology, vol. 8, no. 8, Article ID e1002642, 2012. [38] G. Oster and E. Wilson, Caste and Ecology in the Social Insects, Princeton University Press, Princeton, NJ, USA, 1978. [39] B. H¨olldobler and E. O. Wilson, Journey to the Ants: A Story of Scientific Exploration, 1994. [40] B. H¨olldobler and E. O. Wilson, The Ants, Harvard University Press, Cambridge, Mass, USA, 1990. [41] S. Tanaka and Y. Nishide, “Behavioral phase shift in nymphs of the desert locust, Schistocerca gregaria: special attention to attraction/avoidance behaviors and the role of serotonin,” Journal of Insect Physiology, vol. 59, no. 1, pp. 101–112, 2013. [42] E. Gaten, S. J. Huston, H. B. Dowse, and T. Matheson, “Solitary and gregarious locusts differ in circadian rhythmicity of a visual output neuron,” Journal of Biological Rhythms, vol. 27, no. 3, pp. 196–205, 2012. [43] I. Benaragama and J. R. Gray, “Responses of a pair of flying locusts to lateral looming visual stimuli,” Journal of Comparative Physiology A, vol. 200, no. 8, pp. 723–738, 2014. [44] M. G. Sergeev, “Distribution patterns of grasshoppers and their Kin in the boreal zone,” Psyche, vol. 2011, Article ID 324130, 9 pages, 2011. [45] S. O. Ely, P. G. N. Njagi, M. O. Bashir, S. El-Tom El-Amin, and A. Hassanali, “Diel behavioral activity patterns in adult solitarious desert locust, Schistocerca gregaria (Forsk˚al),” Psyche, vol. 2011, Article ID 459315, 9 pages, 2011. [46] X.-S. Yang, Nature-Inspired Metaheuristic Algorithms, Luniver Press, Beckington, UK, 2008. [47] E. Cuevas, A. Echavarr´ıa, and M. A. Ram´ırez-Orteg´on, “An optimization algorithm inspired by the States of Matter that improves the balance between exploration and exploitation,” Applied Intelligence, vol. 40, no. 2, pp. 256–272, 2014. [48] M. M. Ali, C. Khompatraporn, and Z. B. Zabinsky, “A numerical evaluation of several stochastic algorithms on selected continuous global optimization test problems,” Journal of Global Optimization, vol. 31, no. 4, pp. 635–672, 2005. [49] R. Chelouah and P. Siarry, “Continuous genetic algorithm designed for the global optimization of multimodal functions,” Journal of Heuristics, vol. 6, no. 2, pp. 191–213, 2000. [50] F. Herrera, M. Lozano, and A. M. S´anchez, “A taxonomy for the crossover operator for real-coded genetic algorithms: an experimental study,” International Journal of Intelligent Systems, vol. 18, no. 3, pp. 309–338, 2003. [51] E. Cuevas, D. Zaldivar, M. P´erez-Cisneros, and M. Ram´ırezOrteg´on, “Circle detection using discrete differential evolution optimization,” Pattern Analysis & Applications, vol. 14, no. 1, pp. 93–107, 2011. [52] A. Sadollah, H. Eskandar, A. Bahreininejad, and J. H. Kim, “Water cycle algorithm with evaporation rate for solving constrained and unconstrained optimization problems,” Applied Soft Computing, vol. 30, pp. 58–71, 2015.
25 [53] M. S. Kiran, H. Hakli, M. Gunduz, and H. Uguz, “Artificial bee colony algorithm with variable search strategy for continuous optimization,” Information Sciences, vol. 300, pp. 140–157, 2015. [54] F. Kang, J. Li, and Z. Ma, “Rosenbrock artificial bee colony algorithm for accurate global optimization of numerical functions,” Information Sciences, vol. 181, no. 16, pp. 3508–3531, 2011. [55] F. Wilcoxon, “Individual comparisons by ranking methods,” Biometrics Bulletin, vol. 1, no. 6, pp. 80–83, 1945. [56] S. Garc´ıa, D. Molina, M. Lozano, and F. Herrera, “A study on the use of non-parametric tests for analyzing the evolutionary algorithms’ behaviour: a case study on the CEC’2005 Special Session on Real Parameter Optimization,” Journal of Heuristics, vol. 15, no. 6, pp. 617–644, 2009. [57] R. Unnikrishnan, C. Pantofaru, and M. Hebert, “Toward objective evaluation of image segmentation algorithms,” IEEE Transactions on Pattern Analysis and Machine Intelligence, vol. 29, no. 6, pp. 929–944, 2007. [58] R. Unnikrishnan, C. Pantofaru, and M. Hebert, “A measure for objective evaluation of image segmentation algorithms,” in Proceedings of the IEEE Computer Society Conference on Computer Vision and Pattern Recognition (CVPR ’05), p. 34, San Diego, Calif, USA, June 2005. [59] Y. J. Zhang, “A survey on evaluation methods for image segmentation,” Pattern Recognition, vol. 29, no. 8, pp. 1335–1346, 1996. [60] S. Chabrier, B. Emile, C. Rosenberger, and H. Laurent, “Unsupervised performance evaluation of image segmentation,” EURASIP Journal on Advances in Signal Processing, vol. 2006, Article ID 96306, 12 pages, 2006.
Advances in
Operations Research Hindawi Publishing Corporation http://www.hindawi.com
Volume 2014
Advances in
Decision Sciences Hindawi Publishing Corporation http://www.hindawi.com
Volume 2014
Journal of
Applied Mathematics
Algebra
Hindawi Publishing Corporation http://www.hindawi.com
Hindawi Publishing Corporation http://www.hindawi.com
Volume 2014
Journal of
Probability and Statistics Volume 2014
The Scientific World Journal Hindawi Publishing Corporation http://www.hindawi.com
Hindawi Publishing Corporation http://www.hindawi.com
Volume 2014
International Journal of
Differential Equations Hindawi Publishing Corporation http://www.hindawi.com
Volume 2014
Volume 2014
Submit your manuscripts at http://www.hindawi.com International Journal of
Advances in
Combinatorics Hindawi Publishing Corporation http://www.hindawi.com
Mathematical Physics Hindawi Publishing Corporation http://www.hindawi.com
Volume 2014
Journal of
Complex Analysis Hindawi Publishing Corporation http://www.hindawi.com
Volume 2014
International Journal of Mathematics and Mathematical Sciences
Mathematical Problems in Engineering
Journal of
Mathematics Hindawi Publishing Corporation http://www.hindawi.com
Volume 2014
Hindawi Publishing Corporation http://www.hindawi.com
Volume 2014
Volume 2014
Hindawi Publishing Corporation http://www.hindawi.com
Volume 2014
Discrete Mathematics
Journal of
Volume 2014
Hindawi Publishing Corporation http://www.hindawi.com
Discrete Dynamics in Nature and Society
Journal of
Function Spaces Hindawi Publishing Corporation http://www.hindawi.com
Abstract and Applied Analysis
Volume 2014
Hindawi Publishing Corporation http://www.hindawi.com
Volume 2014
Hindawi Publishing Corporation http://www.hindawi.com
Volume 2014
International Journal of
Journal of
Stochastic Analysis
Optimization
Hindawi Publishing Corporation http://www.hindawi.com
Hindawi Publishing Corporation http://www.hindawi.com
Volume 2014
Volume 2014