Contaminated normal CNd(µ,Σ, δ, Ï) g(u) = c{(1 â δ) exp(âu/2) ... Assuming g(·) continuous and differentiable, it is useful to define the following quantities in the.
Multivariate elliptical models with general parameterization Artur J. Lemonte,
Alexandre G. Patriota
Department of Statistics, University of S˜ao Paulo, S˜ao Paulo/SP, Brazil
Abstract In this paper we introduce a general elliptical multivariate regression model in which the mean vector and the scale matrix have parameters (or/and covariates) in common. This approach unifies several important elliptical models, such as nonlinear regressions, mixed-effects model with nonlinear fixed effects, errors-in-variables models, and so forth. We discuss maximum likelihood estimation of the model parameters and obtain the information matrix, both observed and expected. Additionally, we derived the generalized leverage as well as the normal curvatures of local influence under some perturbation schemes. An empirical application is presented for illustrative purposes. Key words: Elliptical distributions; Generalized leverage; Local influence; Maximum likelihood estimation; Multivariate models.
1
Introduction
It is well known that the normality assumption is not always tenable and alternative distributions (or methodologies) should be considered in such situations. One choice is the elliptical family of distributions which includes the normal one. This class of distributions has received an increasing attention in the statistical literature, particularly due to the fact of including important distributions as, for example, Student-t, power exponential, contaminated normal, among others, with heavier or lighter tails than the normal one. We say that a d × 1 random vector Y has a multivariate elliptical distribution with location parameter µ (d × 1) and a positive definite scale matrix Σ (d × d) if its density function exists, it is given by (Fang et al., 1990) £ ¤ fY (y) = |Σ|−1/2 g (y − µ)> Σ−1 (y − µ) , y ∈ Rd , (1) R∞ d where g : R → [0, ∞) is such that 0 u 2 −1 g(u) < ∞. The function g(·) is known as the density generator. We will denote Y ∼ Ed (µ, Σ, g), or, simply, Y ∼ Ed (µ, Σ). When µ = 0 and Σ = Id , 1
where Id is a d × d identity matrix, we obtain the spherical family of densities. A detailed description of the elliptical multivariate class given in (1) can be found in Fang et al. (1990). Table 1, taken from Galea et al. (2000), reports examples of distributions in the elliptical family.
Distribution
Table 1: Multivariate elliptical distributions.† Notation Generating function
Normal
Nd (µ, Σ)
g(u) = c exp(−u/2),
u≥0
Student-t
td (µ, Σ, ν)
g(u) = c(1 + u/ν)−(ν+d)/2 ,
Contaminated normal
CN d (µ, Σ, δ, τ ) g(u) = c{(1 − δ) exp(−u/2)
u≥0
+δτ −d/2 exp(−u/(2τ ))}, Cauchy
Cd (µ, Σ)
g(u) = c(1 + u)−(d+1)/2 ,
u≥0
Logistic
Ld (µ, Σ)
g(u) = ce−u /(1 + e−u )2 ,
u≥0
Power Exponential
PE d (µ, Σ, α)
g(u) = c exp(−uα /2),
†c
u≥0
u≥0
denotes the normalizing constant.
Assuming g(·) continuous and differentiable, it is useful to define the following quantities in the elliptic context: µ 0 ¶2 d g (u) g 0 (u) d g 00 (u) 0 Wg (u) = log g(u) = and Wg (u) = Wg (u) = − , du g(u) du g(u) g(u) where g 0 (u) = dg(u)/du and g 00 (u) = dg 0 (u)/du. For example, we have µ ¶ µ√ ¶2 ν+d 1 ν+d 1 0 Wg (u) = − and Wg (u) = 2 ν+u 2 ν+u for Student-t distribution with ν degrees of freedom (Lange et al., 1989) and Wg (u) = −
αuα−1 2
Wg0 (u) = −
and
α(α − 1)uα−2 2
for power exponential (G´omes et al., 1998). Multivariate elliptical regression models have been extensively studied in the statistical literature. In fact, some important references are Lange et al. (1989), Welsh and Richardson (1997), Kowalski et al. (1999), Fern´andez and Steel (1999), Galea et al. (2000), Liu (2000, 2002), D´ıaz–Garc´ıa et al. (2003), Cysneiros and Paula (2004), Savalli et al. (2006), D´ıaz–Garc´ıa et al. (2007), Osorio et al. (2007) and Russo et al. (2009), among others. The class of models proposed in this article includes all the models considered in the papers above and several others as special cases, e.g., multivariate errors-in-variables models, either with homoskedastic or heteroskedastic structures, mixed models with some regressors subject to measurement errors, and so forth. Our approach unifies several important models which can be thought from a multivariate elliptical model. Here, the modelling is 2
made directly in the (observable) response variable (in mixed models context, it is known as marginal model). In this paper we introduce a class of multivariate regression models with general parameterization based on the elliptical distribution given in (1). Here, general parameterization has the same meaning as defined by Patriota and Lemonte (2009). We consider that the mean vector and the positive definite scale matrix share parameters. For example, in structural errors-in-variables models some variables cannot be measured exactly, but instead it is observed surrogate variables contaminated with errors. This characteristic makes the mean vector shares parameters with the scale matrix of the observed variables. Thus, the model proposed in this paper is justified. Additionally, we develop local influence diagnostics based on minor perturbations in the data and in the assumed model and derive an expression for the generalized leverage. The rest of the paper is organized as follows. Section 2 presents the model and discusses the estimation of the model parameters by maximum likelihood. We present the score function, Fisher information matrix and an iterative process to obtain the maximum likelihood estimates. Section 3 deals with some basic calculations related with local influence. The normal curvatures of local influence are derived under some perturbation schemes in Section 4. An expression for the generalized leverage is derived in Section 5. A special model is considered in Section 6. Section 7 contains an empirical application. Finally, some concluding remarks are made in Section 8.
2
The model
Let Y1 , Y2 , . . . , Yn be observable independent vectors which the number of responses measured in the ith observation is qi . Following the same idea introduced in Patriota and Lemonte (2009), the multivariate elliptical regression model with general parameterization can be written as Yi = µi (θ) + ui ,
i = 1, 2, . . . , n,
(2)
with ui ∼ Eqi (0, Σi (θ)) and hence Yi ∼ Eqi (µi (θ), Σi (θ)). Also, µi (θ) = µi (θ, xi ) is the mean and Σi (θ) = Σi (θ, wi ) is the positive definite scale matrix, where xi and wi are mi × 1 and ki × 1 nonstochastic vectors of auxiliary variables, respectively, associated with the ith observed response Yi which may have common components. Both µi (θ) and Σi (θ) have known functional forms and are twice differentiable with respect to each element of θ. Additionally, θ = (θ1 , θ2 , . . . , θp )> is a p-vector of unknown parameters of interest (where p < n and it is fixed). Since θ must be identifiable in model (2), the functions µi (θ) and Σi (θ) are defined to accomplish such restriction. It is important to observe that Σi (θ) is proportional to the variance-covariance matrix of Yi by a quantity ξi > 0 which depends on the assumed elliptical distribution. For example, under normal and Student-t models, ξi = 1 and ξi = ν/(ν − 2), respectively, for ν > 2. For further details the reader is referred to Fang et al. (1990).
3
The class of models presented in (2) is quite broad and includes several important statistical models. As a first example, we can mention linear and nonlinear regression models, either homoskedastic or heteroskedastic. Recently, heteroskedastic structural measurement error models have been studied by many authors, for instance, Kulathinal et al. (2002), Cheng and Riu (2006), Kelly (2007), de Castro et al. (2008) and Patriota et al. (2009). These models can also be formulated as in (2). Structural equation models (e.g., Bollen, 1989; Lee et al., 2006) is a rich class of models with latent variables that can be put as in (2). As can be seen, model (2) encompasses a wide range of models and our list of examples is by no means exhaustive. Section 6 presents an important special case that shows the applicability of the general formulation. Let µi = µi (θ, xi ), Σi = Σi (θ, wi ), zi = Yi − µi and ui = zi> Σ−1 i zi . The log-likelihood function associated with (2), except for a constant term, is given by `(θ) =
n X
`i (θ),
(3)
i=1
where `i (θ) = − 12 log |Σi | + log g(ui ). The functions g(·), µi and Σi must be defined in such way that `(θ) be a regular function with respect to θ (Cox and Hinkley, 1974, Ch. 9). To obtain the score function and the Fisher information matrix, we need to derive `(θ) with respect to the unknown parameters and then computing some moments of such derivatives. We suppose that such derivatives exist. To compute the derivatives of `(θ) we make use of matrix differentiation methods (Magnus and Neudecker, 1988). Some additional notation is in order. Let ai(r) =
∂µi , ∂θr
Ci(r) =
∂Σi , ∂θr
−1 Ai(r) = −Σ−1 i Ci(r) Σi ,
for r = 1, 2, . . . , p. Additionally, let à Fi =
! Di , Vi
à !−1 Σi 0 Hi = , 0 2Σi ⊗ Σi
"
# vi zi si = , −vec(Σi − vi zi zi> )
(4)
where Di = ∂µi /∂θ > , Vi = ∂vec(Σi )/∂θ > and vi = −2Wg (ui ). Here, we assume that F = (F1> , F2> , . . . , Fn> ) has rank p, i.e. the functions µi and Σi must be defined to hold such condition. Also, the “vec” operator transforms a matrix into a vector by stacking the columns of the matrix one underneath the other and “⊗” indicates the Kronecker product. These quantities are used to find the derivatives of the log-likelihood function which will be required to compute the score function, Fisher information and all the normal curvatures of local influence. By using the defined quantities in (4) and after some straightforward matrix algebra, the score function for θ can be written as n X (5) Fi> Hi si . Uθ = i=1
4
The expected Fisher information matrix for θ is (see Appendix A) Kθ =
n X
Fi> Hi Mi Hi Fi ,
(6)
i=1
with
" 4d Mi =
Σi qi 0 gi
# " # 0 ³ 0 0 ´ + , 4fgi 8fgi 0 − 1 vec(Σi )vec(Σi )> Σ ⊗ Σ i qi (qi +2) qi (qi +2) i
where dgi = E(Wg2 (Ui )Ui ) and fgi = E(Wg2 (Ui )Ui2 ), with Ui = ||Li ||2 , Li ∼ Eqi (0, Iqi ). Naturally, function g(u) is such that dgi and fgi exist for all i = 1, 2, . . . , n. It is possible to obtain closedform expressions for dgi and fgi for some multivariate elliptical distributions. For example, we have (Mitchell, 1989) µ ¶ µ ¶ qi qi + ν qi (qi + 2) qi + ν and fgi = dgi = 4 qi + ν + 2 4 qi + ν + 2 for Student-t distribution and µ ¶ µ ¶−1 qi − 2 qi α2 dgi = 1/α Γ +2 Γ 2 2α 2α
and
fgi =
qi (qi + 2α) 4
for power exponential, where Γ(·) denotes the gamma function. It should be noticed that matrix Mi has all information about the adopted distribution. Also, note that the expected Fisher information is a quadratic form which can be attained through simple matrix operations. If µi (θ) and Σi (θ) have not parameters in common, i.e. µi (θ) = µi (θ1 ) and Σi (θ) = Σi (θ2 ), where θ = (θ1> , θ2> )> , then Fi = block–diag{Fi (θ1 ), Fi (θ2 )} and the parameter vectors θ1 and θ2 will be orthogonal. It is noteworthy that dgi and fgi may have unknown quantities (for instance, the degrees of freedom ν in the Student-t distribution and the shape parameter α in the power exponential distribution) and one may want to estimate these quantities via maximum-likelihood estimation. However, Lucas (1997) studies some robustness aspects of the Student-t M-estimators using influence functions and shows that the protection against “large” observations is only valid when the degrees of freedom parameter is kept fixed. Therefore, for the purpose of avoiding possible lack of protection against outliers, we do not estimate dgi and fgi by maximum likelihood and instead of it, we kept fixed all quantities involved with them. Otherwise, unboundedness problems may arise for the influence functions and the elliptical distribution will lose its main goal. It is worth emphasizing that, the problem with the influence functions verified by Lucas (1997) is proven only for the Student-t distribution, but it may also happen for other distributions when one estimates dgi and fgi via maximum likelihood (it happens at least with Student-t distribution). This issue is an open problem and needs more attention but it is beyond of the main scope of this paper. In practice, one can use model selection procedures, such as the Akaike information criterion (AIC), to choose the more appropriate values of such unknown parameters.
5
The Fisher scoring method can be used to estimate θ by iteratively solving the equation (F (m)> W (m) F (m) )θ (m+1) = F (m)> W (m) s∗(m) ,
m = 0, 1, . . . ,
(7)
where W (m) = H (m) M (m) H (m) ,
(m)>
F (m) = (F1 (m)
(m)>
, F2
, . . . , Fn(m)> )> ,
(m)
H (m) = block–diag{H1 , H2 , . . . , Hn(m) }, (m)>
M (m) = block–diag{M1
s∗(m) = F (m) θ (m) + H −1(m) M −1(m) s(m) ,
(m)>
, M2
, . . . , Mn(m)> }, (m)>
s(m) = (s1
(m)>
, s2
)> , , . . . , s(m)> n
and m is the iteration counter. Each loop, through the iterative scheme (7), consists of an iterative re-weighted least squares algorithm to optimize the log-likelihood (3). Using equation (7) and any software (for instance, MAPLE, MATLAB, Ox, R, SAS) with a weighted linear regression routine one can compute the MLE θb iteratively. The iterations continue until convergence is achieved (a stopping criterion must be defined). Sometimes this iterative algorithm does not converge, neither find the actual maximum of the likelihood function nor a relative maximum point which is an interior point of a restricted parametric space. In these cases, other numerical methods can be used such as the Gauss-Newton and Quasi-Newton methods. Note that the score function and the Fisher information matrix for θ can be written as, respectively, Uθ = F > Hs and Kθ = F > W F . We have vi = 1 and M = H −1 for the normal model, which implies that W = H. Thus, equations (5)-(7) agree with the result due to Patriota and Lemonte (2009).
3
Local influence
The local influence method is recommended when the concern is related to investigate the model sensitivity under some minor perturbations in the model (or data). Let ω be a k-dimensional vector of perturbations restricted to some open subset Ω of Rk . The perturbed log-likelihood function is denoted by `(θ|ω). We consider that exists a no perturbation vector ω0 ∈ Ω such that `(θ|ω0 ) = `(θ), for all θ. The influence of minor perturbations on the MLE θb can be assessed by using the likelihood b − `(θbω )}, where θbω denotes the maximizer of `(θ|ω). displacement LDω = 2{`(θ) The idea for assessing local influence as advocated by Cook (1986) is essentially the analysis of the local behavior of LDω around ω0 by evaluating the curvature of the plot of LDω0 +ad against a, where a ∈ R and d is a unit direction. One of the measures of particular interest is the direction dmax corresponding to the largest curvature Cdmax . The index plot of dmax may evidence those observations that have considerable influence on LDω under minor perturbations. Also, plots of dmax against covariate values may be helpful for identifying atypical patterns. Cook (1986) showed that the normal ¨ −1 ∆d|, where ∆ = ∂ 2 `(θ|ω)/∂θ∂ω > curvature at the direction d is given by Cd (θ) = 2|d> ∆> L θθ 6
¨ θθ = ∂ 2 `(θ)/∂θ∂θ > , both ∆ and L ¨ θθ are evaluated at θ = θb and ω = ω0 . Moreover, Cdmax and L ¨ −1 ∆ and dmax is the corresponding eigenvector. The is twice the largest eigenvalue of B = −∆> L θθ index plot of dmax may reveal how to perturb the model (or data) to obtain large changes in the estimate of θ. Assume that the parameter vector θ is partitioned as θ = (θ1> , θ2> )> . The dimensions of θ1 and θ2 are p1 and p − p1 , respectively. Let à ! ¨ θ1 θ1 L ¨ θ1 θ2 L ¨ θθ = L , ¨> ¨ θ2 θ2 L L θ1 θ2
¨ θ2 θ2 = ∂ 2 `(θ)/∂θ2 ∂θ > . If the ¨ θ1 θ2 = ∂ 2 `(θ)/∂θ1 ∂θ > and L ¨ θ1 θ1 = ∂ 2 `(θ)/∂θ1 ∂θ > , L where L 2 1 2 ¨ −1 − interest lies on θ1 , the normal curvature in the direction of the vector d is Cd;θ1 (θ) = 2|d> ∆> (L θθ ¨ L22 )∆d|, where à ! 0 0 ¨ 22 = L ¨ −1 0 L θ2 θ2 ¨ −1 − and dmax;θ1 here is the eigenvector corresponding to the largest eigenvalue of B1 = −∆> (L θθ ¨ 22 )∆ (see Cook, 1986). The index plot of the dmax;θ1 may reveal those influential elements on θb1 . L In order to have a curvature invariant under a uniform change of scale, Poon and Poon (1999) introduce the conformal normal curvature Bd (θ) in the direction of the unit vector d, given by ¨ −1 ∆d d> ∆> L θθ , Bd (θ) = − q ¨ −1 ∆)2 } tr{(∆> L θθ b An interesting property of the conformal normal curvature is that evaluated at ω = ω0 and θ = θ. 0 ≤ Bd (θ) ≤ 1. Thus, it can be easily computed once Cd (θ) was obtained. This quantity can be seen as a normalized version of Cd (θ).
4
Curvature calculations
In the section, we derive the matrix ∆ for different perturbation schemes. These matrices are obtained using results of matrix differentiation (Magnus and Neudecker, 1988). We shall consider the caseweight perturbation, scale matrix and response variable perturbation schemes, that is, we derive (for three perturbation schemes) the matrix ¾¯ ½ 2 ∂ `(θ|ω) ¯¯ , i = 1, 2, . . . , k and r = 1, 2, . . . , p, ∆ = {∆ri } = ∂θr ∂ωi ¯θ=θ, b ω=ω0 considering the defined model in (2) and its log-likelihood function given by (3). The quantities b The observed information matrix used in the distinguished by the addition of “b” are evaluated at θ. calculation of the normal curvature is given in Appendix B. 7
4.1
Case weight perturbation
The perturbation of cases is done by attaching some weight to each observation in the log-likelihood P resulting in `(θ|ω) = ni=1 ωi `i (θ), where ω = (ω1 , ω2 , . . . , ωn )> , with ωi ≥ 0, for i = 1, 2, . . . , n, and ω0 = 1n = (1, 1, . . . , 1)> is the vector of no perturbations. Using matrix differentiation rules along with the notations defined in Section 2, we find 1 b −1 bi , bi(r) (Σ b i − vbi zbi zb> )} + vbi a b> ∆ri = tr{A i(r) Σi z i 2
(8)
b for i = 1, 2, . . . , n. In matrix notation, the for r = 1, 2, . . . , p and i = 1, 2, . . . , n. Here, vbi = vi (θ) p × n matrix ∆ can be written as ´ ³ >c >c >c b b b ∆ = F1 H1 sb1 , F2 H2 sb2 , . . . , Fn Hn sbn , where Fi , Hi and si (for i = 1, 2, . . . , n) were defined in Section 2. For normal models, expression (8) reduces to the one derived by Patriota et al. (2010).
4.2
Scale matrix perturbation
The scale matrix perturbation is introduced by considering Yi ∼ Eqi (µi (θ), ωi−1 Σi (θ)),
i = 1, 2, . . . , n,
where ω = (ω1 , ω2 , . . . , ωn )> ∈ Rn − {0} and ω0 = 1n such that `(θ|ω0 ) = `(θ) given in (3). Thus, we have £ > ¤ bi(r) zbi − 2b b −1 zbi , ∆ri = {Wg (b ui ) + u bi Wg0 (b ui )} zbi(r) A a> Σ (9) i(r) i for r = 1, 2, . . . , p and i = 1, 2, . . . , n. In matrix notation, the p × n matrix ∆ takes the form ³ ´ c1 rb1 , Fb > H c2 rb2 , . . . , Fb > H cn rbn , ∆ = Fb1> H 2 n where
"
# b z i rbi = −2{Wg (b ui ) + u bi Wg0 (b ui )} . vec(b zi zbi> )
Expression (9) reduces to the one given by Patriota et al. (2010) for normal models.
4.3
Response perturbation
Here, the response variable Yi is perturbed according to Yi∗ = Yi + ωi , where ωi denotes the qi × 1 perturbation vector and ω = (ω1> , ω2> , . . . , ωn> )> , so that the no perturbation vector is ω0 = 0, P where ω ∈ RN (N = ni=1 qi ). In this case, the perturbed log-likelihood function is also given by P `(θ|ω) = ni=1 `i (θ|ω), where 1 `i (θ|ω) = − log |Σi | + log g(uiw ), 2 8
> where uiw = ziw Σ−1 i ziw , with ziw = zi + ωi . We obtain © ª −1 > b i + 2W 0 (b b b −1 Wg (b ∆ri = −2b a> ui ) Σ zi(r) zbi(r) Σ i(r) Σi g ui )b i © ª −1 > b 0 > b i + W (b b , + 2b z Ai(r) Wg (b ui ) Σ ui )b zi(r) zb Σ i
g
i(r)
(10)
i
for r = 1, 2, . . . , p and i = 1, 2, . . . , n. In matrix notation, the p × N matrix ∆ is given by ³ ´ >c b >c b >c b b b b ∆ = F1 H1 G1 , F2 H2 G2 , . . . , Fn Hn Gn , where
Ã
! > b −1 0 b z W (b u )I + 2W (b u )b z Σ g i i i g i b i = −2 £ i qi ¤ . G > b −1 0 2b zi ⊗ Wg (b ui )Iqi + Wg (b ui )b zi zbi Σi
For normal models the expression (10) reduces to the one given by Patriota et al. (2010).
5
Generalized leverage
Let Y = vec(Y1 , Y2 , . . . , Yn ) and µ(θ) = vec(µ1 , µ2 , . . . , µn ). In what follows we shall use the generalized leverage proposed by Wei et al. (1998). The authors have shown that the generalized leverage is obtained by evaluating the N × N matrix ¨ θθ )−1 L ¨ θY , GL(θ) = Dθ (−L b where Dθ = ∂µ(θ)/∂θ > and L ¨ θY = ∂ 2 `(θ)/∂θ∂Y > . As noted by the authors, the genat θ = θ, eralized leverage is invariant under reparameterization and observations with large GLij are leverage points. The main idea behind the concept of leverage is that of evaluating the influence of Yi on its own predicted value. Under the model defined in (2), we have that Dθ = (D1> , D2> , . . . , Dn> )> and
³ ´ > > > ¨ LθY = F1 H1 G1 , F2 H2 G2 , . . . , Fn Hn Gn .
Index plots of GLii may reveal those observations with high influence on their own predicted values.
6 Special model In order to illustrate the usefulness and applicability of the proposed formulation, we consider a general elliptical mixed-effects model with nonlinear mixed effects and some covariates subject to measurement error. Here, the equation of interest is zi = β0 + β1 xi + f (li , α) + Wi bi + qi , 9
i = 1, 2, . . . , n,
(11)
where zi is a v × 1 latent response vector, xi is a m × 1 latent vector of covariates, β0 is a v × 1 vector of intercepts, β1 is a v × m matrix which elements are inclinations, f (li , α) is a v-dimensional nonlinear function of α, li is a vector of explanatory known covariates, Wi is a v × r matrix of known constants, bi is a r × 1 vector of unobserved random coefficients (random effects of the model) and qi is the equation error. Model (11) is an errors-in-variables nonlinear mixed model which generalizes the one considered in Russo et al. (2009). In model (11) we cannot observe directly the variables zi and xi , instead we observe Zi and Xi , respectively, with the following additive relationship Zi = zi + ei
and
Xi = x i + u i ,
where ei and ui are measurement errors. We consider that the vector of full random vector ri = ¢ ¡ > > > > follows the following elliptical distribution (xi − µx )> , b> i , qi , e i , ui ri ∼ Ed (0, Ωi ), where d = 2v + 2m + r and Ωi = block-diag{Rx (σ1 ), Rb (σ2 ), Rq (σ3 ), τei , τui }, with τei and τui the variances of the measurement errors assumed to be known for all i = 1, . . . , n. These “known” matrices may be attained, for example, through an analytical treatment of the data collection mechanism, replications, machine precision, etc. Here, we consider that the matrices Rx = Rx (σ1 ), Rb = Rb (σ2 ) and Rq = Rq (σ3 ) are completely specified by the vectors of parameters σ1 , σ2 and σ3 , respectively. Therefore, the marginal distribution for the observable vector Yi = (Zi> , Xi> )> is Yi ∼ Ed (µi (θ), Σi (θ)), where
"
µzi µi (θ) = µx
# and
à ! Σzi + τzi β1 Rx Σi (θ) = , Rx β1> Rx + τxi
with µzi = β0 + β1 µx + f (li , α), Σzi = β1 Rx β1> + Wi Rb Wi> + Rq . In this model, θ = > > > > > (β0> , vec(β1 )> , µ> x , α , σ1 , σ2 , σ3 ) . Note that the mean vector and the covariance-variance matrix of observed variables have the matrix β1 in common, i.e. they share mv parameters. Kulathinal et al. (2002) study the linear univariate case under normality (i.e. v = 1, m = 1, f = 0 and D = 0). Notice that the matrix Fi is the only thing that we have to find for computing all quantities presented in this paper. For this special model, it is given by à ! (1) (2) (3) (4) Di Di Di Di 0 0 0 Fi = (2) (5) (6) (7) , 0 Vi 0 0 Vi Vi Vi (1)
(3)
(2)
(4)
(2)
= ∂µi /∂α> , Vi = where Di = ∂µi /∂β0> , Di = ∂µi /∂vec(β1 )> , Di = ∂µi /∂µ> x , Di (7) (6) (5) ∂vec(Σi )/∂vec(β1 )> , Vi = ∂vec(Σi )/∂σ1 )> , Vi = ∂vec(Σi )/∂σ2> and Vi = ∂vec(Σi )/∂σ3> . As a special case of the model above we have the nonlinear mixed model considered by Russo
10
et al. (2009), which emerges by taking θ = (α> , σ2> , σ32 )> , Yi = Zi , µi = f (li , α), Σi = Wi DWi> + σ32 Iqi and the matrix Fi becomes à ! Di 0 Fi = , 0 Vi where Di = ∂µi /∂α> and Vi = ∂vec(Σi )/∂γ > with γ = (σ2 , σ32 )> . Other special models are nonlinear heteroscedastic models, nonlinear model with a first-order autoregressive covariance matrix to the error terms, heteroscedastic multivariate errors-in-variables models, among several others. As can be seen, several important models can be adjusted just by appropriately defining the vector of parameters θ, the location function µi (θ), the dispersion function Σi (θ) and the modelspecification matrix Fi . With this, all the quantities derived in this paper become available.
7 Application In this section, for illustrative purposes, we analyze the radioimmunoassay data, reported in Tiede and Pagano (1979), which were obtained from the Nuclear Medicine Department of the Veteran’s Administration Hospital, Buffalo, New York. All the computations were done using the Ox matrix programming language (Doornik, 2006). Ox is freely distributed for academic purposes and available at http://www.doornik.com. Following Tiede and Pagano (1979) we shall consider the nonlinear regression model yi = θ1 +
θ2 + ui , 1 + θ3 xθi 4
i = 1, 2, . . . , 14,
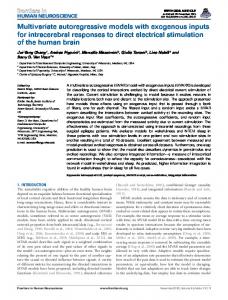
where the response variable is the observed count, the covariate corresponds to the dose (measured in micro-international units per milliliter) and the errors follow an appropriate elliptical distribution. According to Tiede and Pagano (1979), the model above yields parameters which have physical interpretations, i.e. the estimate of θ1 is an estimate of the background counts or noise. The zero dose count is estimated by the estimate of θ2 and the midrange of the assay, also referred to as the effective dose for 50% response is estimated by the estimate of θ4 . The estimated value of this parameter, which is in the neighborhood of 1.0, provides an indication of the sharpness of the bend in the curve. For further details the reader is referred to Tiede and Pagano (1979). Maximum likelihood estimates of the model parameters for the normal and Student-t (with ν = 4) models are presented in Table 2 as well as the corresponding approximate standard errors. We have considered ν = 4 for the Student-t model for modeling the current data based on the arguments given in Lange et al. (1989, Example 2). Additionally, the scale parameter is assumed to be known for both models. From Table 2 all the parameters seem to be highly significant for the adopted models. Figure 1 gives the scatter-plot of the data, together with the fitted curves of the normal and Student-t models. As can be seen from this figure, the t model fits satisfactorily to the radioimmunoassay data. 11
Table 2: Maximum likelihood estimates and standard errors in parentheses. Model Parameter Normal Student-t θ1 444.8649 (1.4326) 929.2840 (0.9075) θ2 7549.7624 (1.7093) 6881.7149 (1.3252) θ3 0.1329 (0.0001) 0.0781 (0.0001) θ4 0.9583 (0.0004) 1.3562 (0.0006)
8 7
+ +
normal Student−t
+ +
counts (x 1000)
6 +
5
+ 4 + +
3
+ 2 + +
+ +
1 0
20
40
60
80
dose (micro−international units/ml)
Figure 1: Scatter-plot and the fitted models.
12
100
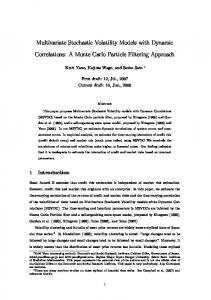
In what follows we shall apply the local influence method developed in the previous sections for the purpose of identifying influential observations in the normal and Student-t regression models fitted to the data. In order to consider the general results derived before, we define θ = (θ1 , θ2 , θ3 , θ4 )> and µi (θ) = θ1 + θ2 /(1 + θ3 xθi 4 ), for i = 1, 2, . . . , 14. We have that µ ¶ 1 θ2 xθi 4 θ2 θ3 xθi 4 log(xi ) Fi = 1 − − 1 + θ3 xθi 4 (1 + θ3 xθi 4 )2 (1 + θ3 xθi 4 )2 and hence the quantities derived in this paper become available. Figure 2 presents the index plots b From this figure we can notice that case #9 of |dmax | for the maximum likelihood estimate of θ, θ. appears as the most influential for the normal model. However, for the Student-t model the influence of case #9 reduces substantially, even though some points appear with moderate influence. Based
Normal 1.0
Student−t 1.0
9
0.8
0.8
0.6
0.6
12
dmax
dmax
11
13
0.4
0.4
0.2
0.2
0.0
0.0 2
4
6
8
10
12
14
2
4
Index
6
8
10
12
14
Index
b Figure 2: Index plots of |dmax | for θ. on Figure 2, we eliminated those most influential observations and refitted the normal and Studentt models. In Table 3 we have the relative changes of each parameter estimate, defined by RC = |(θbj − θbj(i) )/θbj | × 100%, where θbj(i) denotes the maximum likelihood estimate of θj , after removing the ith observation. It should be noticed from Table 3 that the relative changes for the maximum likelihood estimates of the parameters of the Student-t model are very little pronounced. On the other hand, the maximum likelihood estimates of the parameters of the normal model are extremely affected by the indicated cases, mainly by the case #9. According to Tiede and Pagano (1979) this case is an outlier. Therefore, this table confirms the robustness of the Student-t model against the extreme values.
13
Table 3: Relative changes (%) dropping the cases indicated. Normal Student-t b b b b b Dropping θ1 θ2 θ3 θ4 θ1 θb2 θb3 #9 107.51 7.12 35.50 38.86 0.00 0.00 0.04 #11 15.95 0.88 3.02 0.76 0.00 0.01 0.09 #12 11.65 0.65 2.20 0.56 0.00 0.01 0.00 #13 15.19 0.91 0.35 1.23 0.01 0.00 0.04
8
θb4 0.00 0.02 0.01 0.00
Concluding remarks
In this paper, we introduce a multivariate elliptical model with general parameterization which unifies several important models (e.g., (non)linear regressions models, (non)linear mixed models, errors-invariables models, and so forth). We also consider diagnostic techniques that can be employed to identify influential observations. Appropriate matrices for assessing local influence on the parameter estimates under different perturbation schemes are obtained. Although the complexity of the postulated model, the expressions derived in this paper are simple, compact and can be easily implemented into any mathematical or statistical/econometric programming environment with numerical linear algebra facilities, such as R (R Development Core Team, 2009) and Ox (Doornik, 2006), among others, i.e. our formulas related with this class of models are manageable, and with the use of modern computer resources, may turn into adequate tools comprising the arsenal of applied statisticians. Finally, an empirical application to a real data set is presented.
Acknowledgments We thank two anonymous referees and an Associate Editor for helpful suggestions. We gratefully acknowledge grants from FAPESP (Brazil).
A Appendix In what follows, we shall derive the Fisher information matrix presented in Section 2, equation (6). As we are considering a function g with regular properties (differentiation and integration are interchangeable), we have that E(si ) = 0 and the Fisher information for θ is obtained as n ¢ ¡ ¢ X ¡ Fi> Hi E si s> E Uθ Uθ> = i Hi Fi . i=1
14
Note that ¡
¢ >
E si si
"
# ¡ ¢ ¡ ¢ E vi2 zi zi> −E vi zi vec(Σi − vi zi zi> )> ¢ . ¡ ¢ ¡ = −E vi vec(Σi − vi zi zi> )zi> E vec(Σi − vi zi zi> )vec(Σi − vi zi zi> )>
Thus, by adapting the results of Mitchell (1989) for a matrix version, we have the following expectations: ¡ ¢ 1. E vi zi = 0, ¡ ¢ 2. E vi zi zi> = Σi , ¡ ¢ 4dgi 3. E vi2 zi zi> = Σi , qi ¡ ¢ 4. E vi2 vec(zi zi> )zi> = 0, ¡ ¢ 5. E vi2 vec(zi zi> )vec(zi zi> )> =
¢ 4fgi ¡ vec(Σi )vec(Σi )> + 2Σi ⊗ Σi , qi (qi + 2)
where zi ∼ Eqi (0, Σi (θ)). Therefore, the main result follows ¡
¢ >
E si si
B
" 4d
Σi qi 0 gi
=
# " # 0 ³ 0 0 ´ + . 4fgi 8fgi − 1 vec(Σi )vec(Σi )> 0 Σ ⊗ Σ i qi (qi +2) qi (qi +2) i
Appendix
¨ θθ , where, after some algebraic manipulation, The observed information matrix for θ is given by −L · ¸¾ n ½ X £ > ¤ ∂Fi ∂ 2 `(θ) > ¨ ¨ Lθθ = = Fi Hi Mi Hi Fi + si Hi , ∂θ∂θ > ∂θ i=1 with # > Σ 2z ⊗ Σ i i i ¨ i = 2Wg (ui ) M 2Σi ⊗ zi 2(Σi ⊗ (zi zi> ) + (zi zi> ) ⊗ Σi ) # " # " 0 0 zi> ⊗ (zi zi> ) zi zi> 0 + . + 4Wg (ui ) 0 2Σi ⊗ Σi (zi zi> ) ⊗ zi vec(zi zi> )vec(zi zi> )> "
Note that ∂Fi /∂θ is an array of dimension qi (qi +1)×p×p. Here, [·][·] represents the bracket product of a matrix by an array as defined by Wei (1998, p. 188).
15
References Bollen, K. A. (1989). Structural Equations with Latent Variables. Wiley, New York. Cheng, C.L., Riu, J. (2006). On estimating linear relationships when both variables are subject to heteroscedastic measurement errors. Technometrics. 48:511–519. Cook, R. D. (1986). Assessment of local influence (with discussion). Journal of the Royal Statistical Society B. 48:133–169. Cox, D.R., Hinkley, D.V. (1974). Theoretical Statistics. London: Chapman and Hall. Cysneiros, F.J.A., Paula, G.A. (2004). One-sided test in linear models with multivariate t-distribution. Communication in Statistics – Theory and Methods. 33:747–771. de Castro, M., Galea, M., Bolfarine, H. (2008). Hypothesis testing in an errors-in-variables model with heteroscedastic measurement errors. Statistics in Medicine. 27:5217–5234. D´ıaz–Garc´ıa, J.A., Galea, M., Leiva, V. (2003). Influence diagnostics for elliptical multivariate linear regression models. Communication in Statistics – Theory and Methods. 32:625–641. D´ıaz–Garc´ıa, J.A., Guti´errez–J´aimez, R. (2007). The distribution of residuals from a general elliptical distribution. Journal of Statistics Planning and Inference. 137:2347–2354. Doornik, J.A. (2006). An Object-Oriented Matrix Language – Ox 4, 5th ed. Timberlake Consultants Press, London. Fang, K.T., Kotz, S., Ng, K.W. (1990). Symmetric Multivariate and Related Distributions. Chapman and Hall, London. Fern´andez, C., Steel, M.F.J. (1999). Multivariate Student-t regression models: pitfalls and inference. Biometrika. 86:153–167. Galea, M., Riquelme, M., Paula, G.A. (2000). Diagnostic methods in elliptical linear regression models. Brazilian Journal of Probability and Statistics. 14:167–184. G´omez, E., G´omez–Villegas, M.A., Mart´ın, J.M. (1998). A multivariate generalization of the power exponential family of distributions. Communications in Statistics, Theory and Methods. 27:589–600. Kelly, B.C. (2007). Some aspects of measurement error in linear regression of astronomical data. The Astrophysical Journal. 665:1489–1506. Kulathinal, S.B., Kuulasmaa, K., Gasbarra, D. (2002). Estimation of an errors-in-variables regression model when the variances of the measurement error vary between the observations. Statistics in Medicine. 21:1089– 1101.
16
Kowalski, J., Mendoza–Blanco, J.R., Tu, X.M., Gleser, L.J. (1999). On the difference in inference and prediction between the joint and independent t-error models for seemingly unrelated regressions. Communication in Statistics – Theory and Methods. 28:2119–2140. Lange, K.L., Little, R.J.A., Taylor, J.M.G. (1989). Robust statistical modeling using the t distribution. Journal of the Americam Statistical Association. 84:881–896. Lee, S.Y., Lu, B., Song, X.Y. (2006). Assessing local influence for nonlinear structural equation models with ignorable missing data. Computational Statistics and Data Analysis. 50:1356–1377. Liu, S. (2000). On local influence for elliptical linear models. Statistical Papers. 41:211–224. Liu, S. (2002). Local influence in multivariate elliptical linear regression models. Linear Algebra Application. 354:159–174. Lucas, A. (1997). Robustness of the student t based M-estimator. Communications in Statistics, Theory and Methods. 26:1165–1182. Magnus, J.R., Neudecker, H. (1988). Matrix differential calculus with applications in Statistics and Econometrics. Wiley: New York. Mitchell, A.F.S. (1989). The information matrix, skewness tensor and α-connections for the general multivariate elliptical distribution. Annals of the Institute of Statistical Mathematics. 41:289–304. Osorio, F., Paula, G.A., Galea, M. (2007). Assessment of local influence in elliptical linear models with longitudinal structure. Computational Statistics and Data Analysis. 51:4354–4368. Patriota, A.G., Bolfarine, H., de Castro, M. (2009). A hetroscedastic errors-in-variables model with equation error. Statistical Methodology. 6:408–423. Patriota, A.G., Lemonte, A.J. (2009). Bias correction in a multivariate regression model with genereal parameterization. Statistics and Probability Letters. 79:1655–1662. Patriota, A.G., Lemonte, A.J., de Castro, M. (2010). Influence diagnostics in a multivariate normal regression model with general parameterization. Statistical Methodology. 7:644–654. Poon, W.Y., Poon, Y.S. (1999). Conformal normal curvature and assessment of local influence. Journal of the Royal Statistical Society B. 61:51–61. R Development Core Team (2009). R: A Language and Environment for Statistical Computing. Vienna, Austria. Russo, C.M., Paula, G.A., Aoki, R. (2009). Influence diagnostics in nonlinear mixed-effects elliptical models. Computational Statistics and Data Analysis 53, 4143–4156. Savalli, C., Paula, G.A., Cysneiros, F.J.A. (2006). Assessment of variance components in elliptical linear mixed models. Statistical Modeling. 6:59–76.
17
Tiede, J.J., Pagano, M. (1979). Application of robust calibration to radioimmunoassay. Biometrics. 35:567–574. Wei, B.C. (1998). Exponential Family Nonlinear Models. Singapore: Springer. Wei, B.C., Hu, Y.Q., Fung, W.K. (1998). Generalized leverage and its applications. Scandinavian Journal of Statistics. 25:25–37. Welsh, A.H., Richardson, A.M. (1997). Approaches to the robust estimation of mixed models. In: Maddala, G.S., Rao, C.R. (Eds.), Handbook of Statistics, vol. 15. Elsevier Science, Amsterdam, pp. 343–384.
18