Mystery of the Lyα Blobs. J. W. Colbert,1 H. Teplitz,1 P. Francis,2 P. Palunas,3 G. M. Williger4 and B. Woodgate5. 1 Spitzer Science Center, California Institute of ...
The 2nd Spitzer Conference: Infrared Diagnostics of Galaxy Evolution c ASP Conference Series, Vol. 381, 2008 Ranga-Ram Chary, Harry I. Teplitz, Kartik Sheth, eds.
Mystery of the Lyα Blobs J. W. Colbert,1 H. Teplitz,1 P. Francis,2 P. Palunas,3 G. M. Williger4 and B. Woodgate5 1
Spitzer Science Center, California Institute of Technology, Pasadena, CA 91125 2 Research School of Astron. & Astrophys., Australian National University, Canberra, ACT 0200, Australia 3 McDonald Observatory, University of Texas, Austin, TX 78712 4 Dept. of Physics & Astronomy, University of Louisville, Louisville, KY 40292 5 NASA Goddard Space Flight Center, Greenbelt, MD 20771 Abstract. We present Spitzer Space Telescope observations of the extended Lyman α blobs associated with the z=2.38 over-density J2143-4423, the largest known structure (110 Mpc) above z=2. We detect all 4 of the Lyα blobs in all four IRAC channels and we also detect 3 out of 4 of the blobs with MIPS 24µm. Conversion from rest-wavelength 7µm to total far-infrared luminosity using locally derived correlations suggests all the detected sources are in the class of ULIRGs or even Hyper-LIRGs. We find a weak correlation between Lyα and mid-infrared emission for the Lyα blobs (LLyα /Lbol = 0.05-0.2%). Nearly all Lyα blobs show some evidence for interaction, either in HST imaging, or the proximity of multiple MIPS sources within the Lyα cloud. This suggests that interaction or even mergers may be related to the production of Lyα blobs. Optical through infrared SEDs of the Lyα blobs do not show a clear 1.6µm bump, but rather are indicative of a composite of star formation and AGN energy sources.
1.
Introduction
The Lyα blob is a relatively new class of objects found among high-redshift galaxy over-densities ref (2007). While similar in extent (∼100 kpc) and Lyα flux (∼ 1044 ergs s−1 ) to high-redshift radio galaxies, blobs are radio quiet and are therefore unlikely to arise from interaction with jets. Current surveys have reported the discovery of roughly 10 of these giant Lyα blobs, but they are not isolated high redshift oddities. Matsuda et al. (2004; ref 2007) have demonstrated that the blobs are part of a continuous distribution of resolved (>16 arcsec2 ) Lyα emitters, with more than 40 presently known. One of the standing mysteries of the blob is the source of their energy, as there is not enough rest-wavelength ultraviolet light visible along the line of sight from the host galaxies to excite such a vast quantity of hydrogen gas. One possibility is that the Lyα blobs are powered by supernova-driven superwinds ref (2007), driving great plumes of gas into the surrounding ambient medium and producing shocks. An obscured AGN is another model, with the exciting ultraviolet illumination escaping along different lines of sight ref (2007). Cooling flows have also been suggested ref (2007) as a possible Lyα power source. 468
Mystery of the Lyα Blobs 2.
469
Observations
We focus on the four known Lyα blobs found within the J2143-4423 over-density located at z = 2.38 ref (2007). This high-redshift elongated string of galaxies extends over 110 Mpc, making it the largest known structure above z = 2, comparable in size to some of the largest structures seen in the local Universe (i.e. the Great Wall ref (2007)). Initially identified from narrow-band imaging tuned to Lyα, it has since been spectroscopically confirmed ref (2007,?). Our data were obtained using the Multiband Imaging Photometer for Spitzer (MIPS; ref 2007) in 24 µm photometry mode during October and November of 2004 and the Infrared Array Camera (IRAC; ref 2007) in May of 2005. The observation mapped the central area of the filament structure, covering an area approximately 15×25 arcminutes. The final integration time per pixel for both MIPS and IRAC was ∼1800 seconds, reaching 5σ limits of roughly 1, 1, 10, 15, and 80 µJy for 3.6, 4.5, 5.8, 8.0, and 24µm respectively.
3.
Infrared Detections of Lyα Blobs
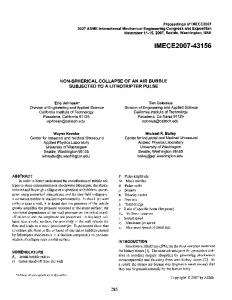
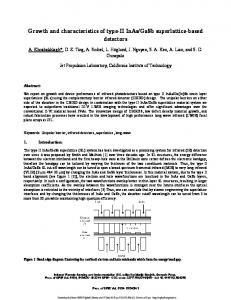
There is growing evidence that Lyman α blobs mark regions of extreme infrared luminosity. Submillimeter flux has been detected in two of the larger known Lyα blobs, SMM J221726+0013 ref (2007) and SMM J17142+5016 ref (2007). More recently, Geach et al. (2005; ref 2007) has detected submm flux from four of the smaller (< 55 square arcsec) and less luminous (< 2×1043 L⊙ ) Lyα blobs from Matsuda et al. (2004; ref 2007): LAB5, LAB10, LAB14 & LAB18. Also, Dey et al. (2005; ref 2007) has discovered a single Lyα blob (SST24 J1434110+331733) in the NOAO Deep Wide-Field Survey with strong 24µm flux (0.86 mJy). We continue to find evidence of strong infrared activity in these sources, detecting three of the four filament Lyα blobs with MIPS 24µm. For two of the blobs, the coordinates for the centers of the MIPS and Lyα sources agree to less than an arcsecond, while Blob B7 has a separation of 2.5 ′′ between Lyα and MIPS centroids. This separation is significantly less than the MIPS FWHM: 5.9′′ and well within the large area covered by extended Lyα emission. Accounting for source brightness the probability of chance superposition is below 0.3% for all sources. Two of the Lyα blobs, B6 and B7, appear to have additional MIPS sources associated with them. The B6 Lyα blob extends over 25′′ , or over 200 kpc at z=2.38, and contains more than one knot or concentration (see Figure 1). The brightest Lyman α knot is the central one and it is associated with a bright MIPS source, but the southern knot (not to be confused with the large diffuse area to the southeast) also has a MIPS source of almost identical brightness. There is also an area of more diffuse Lyman α emission to the north which also appears to be associated with a bright MIPS source. Each source is separated by approximately 9.3′′ from the central source, creating a potential triple system. However, examination of the optical through IRAC colors of the northern source reveal that it must lie at a lower redshift. The center of the B7 Lyα blob actually lies between two sources. We have associated it with the brighter, closer MIPS source 2.5′′ to its southeast, but a second source lies 5.5′′ to the northwest. While there is a ∼ 10% chance
470
Colbert et al.
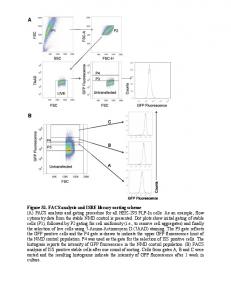
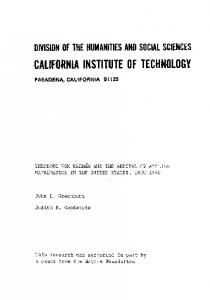
Figure 1. Images of the 40′′ ×40′′ field around the MIPS-detected Lyα blob B6. Starting top left and moving clockwise the images are CTIO B-band, MIPS 24µm, IRAC 8.0µm, and IRAC 4.5µm. Overlaid over all four images is the outer contour of Lyα-emission. One arcsecond corresponds to 8kpc at z=2.38.
the second object could be chance association, the location of the Lyman α blob immediately between the two MIPS sources suggests a possible physical connection. 4.
Ultraviolet-Bright ULIRGs
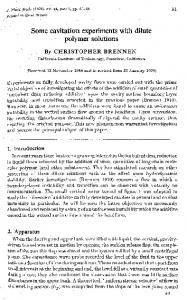
The detected 24µm flux densities range from 0.2 to 0.6 mJy, which at z=2.38 corresponds to roughly 4×10¹¹ to 1012 L⊙ in rest frame 7µm νF ν. To convert from the mid-infrared to total infrared luminosity, we use the relationship from Chary & Elbaz (2001; ref 2007), calibrated by examining galaxies measured with both ISO and IRAS. Even using conservative mid-infrared conversions puts all the sources in the class of ultra luminous infrared galaxies (ULIRGs; > 1012 L⊙ ), or Hyper-LIRGs (> 1013 L⊙ ; see Figure 2). 4.1.
Lyα/Mid-IR Relation
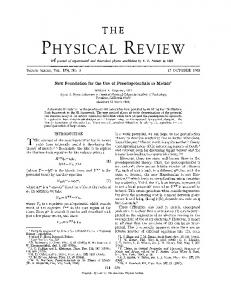
A strong correlation between ultraviolet and mid-infrared flux would indicate both emission processes are powered by the same energy source. We can examine this possibility by combining our sample with all the identified blobs with confirmed infrared or submillimeter detections. We plot Lyα versus total bolometric luminosity (Lbol ) in Figure 2. Applying a similar analysis, Geach et al. (2005; ref 2007) found a weak Lyα/Mid-IR relation for their submm-detected Lyα blobs with a typical LLyα /Lbol
Mystery of the Lyα Blobs
471
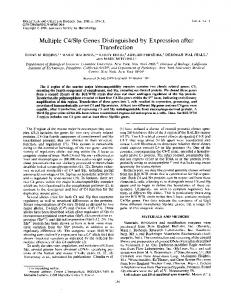
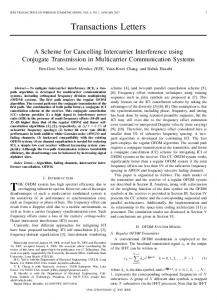
Figure 2. Log Lyα luminosity versus log total bolometric luminosity for high-z Lyα blob ULIRGs. The dashed line marks where the LLyα /Lbol ratio = 0.001. The four blobs from this study are solid squares while the Dey et al. (2005; ref 2007) MIPS source is an asterisk. The sub-mm detections of Lyα blobs are the open triangles ref (2007), circles ref (2007), and diamonds ref (2007). The open square is the non-detected blob average from Geach et al. (2005; ref 2007).
ratio just under 0.1%. Including our 24µm-detected Lyα blobs, which are generally brighter in Lyα than most of the Geach et al. objects, we continue to see the same weak trend, with a LLyα /Lbol efficiency of 0.05-0.2%. While this relation is still tentative, it suggests a direct causal connection between the ULIRG infrared luminosity and the Lyα blobs. 5. 5.1.
Nature of the Lyα Blob Powered by Merger?
The high rate of MIPS detection for the Lyα blobs (75%) demonstrates that these ultraviolet sources are locations of tremendous infrared energy. Two of the Lyα blobs (B6 & B7) seem to be associated with multiple MIPS sources, suggesting a possible interaction or even merger. These separations between possible associated ULIRG component galaxies are large (60-70 kpc) compared to the typical low-redshift ULIRG, which have a median separation around 2 kpc ref (2007). However, interacting ULIRGs with wide separations on the scale of 50 kpc do exist ref (2007), and seem to occur when at least one the interacting galaxies is highly gas-rich ?. Previous high resolution HST imaging also indicates a possible Lyα blob connection to merging galaxies. For instance, NICMOS imaging of blob B1 shows a pair of compact, red galaxies with a projected separation of less than 7 kpc ref (2007). Only three other Lyα blobs have been imaged with HST: the blobs in the field of 53W002, one of which shows a second nearby galaxy ref (2007), and blob SSA22a-C11 which STIS imaging shows to be composed of several likely interacting components ref (2007).
472
Colbert et al.
In the local universe, the most energetic mergers are associated with the ULIRGs, with roughly 90% of all ULIRGs clearly interacting ref (2007). The majority of local ULIRG mergers are between two low mass (0.3-0.5 L∗ ) galaxies ref (2007), but major mergers of high-mass galaxies, like those predicted to build giant ellipticals, must be occurring at higher redshift. If merger-induced star formation is the source of the majority of the infrared flux in these objects, it implies star formation rates of 1000s of M⊙ yr−1 , like those suggested for some sub-mm sources ref (2007). Such massive SFRs would be capable of generating the supernova kinetic energy needed to drive a superwind and power the Lyα blobs. If supernovas deposit roughly 1049 ergs per solar mass of stars into the surrounding medium ref (2007), a star formation rate of 1000 M⊙ yr−1 will easily match the ∼ 1051 ergs yr1 emitted by the blobs, even at a low efficiency. Mergers could also help drive gas inwards into a supermassive black hole, making AGN another viable infrared energy source, with escaping ultraviolet radiation driving the Lyα blobs. Previous HST WFPC2 imaging of nine moderate redshift (z=0.45-1.33) Hyper-LIRGs showed only three interacting systems compared to six point-like QSOs ref (2007), showing that at low to moderate redshifts, higher energy sources appear to be AGN-powered. Eight of those nine Hyper-LIRG systems also showed some sort of nearby companion. Cooling flows also remain a possibility, as it might be common to find multiple galaxies merging at the center of such a large inward flow of gas. It does become a less favored model, however, as the energy from the cooling gas in no longer required to power the Lyα blobs. The ULIRGs would appear to have more than enough energy in their budget to do so on their own. 5.2.
Optical through IRAC SEDs
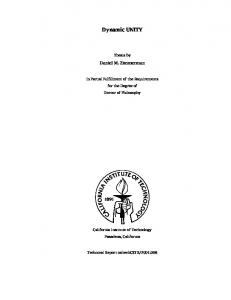
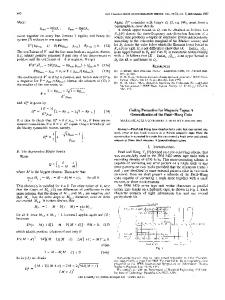
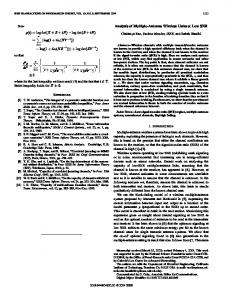
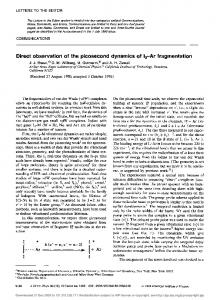
We can gain further information on the origin of the energy for these sources by examining the optical through infrared SEDS, particularly the IRAC bands (Figure 3). We detect 3 of the 4 Lyα blobs in the near-infrared and all four of the Lyα blobs in all the IRAC bands. The three near-IR detected blobs show a clear 4000˚ A break at the expected location for a source at a redshift of z=2.38. A galaxy whose energy output is dominated by star formation is predicted to have a strong 1.6µm bump ref (2007), which would be located in channel 3 (∼ 5.5µm) at this redshift. None of the Lyα blobs show this clear 1.6µm bump. However, neither is there a steep rise from channels 3 to 4, which would be a clear indication of domination by an AGN. It is therefore likely these Lyα blobs are composite sources, containing at least moderate amounts of both star formation and AGN activity. Although an AGN can make up a significant percentage of the total flux at 2-5µm, where they dominate the hot dust, they do not necessarily contribute more than a tiny amount to the total bolometric luminosity ref (2007). Therefore longer wavelength observations will be required to properly identify the primary source of the Lyα blob’s energy. We note that the IRAC spectrum of B5 is not consistent with that of a z=2.38 galaxy, despite the strong break at the proper location of 4000˚ A. Other evidence also suggests this may be a chance superposition of two sources, strongly complicating further analysis. Acknowledgments. This work is based on observations made with the Spitzer Space Telescope, which is operated by the Jet Propulsion Laboratory,
Mystery of the Lyα Blobs
473
Figure 3. Fν versus wavelength for our four Lyα blobs. Diamonds mark detections while arrows designate upper limits. The Fν scaling is arbitrary.
California Institute of Technology, under NASA contract 1407. We would like to acknowledge financial support from a grant for Spitzer program GO-3699. References 1. Basu-Zych, A. & Scharf, C. 2004, ApJL, 615, L85 2. Bower, R. G., et al. 2001, MNRAS, 325, 497 3. Bushouse, H.A., et al. 2002, ApJS, 138, 1 4. Chapman, S. C., et al. 2004, ApJ, 606, 85 5. Chapman, S. C., et al. 2003, ApJ, 599, 92 6. Chapman, S. C., et al. 2001, ApJ, 548, L17 7. Chary, R., & Elbaz, D. 2001, ApJ, 556, 562 8. Colina, L., et al. 2001, ApJ, 563, 546 9. Dey, A., et al. 2005, ApJ, 629, 654 Dinh-V-Trung et al.(2001)]din01 10. Dinh-V-Trung, et al. 2001, ApJ, 556, 141 11. Fardal, M. A. 2001, ApJ, 562, 605 12. Farrah, D., et al. 2002, MNRAS, 329, 605 13. Francis, P. J., et al. 2004, ApJ, 614, 75 14. Francis, P. J., & Williger, G. M. 2004, ApJL, 602, L77 15. Francis, P. J. et al. 2001, ApJ, 554, 1001 16. Fazio, G., et al. 2004, ApJSS, 154, 10 17. Geach, J. E. et al. 2005, MNRAS, 363, 1398 18. Geller, M. J., & Huchra, J. P. 1989, Science, 246, 897 19. Keel, W. C. et al. 1999, AJ, 118, 2547 20. Kim, D. -C., Veilleux, S., & Sanders, D. B. 2002, ApJS, 143, 277 21. Matsuda, Y. et al. 2004, AJ, 128, 569 22. Murphy, T. et al. 1996, AJ, 111, 1025 23. Ohyama, Y. & Taniguchi, Y. 2004, AJ, 127, 1313 24. Palunas, P. et al. 2004, ApJ, 602, 545 25. Rieke, G. H., et al. 2004, ApJS, 154, 25 26. Risaliti, G., et al. 2006, ApJL, 637, L17 27. Sawicki, M. 2002, AJ, 124, 3050 28. Smail, I., et al. 2003, ApJ, 583, 551 29. Steidel, C. C., et al. 2000, ApJ, 532, 170