Journal of Computer Sciences and Applications, 2014, Vol. 2, No. 2, 14-22 Available online at http://pubs.sciepub.com/jcsa/2/2/1 © Science and Education Publishing DOI:10.12691/jcsa-2-2-1
Network Performance Evaluation Based on Three Processes Karima Velásquez1, Eric Gamess2,* 1
Laboratorio de Comunicación y Redes, Central University of Venezuela, Caracas, Venezuela 2 Escuela de Computación, Central University of Venezuela, Caracas, Venezuela *Corresponding author:
[email protected]
Received April 17, 2014; Revised May 20, 2014; Accepted May 20, 2014
Abstract Network performance evaluation has traditionally been done following the client/server model, using two processes to carry out the evaluation. In this paper we present a different approach. We propose an enhancement to the classical performance evaluation by using three processes: client, server, and a middle process that reports additional gauges which allow users to more accurately and rapidly detect network anomalies. For this third process we wrote two versions: one for PC-based routers, and the other for off-the-shelf wireless routers. The former version was presented in one of our previous works. In this paper, we present our experience in writing and porting our application to wireless routers. Additionally, we perform different experiments to validate the correctness of the results reported. Furthermore, we present additional experiments that illustrate another possible uses for our tool. Keywords: benchmarking tools, performance evaluation, network monitoring Cite This Article: Karima Velásquez, and Eric Gamess, “Network Performance Evaluation Based on Three Processes.” Journal of Computer Sciences and Applications, vol. 2, no. 2 (2014): 14-22. doi: 10.12691/jcsa-2-2-1.
1. Introduction Traditional network performance tools are based on two processes (client/server model); therefore they report performance metrics for the whole path between the client and the server. In a network where the links have different bandwidths or loads, it is almost impossible to narrow and finally identify the link where the performance is degraded in the path since the performance tools based on two processes report results between the two end-devices. No in-between results are reported, which might help network administrators and researchers in recognizing and detecting problems in the network. In a previous work [1] we presented 3bench 1 , a performance evaluation tool based on three processes. The first version of our tool was developed for a PC platform, i.e., the three processes where designed to run on PCs with a full version of Linux, where all the required libraries are available, without limitations of CPU power and memory storage. In this work, we explain how its third process was ported to be supported by a wireless off-the-shelf router, and we also perform different tests to validate the correctness of the reported results over this new platform. Our novel benchmarking approach might help to isolate the exact point where performance issues are located, especially in WiFi networks where performance evaluation tools that run in access points (or wireless routers) were not available prior to this research. The rest of the paper is organized as follows. Related work is presented in Section 2. A short introduction to 1
http://sourceforge.net/projects/threebench
3bench is done in Section 3. Section 4 relates our experience in porting and validating the middle process in a wireless router. Additional experiments are reported in Section 5. Finally, Section 6 concludes the paper.
2. Related Work In [2], Kemerlis et al. present a study of TCP performance over WiFi. They perform some experiments in order to investigate how the throughput is divided among the hosts with respect of the signal strength, use of RTS/CTS mechanism, and traffic direction. For the measurement, they use tools such as ttcp 2, tcpdump 3, and tcptrace 4. Another study is presented in [3] where Pacheco et al. discuss the results of experiments at OSI levels 4 and 7, for TCP, UDP, and FTP experiments over 802.11a and 802.11g networks. They measure TCP throughput, jitter, percentage of packet loss, and FTP transfer rate. They used iperf 5 to conduct their experiments, as well as NetStumbler 6 . The best TCP throughput was found for 802.11a, and jitter performances were found sensitive to AP type. The authors of [4] perform similar evaluations of OSI layers 4 and 7, this time comparing 802.11b/g WPA2 Point-to-Point links. In this case, the 802.11g links showed a better performance for jitter and FTP throughput. They used iperf to conduct their experiments. An evaluation of the performance of network coding in a wireless network using experimentation is presented in 2
http://www.pcausa.com/utilities/pcattcp.htm http://www.tcpdump.org http://www.tcptrace.org 5 http://sourceforge.net/projects/iperf 6 http://www.netstumbler.com 3 4
15
Journal of Computer Sciences and Applications
[5]. The results show an average throughput gain of 1.2 with network coding. For the experiments, udpgen 7 was used to generate UDP traffic. In [6] the authors present a hybrid Markov-chain based model to quantify the throughput reduction effect in 802.11b/g mixed scenarios. The proposed analytical model is verified with simulations and field measurements under different station numbers, data rates, and packet sizes. For these tests, a special UDP traffic generator program was run in each wireless station. In [7] the performance of an 802.11b wireless network is analyzed. An anomaly is detected when some mobile hosts use a lower bitrate than others, degrading the performance of all hosts. The anomaly is analyzed theoretically, by means of simulations, and in testbeds with several performance measurements conducted with netperf 8, tcpperf 9, and udpperf 10. A comparative study of the impact of wireless encryption methods over different operating systems is presented in [8]. The authors evaluate Windows XP, Windows Vista, Windows Server 2008, and Ubuntu, carrying out several experiments to evaluate the performance of TCP and UDP, using WEP-64, WEP-128, WPA, and WPA2. For their experiments, they used iperf. A similar work is offered in [9], showing an investigation of the impact of various encryption techniques (WEP-64, WEP-128, and WPA) on performance of wireless LANs for Windows Server 2003, Windows XP, and Windows Vista, once again using TCP and UDP as transport protocols. In this work, netperf was used as benchmarking tool. In all the studies reviewed, the experimental evaluation used end-to-end evaluation tools based on the well-used client/server model. We were not able to find any study involving the measurement of networking gauges at several points of the network path. Furthermore, a survey of network benchmarking tools is done in [10] where all the active tools (applications that inject traffic in the network) are based on the classical client/server model and the passive tools are independent processes that are run in promiscuous mode to capture network traffic and analyze it.
3. Proposed Benchmarking Tool: 3bench 3bench [1] is a network benchmarking tool that works in two modes: (1) client and server, and (2) client, server, and a middle process. In the first mode, we have a classical tool, like the ones presented in [10]. On the other hand, if the second mode is used, we have an additional agent running in an intermediate device in the path to be evaluated. This third process (also called middle process or router process) provides information about a segment of the path, while the server reports statistics for the whole path. This last mode makes easier and faster the isolation of possible defective links in the path. The three main components of our tool are briefly described next. Also, we depict how the network gauges are calculated, and provide a brief explanation of the advantages of our tool.
7
https://github.com/steerapi/udpgen http://www.netperf.org 9 http://code.google.com/p/tcpperf 10 http://ahmad.rahmati.com/files/udpperf-0.2.1.zip 8
3.1. The Server To start the experiments the server must be run to listen to all the different clients’ requests. The same program is executed for the client and the server. When run in server mode, it must be indicated through the –m server option. The server is run in the same way whether there are two or three processes; it is not aware of the middle process presence. During its execution, the server stores a file containing the data of the packets from the experiment’s traffic (ID, timestamp, and size). With this information it calculates the statistics to report back to the client once the experiment is done.
3.2. The Client It is necessary to define a configuration file for the client to be run. This file includes the flow definitions, which contain information about the destination (IPv4 or IPv6 address), the protocol (UDP or TCP), and the flow type (SPX for simplex traffic and HDX for ping-pong traffic); also, users can specify an arbitrary value for some IP header fields (TTL and ToS for IPv4, and Hop Limit and Traffic Class for IPv6). It is possible to define several flows in the same file, thus speeding users’ work. In this file the experiments are also defined. It is necessary to associate them to a previously defined flow. For the experiments, the required parameters are the start and finish time, the destination port, the interdeparture time between packets (CBR, Poisson, or Exponential), and the packet size. Once the client is run, it creates a configuration connection (using TCP) to send the experiment parameters to the appropriate destinations (server and middle process, when this latter is present); and when the start time is reached, experiments begin. At the end of the experiments, the client collects the results from all the servers (and from middle processes, if defined) involved, to finally display results via console to users. The middle process is optional. Since the client must be aware of the middle process, the client is invoked with arguments, giving the IP address (IPv4 or IPv6) and the port in which the middle process is listening.
3.3. The Middle Process When the middle process is present in the experiment, the client sends the necessary information to it, which is defined in the configuration file. With this knowledge, the parameters to capture the experiment traffic are set. The captured traffic is then processed by the middle process, thus getting the statistics that are finally reported to the client at the end of the experiment to be shown to users. The third process requires root privileges to be executed to properly perform several system calls invoked by it (e.g., to put the NIC in promiscuous mode). For the wireless router’s version of the third process, several inconvenient where found, among them the lack of thread support. For these reasons, we did not develop the wireless router’s version of the third process in our first version of 3bench [1] which was limited to PC-based routers. However, it was one of our main interests to develop a version compatible with low priced off-the-shelf wireless routers. In Section IV, we discuss our experience
Journal of Computer Sciences and Applications
in porting and validating the third process in wireless routers with limited resources.
3.4. Gauges Calculated 3bench allows users to obtain several gauges including throughput, loss rate, jitter, and RTT (Round-Trip Time). All of these metrics are reported by the middle process (if included in the experiment), by the server, and also by the client (if an HDX flow is defined). In this section we describe how these gauges are calculated. 3.4.1. Throughput The throughput is reported in bps. The server (and also the middle process if included in the experiment) reads the final statistics file and counts the total of bytes for packets received for this flow. Also, it takes the arrival time from the first and last packet. The throughput is calculated using Formula (1). It is worth mentioning that the throughput is based on the payload, i.e., UDP or TCP payload. (1) 3.4.2. Loss Rate For this gauge, the client must inform the server (and the middle process if there are three processes involved) about the total of packets sent. With this information, both the middle process (if present) and the server can compute the loss rate they observe based on the total number of packets sent and locally received. The percentage of lost packets is calculated using Formula (2).
16
This gauge is calculated only for HDX flows (pingpong traffic) and only by the client, for the complexity immersed in synchronizing two different computers. The client stores the sending time for each packet. Also, it keeps the information of the arriving time for each packet. With these data and Formula (4), the average RTT is obtained based on the received packets at the client’s side. (4)
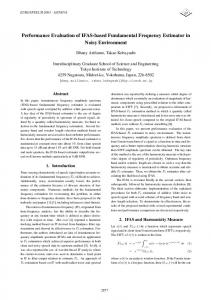
3.5. Advantages of the Three Processes Approach With more traditional tools, users can set up experiments placing the client and the server at the ends of the network path to evaluate. When facing issues, such as packet loss, it would be complex as well as time consuming, to determine the exact link or device where the problem is located. Now with 3bench, users have additional information between the client and the server, which will facilitate tracking down the malfunction. Assuming a network topology such as the one shown in Figure 1, 3bench is able to report the gauges described in the previous section in three points: the client (C), the middle process (R), and the server (S). The report from the middle process corresponds to L1, whilst the report from the server measures the whole network path (i.e., L1 L2). Finally, the report from the client also corresponds with the whole network path, but in the opposite direction (L2 L1).
(2)
Figure 1. Three Processes Scenario
3.4.3. Jitter We based our jitter calculation on [11]. Assuming Si as the sending time for packet i, Ri as the reception time for packet i, and Di as its jitter, we compute the average jitter according to Formula (3).
(3) 3.4.4. Ordered 3bench reports a boolean value notifying if the received packets were ordered. To inform about this situation, we review the statistics file in every process reporting results (server, router, and/or client). In this file the ID for each packet is stored. When reporting results, the involved process looks if the value of these IDs does go up (increasing IDs) to inform about the ordering in the sequence evaluated. 3.4.5. Round Trip Time
Using a more traditional benchmarking tool (based only in two processes), users will only obtain results from the server (L1 L2 in Figure 1). In order to obtain the same amount of information that 3bench reports in a single experiment, users will be obliged to perform three different experiments: (1) from client to router or middle process –L1–, (2) from client to server – L1 L2 –, and (3) from server to client – L2 L1. With traditional benchmarking tools, users can detect the existence of a problem within the network path, but can not accurately isolate its exact location. 3bench would reduce the amount of time invested in identifying the exact location of a faulty link to half in comparison with traditional tools: if the problem is located in the first link (L1), the middle process will report it; on the other hand, if the problem is found in the second link (L2), the server will detect it. With the extra information (consisting of different reports from several points in the path) users will track down faster the exact location of the network failure. The reduction of the amount of time invested in the experiments in order to locate the specific faulty link will depend on the amount of links in the network path
17
Journal of Computer Sciences and Applications
between client and server, and the location of the middle process.
4. Porting and Validating the Middle Process There were several factors involved in the porting of 3bench’s third process to an off-the-shelf wireless router; we discuss some of them in this section.
4.1. Open Firmwares In order to port our tool to a wireless router platform, we needed to install an open firmware based on Linux, allowing the addition and execution of our software. It is worth mentioning that proprietary firmwares are totally closed and do not allow any extension. There are several open firmwares that offer customizations and new features, usually not supported by manufacturers’ pre-installed software, to wireless routers. Among these firmwares we can mention [12,13]: • DD-WRT: A free firmware based on Linux that is targeted for several wireless router models, developed under the GNU Public License (GPL). It has support for IPv6, RADIUS, QoS, etc. • OpenWRT: Another free firmware for embedded systems, such as wireless routers. It supports both a command-line interface as well as a web-based GUI. It offers several services such as: DHCP, WEP, WPA, QoS, DDNS, Samba, etc. • HyperWRT: It is based on the Linksys firmware and is mainly targeted to offer a wider range of functionalities while maintaining similarities with the original firmware. • FreeWRT: It is a fork of OpenWRT that arises because of communication problems among the OpenWRT community. Its purpose is to offer a firmware that meets most requirements of a commercial environment. Additional software might be installed via ipkg. • Tomato: It is a derivative of HyperWRT with a Linux kernel. It includes an AJAX-based GUI and several features such as QoS, customizable firewall, DDNS, etc. Most of these firmwares have several versions that were ported to different wireless router models. There are reduced versions that only offer limited functionalities, which are intended for wireless routers with fewer capabilities (2 MB to 4 MB of flash memory). Due to storage restrictions, users’ interactions are limited to Telnet or SSH (and in some case also a web-based GUI). Nonetheless, there are other wireless routers that provide more storage capacity (8 MB, 16 MB, and 32 MB of flash memory). For these routers we propose installing one of the available firmwares, and develop a version of the 3bench’s middle process. Among the available open firmware, DD-WRT and OpenWRT have a greater support from the community. Between these two, OpenWRT was the selected firmware, because of the following reasons: • OpenWRT offers a reduced image with minimal components, where users have to add additional packages which allows an optimal customization for the work environment; while DD-WRT provides
several versions (mini, micro, and mega) already preconfigured with preinstalled packages, narrowing users choices. • While DD-WRT seems a better choice for final users, OpenWRT is more developer-oriented, with many applications available in repositories that ease the setting up of a work environment. • To validate our development, we use a WAN emulator called NetEm [14,15]. NetEm is available in OpenWRT repositories, hence with a simple command, we could install it in the wireless router. However, we could not find it in DD-WRT repositories. Despite our greatest efforts, we could not install it via other mechanisms in DD-WRT.
4.2. Wireless Router Selected Most of the commercial wireless routers have little resources. It is still very common to find these devices with limited flash (2 MB or 4 MB) and small RAM (4 MB or 8 MB). Some other recent commercial wireless routers have more storage capacities but are still not supported by community firmware such as OpenWRT or DD-WRT. Since the storage limitation was the most critical point for our third process, we decided to use an ASUS WL-500W wireless router, which consists of a BCM3302 v0.6 264 MHz CPU, 8 MB of flash, 32 MB of RAM, and a wireless 802.11 b/g/n adapter with 3 external dipole antennas and a Broadcom BCM4704 chipset. This wireless router is supported by OpenWRT and has a reasonable amount of memory for an affordable cost. Therefore, we were able to arrange the executable files, as well as some data generated during the experiments to calculate final statistics, within the file system. We installed OpenWRT Attitude Adjustment 12.09-rc1 in our wireless router.
4.3. Cross Compiler Once installed OpenWRT (Attitude Adjustment) in our router, we proceeded to perform some preliminary tests to verify the execution of our code. The first obstacle was not finding a C compiler that could be executed on the wireless router. This situation forced us to compile the code on a workstation and transfer the binary file to the wireless router. Since our workstations have an Intel architecture, and the wireless router has a MIPS architecture, we used a cross compiler. Therefore, we downloaded the file OpenWRT-SDK-brcm47xx-forLinux-i686-gcc-4.3.3+CS_uClibc-0.9.30.1.tar.bz2 from OpenWRT web site, which contains a functional C cross compiler for our wireless router.
4.4. Queueing Library In the middle process, packets are queued with iptables (or ip6tables) and delivered to our application. All this is achieved with the help of a system library. Unlike our previous version of the third process (the one for PC-based routers), where we used netfilter_queue, for this version of our middle process (the one adapted for wireless routers) we used libipq, a predecessor version of netfilter_queue. We were forced to use this older version of the library because of compatibility issues. Unfortunately, libipq supports only one queue, thus
Journal of Computer Sciences and Applications
restricting the number of flows that can go simultaneously through the middle process to one.
18
one of its Fast Ethernet interfaces (LAN interface of the wireless router) to connect the client and its WAN interface to connect the server.
4.5. Limitations We performed experiments to evaluate the new version of 3bench’s third process (the one adapted to run over a wireless router with OpenWRT). We noticed that even though we could reach the maximum throughput using two processes, when using three processes we had to limit the packet generator to about 7 Mbps, since higher data rates incurred in overloading the netlink buffers of the router, thus killing our application.
4.6. Unbricking Wireless Routers During the updating of the firmware of a wireless router, there is always a risk of bricking it. Bricking a router refers to a failure that has rendered the router useless, thus becoming a brick. It is common to brick a wireless router when upgrading its firmware, but it is also possible to do it with a wrong configuration or manipulation once the firmware is up and running. We encountered such a problem several times during our development process. There are several possibilities to revert the damage, such as using a special cable (JTAG), or performing a hard reset and flashing the router again via TFTP. We used the latter option, having been able to recover full functionality of the device.
Figure 2. Testbed for Experiments over Ethernet Scenario
Results for delay experiments are presented in Figure 3 (IPv4) and Figure 4 (IPv6). For each figure, we have five experiments (E1, ..., E5). Each experiment consists of two bars. The first bar is the configured delay with NetEm. The second bar is the delay reported by the experiments. We can see that reported values are similar to the expected ones showing that the overhead introduced by the middle process to the wireless router is negligible. For IPv4, in all 5 experiments, the difference between the expected value and the reported result was under 1%, while for IPv6 the difference was under 2%, except for E1, with a difference of 11%.
4.7. Validating the Wireless Router Version of the Middle Process We conducted several experiments to validate our middle process for wireless routers. The idea was to show that our tool does not introduce a significant processing overhead in wireless routers and that the results reported by 3bench are correct. It is worth remembering that home wireless routers are cheap devices with a low computation power. Our experiments include measuring RTT, loss rate, and throughput. All the experiments were repeated 5 to 10 times to get consistent measurements. The average obtained for each test is presented as the result. The duration of each experiment was one minute. In all of our experiments, we used UDP as the transport protocol. Expected values were configured with NetEm [14], which was set up in the client and wireless router interfaces. In the case of the experiments measuring delay (delay experiments), we started doing tests measuring the RTT without introducing any modification to the network parameters with NetEm. Then, we obtained the RTT once NetEm was configured to add the desired delay. Finally, we did the subtraction of these two values, obtaining the experimental delay. For our testbed we used PCs with an Intel Core 2 Duo E6750 (2.66 GHz) processor, 4 GB of RAM, an Intel PCI Ethernet adapters (Intel PRO/100 S), a Belkin PCI 802.11a/b/g adapter with an Atheros AR5006XS chipset, and a 250 GB hard disk. We installed Debian 6.0.8 (Squeeze) in the PCs. 4.7.1. Using Ethernet Links The testbed used in these experiments is shown in Figure 2. We performed experiments to evaluate the Ethernet links of the wireless router. Therefore, we used
Figure 3. Delay Experiments – Ethernet – IPv4
Figure 4. Delay Experiments – Ethernet – IPv6
Figure 5 presents the results for the loss rate experiments using IPv4, while Figure 6 reflects the results for IPv6. For both figures, we have 10 experiments (E1, ..., E10). For each experiment, the first bar represents the loss rate configured with NetEm in the client. The second bar is the loss rate reported by our middle process, which should be as close as possible to the first bar. The third bar is the combined loss rate in the client and wireless router, i.e., the total loss rate in the path. The fourth bar is the loss rate reported by the server, which should be as close as possible to the third bar. For experiment E1, we configured (5%, 5%) with NetEm, i.e., a loss rate of 5% in
19
Journal of Computer Sciences and Applications
the client and 5% in the wireless router, which leads to a cumulative packet loss of 9% at the server level. For the other experiments, we chose: E2=(5%, 20%), E3=(10%, 5%), E4=(10%, 15%), E5=(10%, 30%), E6=(20%, 10%), E7=(20%, 20%), E8=(20%, 30%), E9=(30%, 10%), and E10=(30%, 30%). In both cases we can see that the values obtained are analogous to the expected, the difference between the expected values and the ones reported by our tool (both for the wireless router and the server) was less than 1%. These results validate that the middle process is running correctly and reporting the expected values.
and the ones reported by 3bench. Once more, these results validate that our middle process is reporting the correct results.
Figure 8. Throughput Experiments – Ethernet – IPv6
4.7.2. Using Hybrid Links
Figure 5. Loss Rate Experiments – Ethernet – IPv4
The previous experiments were repeated, this time using the testbed depicted in Figure 9. We connected the client to the Fast Ethernet interface of the wireless router (WAN) and the server to the WiFi 802.11g interface of the wireless router (WLAN), thus creating an hybrid scenario. This will cause a bottleneck in the WiFi link that will be easily detected by our benchmark. The idea behind this scenario is to demonstrate how helpful 3bench would be in detecting bottlenecks in a network path, injecting traffic in a wider bandwidth (wired link) and forwarding it to a narrower bandwidth (wireless link).
Figure 9. Testbed for Experiments over Hybrid Scenario
Figure 6. Loss Rate Experiments – Ethernet – IPv6
Figure 10 shows the results for the delay experiments using IPv4, while the results for IPv6 are shown in Figure 11. In the case of IPv4, we can see a difference of 2% for E1, 4% for E2, and under 0.5% for E3, E4, and E5. On the other hand, for IPv6, we observe a difference of 11% for E1, and under 1% for the rest of the experiments, E2, E3, E4, and E5. The only noticeable difference is reported in E1 for IPv6. We can say that this bigger difference is due to the small amount of delay involved in this test (5ms). These results show once again that the overload introduced by our tool is small and does not affect significantly the final results.
Figure 7. Throughput Experiments – Ethernet – IPv4
Results for throughput experiments for IPv4 are depicted in Figure 7, and for IPv6 in Figure 8. Here, we have 5 experiments (E1, ..., E5) and the four bars representing the throughputs (1) configured in the client, (2) reported by the middle process, (3) configured in the wireless router, and (4) reported by the server, respectively. For both protocols, results are similar, reporting values close to the ones configured with NetEm along the path. For IPv4, the differences were between 3% and 4%, while for IPv6 they were a little higher, with a maximum difference of 5% among the expected values
Figure 10. Delay Experiments – Hybrid – IPv4
Journal of Computer Sciences and Applications
20
We can see the results for the throughput experiments for IPv4 in Figure 14 and for IPv6 in Figure 15. In both cases, 3bench reported values similar to the expected, at the wireless router as well as at the server (differences of 3% for IPv4 and 4% for IPv6), validating one more time the adequate behavior of 3bench.
Figure 11. Delay Experiments – Hybrid – IPv6
Results for loss rate experiments are depicted in Figure 12 (IPv4) and in Figure 13 (IPv6). We can see that for some experiments, the values of the fourth column are slightly higher than those of the third column. This might be caused by the untrusting nature of the wireless links. In all cases, the difference between the expected values and the results reported by our tool are under 1%.
Figure 15. Throughput Experiments – Hybrid – IPv6
5. Additional Experiments
Figure 12. Loss Rate Experiments – Hybrid – IPv4
The purpose of these experiments is to demonstrate that 3bench can also be used to determine the saturation point of an intermediate device. To achieve this, we connected three PCs through our wireless router, each one running a 3bench server and a 3bench client. In the configuration file of each client two flows were defined (one toward each of the other two servers of the testbed), thus generating a total of six simultaneous flows. We defined different bitrates using the traffic engine embedded in 3bench. We used different packets sizes following the recommendations in [16]. In a first scenario, we used our ASUS wireless router, connecting the three PCs via wired LAN interfaces. The testbed is shown in Figure 16. We performed tests with IPv4 and IPv6 as network protocols.
Figure 13. Loss Rate Experiments – Hybrid – IPv6 Figure 16. Testbed – Saturation Experiments - Wired
Figure 14. Throughput Experiments – Hybrid – IPv4
Results obtained for IPv4 are depicted in Figure 17. We can notice how the saturation throughput reached changes according to the packet size (512, 1024, and 1400 bytes for UDP payload). In all cases, we can see the upper limit of 100 Mbps imposed by the middle device (a total of 300 Mbps when three PCs are connected). Similar results are shown in Figure 18 for IPv6. As the packet size increases, the saturation throughput reached is higher. For smaller UDP payload, the total throughput reported by our tool is lower, and this is due to the fact that we need a bigger number of packets to reach the bitrate, therefore increasing the forwarding effort of the intermediate device.
21
Journal of Computer Sciences and Applications
Also, for smaller UDP payload, the overhead of the layer 2 and IP headers is becoming important comparing to the UDP payload, reducing the UDP throughput.
after a certain value of the bitrate, the performance downgrades on the wireless scenario due to the numerous collisions that happen in the shared medium.
Figure 17. Saturation Experiments – Wired – IPv4
Figure 20. Saturation Experiments – Wireless – IPv4
Figure 18. Saturation Experiments – Wired – IPv6
For the second scenario, we repeated these experiments, this time using 802.11g connections. To achieve this, we used the same ASUS wireless router utilized in previous experiments. The testbed is shown in Figure 19. We changed the configured bitrates in this test, as the theoretical upper limit of the bandwidth is lower.
Figure 19. Testbed – Saturation Experiments – Wireless
Results for this experiment are depicted in Figure 20 (IPv4) and Figure 21 (IPv6). We can notice that the highest throughput reached is around 8 Mbps. We assume that a higher throughput (closer to the theoretical limit) could not be reached because of the presence of simultaneous transmissions (three PCs and a wireless router sharing the same channel), occasioning collisions and consequently downgrading the network performance. Additionally, we can appreciate how the same behavior is repeated as with a wired environment: the network performance improves for bigger packets. This kind of experiments allows users to determine the ideal amount of clients for the network, so the performance is not damaged. In contrast with the wired scenario, we can notice that
Figure 21. Saturation Experiments – Wireless – IPv6
6. Conclusions and Future Work In this work we explained the porting procedure for 3bench’s third process, in order to execute it on an off-theshelf wireless router. We performed several experiments to validate the correctness and accuracy of the results reported by our new version of 3bench. To achieve this we used NetEm, a WAN emulator that permits the alteration of traffic flows by specifying the required network parameters and we compared the values set with the results reported by 3bench. In all cases, the expected values were pretty similar to the experimental values, thus confirming the correctness of our tool. Additionally, we confirmed how the presence of a third process can help network administrators and researchers to accomplish network diagnostics in a shorter time. Finally, we demonstrated supplementary applications for our tool, in the way of determining the saturation point of middle devices on a network. For future work, we plan to use 3bench to carry out network performance evaluations where we will analyze different network security protocols such as WEP, WPA, and WPA2. We also intend to compare the network performance of different wireless routers.
References [1]
K. Velásquez and E. Gamess. “3bench: A Benchmarking Tool based on Three Processes”. Journal of Convergence Information Technology. Volume 8, Number 14. pp. 55-68. September 2013.
Journal of Computer Sciences and Applications [2]
[3]
[4]
[5]
[6]
[7]
V. Kemerlis, E. Stefanis, G. Xylomenos, and G. Polyzos. “Throughput Unfairness in TCP over WiFi”. In Proceedings of the 3rd Annual Conference on Wireless On Demand Network Systems and Services (WONS 2006). Les Ménuires, France. January 2006. J. Pacheco, H. Veiga, C. Ribeiro, and A. Reis. “Comparative Performance Evaluation of Wi-Fi IEEE 802.11 A,G WEP PTP Links”. In Proceedings of the World Congress on Engineering 2012 Vol II (WCE 2012). London, U.K. July 2012. J. Pacheco de Carvalho, H. Veiga, N. Marques, C. Ribeiro Pacheco, and A. Reis. “Laboratory Performance of Wi-Fi IEEE 802.11 B,G WPA2 Point-to-Point Links: a Case Study”. In Proceedings of the World Congress on Engineering 2011 Vol II (WCE 2011). London, U.K. July 2011. I. Qazi and P. Gandhi. “Performance Evaluation of Wireless Network Coding under Practical Settings”. Department of Computer Science University of Pittsburgh. Technical Report TR07-150. Pittsburgh, USA, May 2007. S. Wang, Y. Chen, T. Lee, and A. Helmy. “Performance Evaluations for Hybrid IEEE 802.11b and 802.11g Wireless Networks”. In Proceedings of the 24th IEEE International Performance, Computing, and Communications Conference (IPCCC 2005). New York, USA. April 2005. M. Heusse, F. Rousseau, G. Berger-Sabbatel, and A. Duda. “Performance Anomaly of 802.11b”. In Proceedings of the 22nd Annual Joint Conference of the IEEE Computer and Communications (INFOCOM 2003). Grenoble, France. April 2003.
[8]
[9]
[10] [11] [12] [13] [14] [15] [16]
22
S. Narayan, T, Feng, X. Xu, and S. Ardham. “Impact of Wireless IEEE802.11n Encryption Methods on Network Performance of Operating Systems”. In Proceedings of the Second International Conference on Emerging Trends in Engineering and Technology (ICETET-09). Nagpur, India. December 2009. S. Kolahi, S. Narayan, D. Nguyen, Y. Sunarto, and P. Mani. “The Impact of Wireless LAN Security on Performance of Different Windows Operating Systems”. In Proceedings of the Symposium on Computers and Communications (ISCC 2008). Marrakech, Morocco. July 2008. K. Velásquez and E. Gamess. “A Survey of Network Benchmark Tools”. Machine Learning and System Engineering. pp. 465-480. Springer. 2010. S. Avallone, A. Botta, A. Dainotti, W. de Donato, and A. Pescapé. “D-ITG V. 2.6.1d Manual”. May 2008. P. Asadoorian and L. Pesce. Linksys WRT54G Ultimate Hacking. Syngress. July 2007. C. Hallinan. Embedded Linux Primer: A Practical Real-World Approach. 2nd ed. Prentice Hall. November 2010. S. Hemminger. “Network Emulation with NetEm”. In Proceedings of Australia's 6th National Linux Conference. Canberra, Australia. April 2005. K. Velásquez and E. Gamess. “A Comparative Analysis of WAN Emulators”. In Proceedings of Latin American Networking Conference (LANC’2012). Medellin, Colombia. October 2012. S. Bradner and J. McQuaid. Benchmarking Methodology for Network Interconnect Devices. RFC 2544. March 1999.