Performance Evaluation of a ZigBee-based Medical Sensor Network Helena Fernández-López, Pedro Macedo, José A. Afonso and J. H. Correia Industrial Electronics Engineering Department University of Minho, Guimarães, Portugal {hlopez, jose.afonso}@dei.uminho.pt
Abstract—Low power consumption and small footprint make 802.15.4/ZigBee based devices well suited for personal healthcare applications, representing a promising alternative to patient monitoring under important scenarios such as emergency, postop, continuous care, and chronic diseases. However, their use in a healthcare facility to monitor several mobile patients poses several difficulties, mainly because this protocol was primarily designed to operate in low data rate scenarios. This paper presents simulation results used to evaluate important quality of service (QoS) markers and, ultimately, estimate the maximum number of sensors that could integrate a wireless vital signs monitoring system. Results show that the system is able to carry the signals from 30 ECG sensors with delivery ratio higher than 99% in the considered scenario, provided that an adequate number of retransmissions are allowed. Keywords-Vital signals monitoring; performance evaluation; quality of service, ZigBee; wireless sensor networks.
I.
INTRODUCTION
Continuous health monitoring based on wireless sensor networks (WSNs) can greatly benefit the care of non-critical, mobile in-patients. WSNs consist of spatially distributed devices containing sensor units used to acquire and process data and communicate with each other using a radiofrequency channel. Basic features, namely, self-organizing capabilities, short-range broadcast communication and multihop routing, frequently changing topology due to fading and node failures, and power limitations characterize these networks [1]. We propose a monitoring system to be used in the hospital environment, designed to continuously monitor non-critical patients, which consists of one or more ZigBee based WSNs that gathers and process vital signals from patients and supply that information to a data server, which makes this data available to monitoring centers and registered health professionals and patients [2]. To be feasible, each sensor network must consist of unobtrusive sensor nodes that consume very little power, since they must be powered by batteries. On the other hand, the reliance on these systems depends on the satisfaction of QoS requirements, such as sustainable throughput, small delay and high reliability. The main difficulty arises from the fact that some sensors must be sampled quite often, generating a large amount of data and, consequently, requiring the network to This work was supported by Fundação para a Ciência e a Tecnologia under grant SFRH/BD/39408/2007, through the 3º Quadro Comunitário de Apoio, and the POCTI and FEDER programmes.
Ricardo Simões Institute of Polymers and Composites University of Minho, Guimarães, Portugal
[email protected];
operate under high load, which is not common in typical WSN scenarios. In [3], the authors present an analysis of the 802.15.4 standard considering a body area network (BAN), consisting of low rate implantable medical devices, operating at 2.4 GHz in beacon, beacon plus guaranteed time-slots and non-beacon modes. The authors conclude that 802.15.4 is adequate and that non-beacon operation provides the best performance. Beacon and GTS modes may also be used under data rate restrictions and tight crystal tolerance. In [4], the maximum data throughput and delay of unslotted 802.15.4, with different frequency ranges and address structures, in a simple one sender one receiver network, is evaluated, both analytically and experimentally. Due to the limited packet length and the relatively large overhead required, the maximum bandwidth efficiency under optimal circumstances for 2.4 GHz is 64.9%. The effects of varying the payload size, sampling, and transmitting cycle in an 802.15.4 based, star network, consisting of ECG monitoring sensors are analyzed in [5]. The authors determined that for a full size MAC packet with maximum payload length the average end-to-end latency is 90 ms, what still complies with the requirements imposed by medical applications. For time-critical medical applications, the authors suggest the use of a payload between 40 and 60 bytes because it would present lower end to end latency and acceptable delivery rate. In [6], the authors present simulation results to evaluate the suitability of the 802.15.4 standard in a healthcare environment. In a first experience, a star network consisting of distinct patient monitors is considered. The most demanding sensor, a multiple leads ECG, generates 1500 bytes every 250 ms. They conclude that using just three of such devices would result in an overload of the WPAN capacity. If packet segmentation is applied, the throughput improves at the expense of a higher access delay. Changing CSMA-CA parameters causes a smaller increment on the goodput, but reveals jagged curves which, according to the authors, are caused by the synchronization among transmitters with constant traffic generation and limited randomness in the backoff period. In this paper, we analyze the performance of an 802.15.4/ZigBee star network consisting of an increasing number of nodes. We aim at determining how important performance markers, such as the network throughput and
maximum delay, change as a function of the number of nodes and, ultimately, estimate the maximum number of nodes that could be used, while still achieving a desirable network performance. This article is organized as follows. In the next section, we present a short discussion about the 802.15.4 and ZigBee protocols, focusing on the CSMA-CA algorithm. In Section III, we introduce the simulation scenario and parameters and, present and discuss the results. Finally, in the last section, we present the conclusions.
TABLE I. Parameter macMinBE aUnitBackoffPeriod
aMaxBE macMaxCSMABackoffs
UNSLOTTED CSMA-CA PARAMETERS Description The minimum value of the backoff exponent. The number of symbols forming the basic time period, where the symbol rate is equal to 62.5 ksymbol/s. The maximum value of the backoff exponent. The maximum number of backoff periods.
Value [0-3], default = 3 20
5 [0-5], default = 4
The ZigBee protocol, developed by the ZigBee Alliance, stands on top of the 802.15.4 and defines the network and application layers. The network layer is responsible for routing frames to their intended destinations and provides functionalities such as network starting and newly associated devices address assignment and mechanisms to join and leave the network. It also provides an interface to the application layer, which holds application objects and provides mechanisms for discovering and binding devices [9]. III.
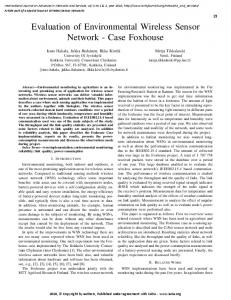
Figure 1. Unslotted CSMA-CA algorithm [8]
II.
802.15.4 AND ZIGBEE PROTOCOLS
The monitoring system under development is based on the 802.15.4 [7] and ZigBee [8] protocols, which provide the network infrastructure required for WSN applications. The 802.15.4 standard was developed by the IEEE, and defines the physical (PHY) and medium access (MAC) layers. The PHY layer is responsible for data transmission and reception and defines three possible frequency bands. The higher frequency band ranges from 2400 MHz to 2483.5 MHz, divided into sixteen 2 MHz channels that operate at a rate of 250 kbps. The MAC layer handles the access to the physical radio channel using a contention based CSMA-CA algorithm. The unslotted CSMA-CA algorithm is represented in Fig. 1 [8]. Before accessing the channel, the device must wait for a random backoff period defined in the interval from 0 to (2BE – 1) backoff periods, where BE, the backoff exponent, initially takes the value macMinBE and one backoff period shall be equal to aUnitBackoffPeriod symbols. If the channel is idle, the device transmits immediately after its turnaround time. If the channel is not idle, the device must defer its transmission. Each new attempt the device does to transmit a message, NB, the number of the number of times the CSMA-CA algorithm was required to backoff while attempting the current transmission is incremented by one unit. If BE has not exceed its maximum value, aMaxBE, it is also incremented, and a new backoff interval is determined. The device can try to access the channel macMaxCSMAbackoffs times before the algorithm declares a channel access failure. Unslotted CSMA-CA parameters are described in Table I.
PERFORMANCE EVALUATION
A. Simulation Parameters and Settings The performance of the 802.15.4 protocol, applied to the system under development, was evaluated through simulation. OMNet++ [9], a discrete event simulation environment that can be used as a network simulation platform was used. It is considered an increasing number of ECG sensors that send data directly to the coordinator, in a star topology, where nodes transmit directly to the coordinator. It is assumed that the wireless channel is free of fading and interferences and that each node is capable of hearing the transmissions of all others nodes. Despite of the use of the CSMA-CA mechanism, messages may not be delivered due to collisions or to the impossibility of accessing a busy channel. In this article, the terms message and packet are frequently used. A message represents information to be sent and a packet is an instance of a message that is transmitted in the channel. To send one message, a node may need to transmit more than one packet, depending on whether collisions occur. Every 250 ms, ECG sensors generate 108-byte messages Those messages are made up of 75 data bytes, 2 control bytes added by the application, 20 ZigBee overhead bytes, and 9 overhead bytes included by the 802.15.4 protocol. Acknowledgement packets (ACK) consist of 5 bytes sent by the coordinator, back to the sensor node, without using a CSMA-CA mechanism. Sensors start to generate data at a random instant between the beginning of the simulation and 250 ms. Simulation ends when the network coordinator receives 100,000 messages. Four operation modes were considered as a function of the number of retransmission attempts: 1) no retransmissions (without ack – 0 Ret); 2) up to one per message (1 Ret); 3) up to three (3 Ret); and 4) up to six (6 Ret). In the first case, the acknowledgment mechanism is not used. In the other cases, a retransmission is triggered each time a packet is not acknowledged or the channel access fails.
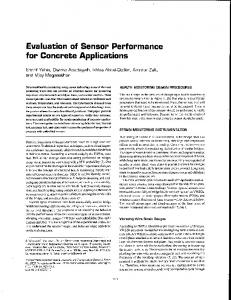
Failed Transmission Attempts
B. Results 1) Throughtput: Fig. 2 presents the normalized throughput of the network as a function of the number of sensor nodes. If no failures or collisions were expected, the throughput (TP) curves would ideally grow linearly as a function of the number of nodes (N). The black long dashed line in Fig. 2 represents the ideal throughput.
0.6 0.5 0.4 0.3 0.2 0.1 0 0
5
10
15
20
25
30
35
40
45
50
0.8
Number of Nodes
0.7 Without ack - 0 Ret
3 Ret
6 Ret
Figure 4. Failled transmission attempts curves
0.4 0.3
0.1 0 0
5
10
15
20
25
30
35
40
45
50
Number of Nodes Ideal
Without ack - 0 Ret
1 Ret
3 Ret
6 Ret
Figure 2. Throughput curves
If no retransmission attempts are possible, even for a small number of nodes, the throughput curve deviates from the ideal because lost packets are not retransmitted. On the other hand, if many retransmissions are possible, a network may collapse when many nodes are added due to the higher number of collisions and failures. For instance, considering the 6-Ret curve, when the number of nodes exceeds 40, this network starts to collapse. 2) Packet collision and message failure: The network throughput is affected by packet collisions and failures. The collided packets ratio curves are shown in Fig. 3 while failure transmission attempts ratio curves are shown in Fig. 4. As it can be observed, for the same number of nodes, the colllision and failure ratios are smaller if no retransmissions are allowed because few packets are transmitted and the channel is more oftenly idle. However, in general, throughput and, as we show on the next item, delivery ratio values, are worst. In fact, the use of acknowlegments contribute positively to the throughput and is essential to achieve high transfer reliability. If many retransmissions are allowed, when the number of nodes exceeds a critical value, the number of collisions and failures grow significantly, compromising the network performance. 0.7 0.6
3) Delivery Ratio: The delivery ratio (DR) represents the percentage of successfully delivered messages to the number of generated messages. The graphs shown in Fig. 5 represent the DR as a function of the number of nodes. It can be observed that if the number of nodes is small, the network reliability is better if retransmission is possible. For instance, if nodes are allowed to make up to six retransmissions, a 35node network would be able to achieve a DR better than 99%. 1 0.9
Delivery Ratio
0.2
Collided Frames
1 Ret
0.5
0.8 0.7 0.6 0.5 0.4 0
5
10
15
20
25
30
35
40
45
50
Number of Nodes Without ack - 0 Ret
1 Ret
3 Ret
6 Ret
Figure 5. Delivery ratio curves
4) Delay: The maximum delay curves are shown in Fig. 6. It is possible to observe that the maximum delay is greater if more retransmission attempts are possible. However, for all cases, the maximum delay is smaller than 200 ms. Considering that every 250 ms each node generates a new message, no data is lost in case the node has no buffer to store it. 0.2
Maximum Delay (s)
Throughput
0.6
0.1
0.5 0
0.4
0
0.3
5
10
15
20
25
30
35
40
45
50
Number of Nodes
0.2 Without ack - 0 Ret
0.1 0 0
5
10
15
20
25
30
35
40
45
Number of Nodes Without ack - 0 Ret
1 Ret
3 Ret
Figure 3. Collided packets curves
6 Ret
50
1 Ret
3 Ret
6 Ret
Figure 6. Maximum dealy curves
5) Energy Comsumption: The mean value of the energy spent by one node to deliver a message to the coordinator can be obtained as the ratio of the total energy spent by the node to
deliver all messages, including packets retransmissions where applicable, to the number of messages sent by the node. For the energy consumption estimation, we have considered the voltage and current consumption values specified for JN5139 ZigBee modules [10], as we have based our sensors on those devices. Under 3V voltage supply, when the CPU of the module is on, the module consumption is 9.21 mA. During sampling, the ADC is switched on, and the current increases 0.58 mA, as shown in Fig. 7. When the module switches on the transceiver during backoff, the current increases 22.79 mA and when it starts transmitting, the current reaches 37 mA. The curves of energy per message shown in Fig. 8 were determined using only the current level differences ∆TR-ON and ∆TX-RX, this is, the constant CPU ON current level was not considered, but will be accounted for in the following energy consumption calculations.
Energy per message curves show that energy consumption increases with the number of nodes because the network load increases, so the number of backoff periods elapsed until the detection of an idle channel also increases, as well as the number of collisions. The energy consumption is also higher when the number of allowed retransmissions is higher, since each retransmission of a collided or failed message increases the energy consumption required to transmit each message. For a network consisting of just one node, the average energy spent to transmit each message is 0.439 mJ if three retransmissions attempts are allowed. During one second interval, the node transmits 4 messages. Additionally, the ADC is used to make 200 measurements. Each measurement takes 1 ms, resulting in an energy consumption equal to 29.7 mJ, as determined using Eq. 1. Energy per Message (J)
0.005 0.004 0.003 0.002 0.001 0 5
10
15
20
25
30
35
40
45
50
Number of Nodes Without ack - 0 Ret
1 Ret
3 Ret
6 Ret
Figure 8. Energy per message curves
P(t = 1s) = 3 * [(9.21*1) + (200 * 0.58 * 0.001)] + (4 * 0.439)
P(t = 1s) = 3 * [(9.21*1) + (200* 0.58 * 0.001)] + (4 *1.06)
(2)
A very similar lifetime value can be achieved if up to six retransmissions attempts are allowed. IV.
CONCLUSIONS AND FUTURE WORK
In this work, we have presented simulation results based on the most demanding sensor we use in our monitoring system. Considering a variable number of ECG sensor nodes, four different retransmission attempt modes, a star topology, and an error free channel, we have been able to estimate the behavior of important QoS markers, such as the throughput, delivery ratio, and maximum message delay. We have also estimated the energy a node spends to transmit a message. The simulations have shown a relation between the delivery ratio and the message delay. In fact, we have verified that increasing the number of retransmission attempts increases the delivery ratio, as well as the message delay. However, it was observed that, even using a large number of sensors, the maximum delay is still acceptable.
Figure 7. JN5139 module DC current values
0
three retransmission attempts, the average energy spent by a node to transmit a message is equal to 1.06 mJ. In this case, the energy spent during one second is equal to 32.2 mJ (see Eq. 2), resulting in a lifetime equal to approximately 112 hours.
(1)
If the module is powered by a +3V, 1200 mAh battery, a lifetime of 121 hours of continuous operation can be achieved. If we consider a network consisting of 35 nodes, and up to
In order to assure high system reliability, it is necessary to guarantee a very high delivery ratio. We conclude that, considering the simulated scenario, it is possible to have a network consisting of up to 30 ECG sensors and still obtain a high delivery ratio and an adequate lifetime, if three or six retransmissions attempts are allowed. REFERENCES [1]
M. Ilyas and I. Mahgoub (Ed), Handbook of Sensor Networks: Compact Wireless and Wired Sensing Systems, Boca Raton, CA: CRC, 2005. [2] H. Fernández-López, J. A. Afonso, J. H. Correia, and R. Simões, “Extended Health Visibility in the Hospital Environment,” Proceedings of the Intl. Conf. on Biomedical Ectronics and Devices (Biodevices 2009), Porto, Portugal, January 2009, in press. [3] N. F. Timmons and W. G. Scalon, “Analysis of the Performance of IEEE 802.15.4 for Medical Sensor Body Area Networking,” Proceedings of the IEEE Comm. Society Conf. on Sensor and Ad Hoc Comm. and Networks (SECON’04), Santa Clara, USA, 2004, 16-24. [4] B. Latre, P. D. Mil, I. Moerman, B. Dhoedt, P. Demeester, and N. V. Dierdonck, “Throughput and Delay Analysis of Unslotted IEEE 802.15.4,” Journal of Networks, 1(1), 2006, pp. 20-28. [5] X. Liang and I. Balasingham, “Performance Analysis of the IEEE 802.15.4 based ECG Monitoring Network,” Proceedings o the 7th IASTED International Conferences on Wireless and Optical Communications, May 30-June 1, 2007, Montreal, Canada. [6] N. Golmie, D. Cypher, and O. Rebala, “Performance Analysis of Low Rate Wireless Technologies for Medical Applications,” Computer Communications 28, 2005, pp. 1266-1275. [7] IEEE Std. 802.15.4-2003, Wireless Medium Access Control (MAC) and Physical Layer (PHY) Specifications for Low-Rate Wireless Personal Area Networks (LR-WPANs), IEEE, October 1st, 2003. [8] ZigBee Doc. 053474r06, Ver 1.0, ZigBee Alliance, Dec 14th, 2004. [9] OMNet ++ homepage: www.omnet.org [10] Jennic Ltd, JN-DS-5139-xxx-Myy 1v4 Preliminary, September 29th, 2008.