Network Traffic Classification Using A Parallel Neural Network Classifier Architecture [Extended Abstract] Bereket Mathewos
Marco Carvalho, PhD
Fredric M. Ham, PhD
Florida Institute of Technology 150 W. University Blvd. Melbourne, FL 32901
Institute for Human and Machine Cognition 40 S. Alcaniz St. Ocala, FL 34471
Florida Institute of Technology 150 W. University Blvd. Melbourne, Fl 23901
[email protected]
[email protected]
[email protected]
ABSTRACT Online traffic classification is an important capability for numerous applications, including network monitoring, QoS (Quality of Service) management, and anomaly detection. In this paper we propose an approach to classify TCP/IP network traffic based on a small set its statistical properties. Our approach relies on a Parallel Neural Network Classifier Architecture (PNNCA) for classification, and has been preliminarily tested for the classification of HTTP traffic in controlled environments. Our initial results have shown a Correct Classification Rate of 85% to 91%, depending on the characteristics of the test sets.
Categories and Subject Descriptors C.2.3 [Computer-Communication Operations---Network Monitoring
Networks]:
Network
General Terms Supervised Learning, Neural Network Classifiers
Keywords TCP/IP Traffic profiling, Parallel Neural Network Classifier Architectures, Web traffic classification
1. INTRODUCTION In the context of the work, traffic classification consists of the ability to identify a type, or a class of network traffic between applications, based only on its network properties, that is, without any pre-conceived knowledge about the source and destination applications, or their host operating systems. The underlying assumption is that network traffic can be observed at any point between source and destination and an assessment about its class can be made based on its properties. The specific classes of interest are application dependent and will drive the required set of features, and often the proposed classification strategy. For example, previous research efforts have sought to classify the end-point applications (e.g. email, web-browsers, etc.) based on their network traffic [1], while Permission to make digital or hard copies of all or part of this work for personal or classroom use is granted without fee provided that copies are not made or distributed for profit or commercial advantage and that copies bear this notice and the full citation on the first page. To copy otherwise, to republish, to post on servers or to redistribute to lists, requires prior specific permission and/or a fee. CSIIRW '11, October 12-14, Oak Ridge, Tennessee, USA Copyright © 2011 ACM 978-1-4503-0945-5 ISBN ... $5.00
others, have focused on the identification of specific protocols and its variants [13], or on the detection of traffic anomalies for intrusion detection and network defense. In this work, we focus on the specific problem of classifying TCP/IP session patterns between source and destination. The goal is to create a tool that recognizes specific HTTP session patterns so they can be compared with known, or expected profiles for given services or applications. The motivation for this work comes from a cyber security application for SCADA systems. One intuitive approach to enable access to SCADA systems is through the deployment of protected web services and web interfaces [15]. This capability enables and greatly facilitates remote access to the systems, but it also tends to create an opportunity for cyber attacks and compromises. We propose that a general traffic classifier that can be trained to recognize access to these specific web servers and services, independent of the source, destination and network delays will help protect these networks by identifying unexpected and unauthorized sessions that could be traced to compromised proxies, or fake interface sites used for capturing passwords or other use information. For that purpose, our approach is focused on the classification of specific web-sessions, using a pre-training parallel neural network classifier. Our classification features are based on statistical metrics of the traffic, rather than native features of the network connection and flows such as IP addresses or port numbers, etc. The goal is to build a classifier that can be trained to recognize a session in a controlled environment, but can be to classify general traffic. To illustrate our approach, our preliminary results were based on the session analysis of well-known websites, chosen as surrogates to specific SCADA interface systems and webservices.
2. RELATED WORK Online traffic classification is certainly not new. Some of the earlier efforts refer back to Paxson [11] who proposed an empirically derived model for TCP/IP Internet traffic. A. W. Moore and D. Zuev [1] proposed the use of Bayesian Analysis techniques to categorize Internet traffic flows. The method proposed in [1] is used to classify traffics according to their application. Karagiannis et al. [12] proposed the classification of traffic based on host behavior, and M. Crotti et al. [8] proposed the classification of traffic based solely on statistical properties of the flows. M. Crotti et al. have shown that
information obtained from packet inter-arrival time, size of the IP packets and their order exclusively can exclusively be used to categorize traffics. These properties or features are independent of a particular network configuration; especially IP addresses which, even on the same site, can change over time.
3. PROPOSED APPROACH In our work, we propose to use a Neural Network based classifier. The hypothesis is that for an appropriate set of features, the classifier can be trained in a controlled environment and can be used on general deployments with reasonable accuracy.
3.1 Traffic Classification Classification is done using the parallel Neural network Classifier Architecture (PNNCA). A PNNCA is made up of blocks of classifiers that work parallel [4]. Figure 1 shows the architecture of a PNNCA. Each block is made up of a Radial Basis Function Neural Network (RBF NN). An RBF NN consists of three layers: input layer, hidden layer, and an output layer [6], and its output is calculated as: 𝑦! =
! !!! 𝑤!" 𝜙!
𝑥, 𝑐! , 𝑖 = 1,2, … , 𝑚
(2)
Where, x is an input vector, N is the number of neurons in the hidden layer, 𝑤!" are weights in the output layer 𝑐! are the RBF centers in the output vector and m represent the number of output units. 𝜙! , a Gaussian RBF function given as: 𝜙 = 𝑒 (!
!!! ! ) !!
(3)
The spread parameter σ, which controls the width of the RBF, is a very important parameter and it directly influences the accuracy of the classifier. We have optimized the parameter to give a better classification.
4. EXPERIMENTAL EVALUATION 4.1 Data set For this research work, we have used data collected at the Information Processing laboratory, at the Florida Institute of Technology. The data used for training the classifier contains only forward packet flows to websites. For this paper, we have chosen 6 websites to train our classifier and those 6 and different others for testing the classifier we developed. A summary of the data used in this study is shown in table I. To ensure the robustness of the classifier, the data was captured multiple times in one week at different times in a day. Table 1. Number of sessions per domain Traffic from
# of sessions
google.com yahoo.com bing.com fit.edu cnn.com bbc.com
2570 2190 2490 2520 2510 1860
Packets captured using capturing tools consist of more than 20 fields of which we use only 5 of them; time, source IP address, destination IP address, protocol and frame length or packet size. All flows from same destination and source IP addresses are grouped together. Flows with protocols different from TCP and HTTP were filtered out as we are only concerned with web traffic. After arranging the data according to their source and destination IPs, statistical features can be computed from the corresponding time and packets size information of the packets. Our first goal was to identify patterns that can be seen in flows of web traffic data. M. E. Crovella and A. Bestavros [2], have shown that self-similarity properties exist in web traffics. Self-similarity is the property of web traffic patterns to remain unchanged regardless of time. Since we are looking at temporal patterns, our search for a pattern was focused on observing how a session behaves through time. Packet sizes of different sessions for a specific website exhibit patterns.
4.2 Feature Selection Feature selection plays an important role in any classification problem. Before classification it is important that we know the characteristics of flows. The classification is carried out based on a feature vector. The attributes contain important information regarding the data they represent. Figure 1. Structure of a PNNCA The number of blocks in the PNNCA is equal to the number of classes and weights of each block are set during individual training. Each block of the parallel classifier is trained to tell if a class belongs to it or not. The PNNCA uses the negative reinforcement learning algorithm (i.e., as it learns to identify packets belonging to that class, it also learns to reject packets not belonging to the class). To measure the performance of the classifier, the Correct Classification Rate (CCR) is used along with a confusion matrix, which will be explained later in section5.
For web traffic classification, features are computed for each bursty packet [5]. When a user’s request to a website is acknowledged, a burst of packets will be sent to the website’s server. Bursty packets are consecutive packets grouped together representing a session. The inter-arrival time information can be used to determine burst characteristics [5]. Packets are grouped together as bursts if their inter arrival time is greater than a certain predefined threshold. The predefined threshold is set in such a way that it separates one set of flow or a session from the next. For example, if a user accesses a webpage three times, then the threshold should be able to separate the packets in three bursts. Each session is described by a set of features. Previous studies have used a number of features to describe network traffic and classify them [7, 10]. The features are used to discriminate
individual web traffic flows. A. W. Moore, et al [3], described sets of discriminators for use in traffic classification. They use 248 features to define a traffic sample. Other researchers have used a smaller number of features because of the redundancy in the 248 available features. Runyuan Sun, Et al, [7] used 22 statistical features to represent traffic; we have reduced that number to 17, shown in table 2, because only forward traffic flows are considered in this study. 8 statistical features related to interarrival time and 8 related to packet size information were computer as traffic features. The number of forward packets is the other feature. Inter-arrival time is the time difference between consecutive packet flows in a session. It is defined as: timeint-arr = timei-timei-1 i= 1,2,3, … n,
belonging to different traffics. For example, if a user is sending request to 2 different websites, 2 destination addresses associated with them, then the algorithm will group the data into 2.
(1)
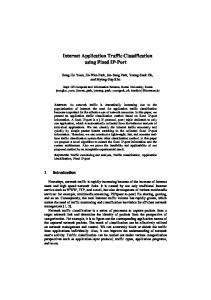
where n is the number of flows in a session Table 2. Features used Flow metrics (duration, packet-count) Packet size /payload information (mean, variance, median, minimum, maximum,1st & 3rd quartile) Total packets (forward flow) Figure 3. ROC Curve for Google.com Figure 2 shows the set of normalized feature vectors for one session of the class www.google.com. Feature vectors are fed to a neural network for classification.
Therefore, for training our neural classifier, we grouped the data to 6 groups, each group representing the 6 websites under test in this research. Burst packets are then decided to separate sessions between each of the 6 groups. We have used packet size information and inter-arrival time to select the threshold in deciding burst packets. The threshold was set to 0.1 second. We use these burst packets to define sessions in each of the 6 classes. The training data used is shown in Table 2, section4. Features for the training data were obtained as discussed in section4. Each session was represented by set of features. Table 3. Confusion Matrix for a test dataset collected from the training network Predicted
A ROC curve is used to determine the optimal threshold values. A ROC curve is a plot of true positive rate, or sensitivity, versus false positive rate, or specificity [9]. The optimal point on the ROC curve would be the minimum distance between points on the ROC curve and the point (0,1), i.e, maximizing the True positives while minimizing the false positives. A ROC curve corresponding to the classifier associated with one of the classes under test, www.google.com, is shown in Figure 3.
5. RESULTS AND SIMULATIONS All simulations in this research work were performed using MATLAB. Data were collected at the Florida Institute of Technology, Information Processing Laboratory. As previously stated, to ensure robustness we have collected data in different times. Packet dump headers were collected from the machine interfaces in each case. The information obtained from the tool includes, Source and Destination IPS, the time packets are sent, protocol type, and packet length. Afterwards an algorithm was developed to group packet flows according to their source and destination IP addresses. Here prior knowledge of the source and destination IP addresses is not required; the grouping is just to separate packets
Actual
Figure 2. Feature vectors for Google.com
G
Y
B
F
C
BB
U
Total
G
1158
0
27
0
0
0
8
1170
Y
0
834
0
0
0
105
25
956
B
5
0
1088
6
0
2
19
1112
F
1
21
1
1074
0
4
29
1105
C
0
3
1
0
1127
0
0
1128
BB
0
0
0
0
76
802
8
880
O
1
4
12
1
6
2
329
340
The classifier was trained to classify traffics as belonging to each of the 6 traffics. The RBF spread parameters for each neural classifier block were optimized to maximize the overall correct classification rate. Performance of the classifier was measured by calculating the CCR [4] and Accuracy (ACC): CCR =
(No. of correct predictions – No. of multiple classifications) (3) (No. of predictions)
𝐴𝐶𝐶 =
𝑁𝑜. 𝑜𝑓 𝑐𝑜𝑟𝑟𝑒𝑐𝑡 𝑃𝑟𝑒𝑑𝑖𝑐𝑡𝑖𝑜𝑛𝑠 (4) 𝑇𝑜𝑡𝑎𝑙 𝑁𝑜. 𝑜𝑓 𝑝𝑟𝑒𝑑𝑖𝑐𝑡𝑖𝑜𝑛𝑠
In this research, we have used two data sets for test; one containing 6 traffics forward flows to only the 6 trained websites, and another data set that contains other web traffics in addition to
the 6 trained traffics. The second data set is different from the first because it also contains other traffics. The CCR and ACC were calculated using (3) and (4) respectively, for both test datasets. For the first dataset, the CCR obtained was 96.92 % while the ACC is 99%. For the second dataset the CCR was computed to be 91% and the ACC is 95%. Table 3 shows the confusion matrix for the second data set. The diagonal elements in the confusion matrix represent correctly classified traffics, whereas, the off diagonal elements represent misclassifications. G, Y, B, F, C, BB, U, and O represent google.com, yahoo.com, bing.com, fit.edu, cnn.com, bbc.com, unclassified and other classes respectively. The results shown in Table 3 are based on training and tests dataset collected at the same network; however the proposed classifier is expected to perform well on traffic generated from other networks, with different conditions. Once trained, the PNNCA should be able to classify sessions to the same website (in this example), even if initiated by clients located in different networks. For that purpose, the trained PNNCA was used to classify traffic collected from several different networks. The goal was to evaluate the system against datasets that would be under the influence of different network conditions, including bandwidth, utilization and capacity. In all cases, the CCR was above 85%. Table 4 show an example of a confusion matrix from one of the remote networks, just to illustrate the classification error in each case. Table 4. Confusion Matrix for a test dataset collected from a different network
Actual
Predicted G
Y
B
F
C
BB
U
Total
G
724
2
32
0
0
0
29
763
Y
0
801
1
0
0
53
17
813
B
0
0
497
18
0
1
22
512
F
0
1
5
907
7
15
31
951
C
2
2
0
0
452
4
22
470
BB
0
0
2
0
32
493
25
527
O
3
1
1
5
1
2
218
223
6. CONCLUSION In this paper we introduced a neural network based approach to classify HTTP session to specific websites. Our approach was based on a supervised PNNCA to classify client sessions. In order to provide a preliminary evaluation of the proposed approach, we have used a set of well-known websites and have described the process for data acquisition. This was motivated by the possibility of identifying SCADA-related traffic (to web-proxies and webinterfaces). While still preliminary, this research has shown encouraging results, and our future work will expand the conditions of tests to better identify the factors that affect the classification and modify the algorithm to mitigate them. We also envision as part of our future work, the test of the proposed algorithms against non-static webpages, which will likely the addition of request-based features in our algorithm.
7. ACKNOWLEDGEMNTS This material is partially based upon work supported by the Department of Energy National Energy Technology Laboratory under Award Number(s) DE-OE0000511.
8. REFERENCES [1] A. W. Moore and D. Zuev, “Internet traffic classification using Bayesian analysis techniques”, SIGMETRICS Perform. Eval. Rev., vol. 33, pp.50-60, 2005. [2] M.E. Crovella and A. Bestavros, "Self-similarity in World Wide Web traffic: Evidence and possible causes," IEEE/ACM Transactions on Networking, Vol. 5, pp. 835-846, 1997 [3] A. W. Moore and D. Zuev. “Discriminators for use in flowbased classification”. Technical report, Intel Research, Cambridge, 2005 [4] F. M. Ham, K. Rekab, R. Acharyya, and Y.-C. Lee, "Infrasound signal classification using parallel RBF Neural Networks," Int. J. Signal and Imaging Systems Engineering, vol. 1, Nos. 3/4, pp. 155-167, 2008. [5] J. Park, H. R. Tyan, C. Kuo. Internet traffic classification for scalable QoS provision. In 2006 IEEE International Conference on Multimedia and Expo. Toronto, Ontario, Canada, pages 1221-1224, 2006. [6] F.M. Ham, and I. Kostanic, Principles of Neurocomputing for Science and Engineering. New York: McGraw-Hill, 2001 [7] Runyuan Sun, Bo Yang, Lizhi Peng, Zhenxiang Chen, Lei Zhang, Shan Jing, “Traffic classification using probabilistic neural networks,” International Conference on Natural Computation, Vol. 4, pp. 1914-1919,2010 [8] M. Crotti, M. Dusi, F. Gringoli, an d L. Salgarelli. Traffic classification through simple statistical fingerprinting. ACM IGCOMM CCR, 37(1):7–16, January 2007. [9] T.Fawcett, “An Introduction to ROC Analysis,” Pattern Recognition letters 27, pp. 861-874, 2006. [10] S. Zander, T.T.T. Nguyen, G. Armitage, “Self-learning IP Traffic Classification based on Statistical Flow Characteristics”, Passive & Active Measurement Workshop (PAM) 2005, Boston, USA, March/April 2005. [11] V. Paxson, Empirically derived analytic models of wide-area tcp connections. IEEE/ACM Trans. Netw. 2 (August 1994), 316–336. [12] T. Karagiannis, K. Papagiannaki, and M. Faloutsos. BLINC: multilevel traffic classification in the dark. In SIGCOMM’05: Proceedings of the 2005 Conference on Applications, Technologies, Architectures and Protocols for Computer Communications, pages 229-240, Philadelphia, PA, Aug. 2005. [13] D. Moore, K. Keys, R. Koga, E. Lagache, and K.C. Claffy. The CorralReef Software Suite as a Tool For System and Network Administrators. In LISA’01: Proceedings of the 15th USENIX Conference on Systems Administration, pages 133144, San Diego, CA, December 2001. [14] Byrski, A., and Carvalho, M. Agent-based immunological intrusion detection system for mobile ad-hoc networks. In Proceedings of the 8th international conference on Computational Science, Part III (Berlin, Heidelberg, 2008), ICCS ’08, Springer-Verlag, pp. 584–593. [15] G. Zecevic. Web based interface to scada system. In Power System Technology, 1998. Proceedings. POWERCON ’98. 1998 International Conference on, volume 2, pages 1218 – 1221 vol.2, Aug. 1998.