B. Veera Jyothi et. al. / (IJCSE) International Journal on Computer Science and Engineering Vol. 02, No. 04, 2010, 934-941
Neural Network approach for image retrieval based on preference elicitation B.Veera Jyothi
Dr.Uma Shanker
CBIT, Hyderabad.
[email protected]
Rayalaseema University, India.
[email protected]
Abstract: Multimedia technologies have been developing rapidly over the last few years and have yielded a large number of databases containing graphical documents. Tools for content-based search of graphical objects have been the subject of intensive research, but their performance is still unsatisfactory for many applications, opening up afield for further research and technology development. Up till now, all popular Internet search engines have been only text-based, including those that search for images. In this paper We propose an image retrieval system based on neural networks. The advantage of using the neural network is that the amount of semantic gap can be reduced when compared to other techniques which may be based on clustering. The methodology proposed below is designed for a specific class of objects, which can be broken down into subobjects in such a way that the main object can be classified by shape, color distribution and texture of the sub objects and the spatial spatial relations between the sub-objects in a 2dimensional image. We also assume that translation, scaling and 2D rotation do not change the class of the object, but we do not consider 3Dtransformation.Therefore, photos of the same 3D object from different positions for example are considered to be objects belonging to different class keywords: Neural network; relevance feedback; semantic gap
I. INTRODUCTION Since the early 1990’s, there has been considerable research carried out into content-based image retrieval (CBIR) systems. A few systems have been installed commercially, including Query-By-Image- Content (QBIC) (Niblack, Barber, Equitz, Flickner, Glasman, Petkovic, Yanker, Faloutsos, and Taubin, 1993), the VIR Image Engine (Bach, Fuller, Gupta, Hampapur, Gorowitz, Humphrey, Jain, and Shu, 1996), the AltaVista Photofinder, Multimedia Analysis and Retrieval System (MARS) (Huang, Mehrotra, and Ramchandran, 1996), Photobook (Pentland, Picard, and Sclaroff, 1994), Netra (Ma and Manjunath, 1999), RetrievalWare (Dowe, 1993), etc. Early research of CBIR focused on finding the “best” representation for image features, e. g., color, texture, shape, and spatial relationships. The similarity between two images is typically determined by the distances of individual lowlevel features and the retrieval process is performed by a knn search in the feature space (Del Bimbo, 1999). In this
ISSN : 0975-3397
context, high level concepts and user’s perception subjectivity cannot be well modeled. Recent approaches introduce more advanced human computer interaction (HCI) into CBIR. The retrieval procedure incorporates user’s interaction into the loop, which consists of several iterations. In each iteration, the user cast positive samples (relevant images) as well as negative samples (irrelevant images) for the returned results from the previous iteration. Based on user’s feedback, the retrieval system is able to adaptively customize the search results to the user’s query preference. This interaction mechanism is called relevance feedback, In this paper we will first discuss briefly the image retrieval approach based on clustering and secondly about image retrieval system using Neural networks and highlight the advantage of using Neural Networks over clustering. II. BACKGROUND In this section, we first present an overview of wavelets as required for understanding how images are analyzed to extract their feature vectors. A Wavelets Wavelets are basis functions defined over a finite interval, Like any basis function, a set of linear combinations of wavelets (or basis functions) can be used to represent any function f(x). Consider the Daubechies wavelet transform. The mother wavelet is continuous, and in the case of general-purpose images, performs better than the Haar wavelet (Wang, Wiederhold, Firschein, and Wei, 1997). The low (lD) and high (hD) Daubechies filters are given in Equation 2.1
Daubechies Filters (2.1)
934
B. Veera Jyothi et. al. / (IJCSE) International Journal on Computer Science and Engineering Vol. 02, No. 04, 2010, 934-941 III. IMAGE RETRIEVAL SYSTEM USING CLUSTERING CLUSTERING : Clustering algorithms find groups of items that are similar. For example, clustering could be used by an insurance company to group customers according to income, age, types of policies purchased and prior claims experience. It divides a data set so that records with similar content are in the same group, and groups are as different as possible from each other. Since the categories are unspecified, this is sometimes referred to as unsupervised learning. CLUSTERING TECHNIQUES Clustering techniques fall into a group of undirected data mining tools. The goal of undirected data mining is to discover structure in the data as a whole. There is no target variable to be predicted, thus no distinction is being made between independent and dependent variables. Clustering techniques are used for combining observed examples into clusters (groups) which satisfy two main criteria:
each group or cluster is homogeneous; examples that belong to the same group are similar to each other. each group or cluster should be different from other clusters, that is, examples that belong to one cluster should be different from the examples of other clusters.
Depending on the clustering technique, clusters can be expressed in different ways:
identified clusters may be exclusive, so that any example belongs to only one cluster. they may be overlapping; an example may belong to several clusters. they may be probabilistic, whereby an example belongs to each cluster with a certain probability.
clusters might have hierarchical structure, having crude division of examples at highest level of hierarchy, which is then refined to sub-clusters at lower levels Like most content-based image retrieval (CBIR) systems, the retrieval system consists of two major phases: the learning phase and the querying phase. In the learning phase, all the images in the database go through an indexing stage, where each image is classified as either texture or non texture. Then, based on the image type, a signature, also referred to as a feature vector, is extracted from the image. Each
ISSN : 0975-3397
image is represented in the database by a feature vector. After deriving feature vectors for all images in the database, clustering is applied to texture and non-texture images separately. Each cluster contains a set of images that are most similar to each other. Then for each cluster a representative feature vector is calculated. This representative vector is then used in the querying phase. The querying phase undergoes the same process of extracting a feature vector for the query image as the learning phase. A distance function is then calculated between the query image feature vector and the representative feature vectors of all clusters having the same class of images (texture/non-texture) as the query image. The cluster with the minimum distance from the query image is then searched for matches. A Feature Extraction The system classifies images by using the LUV color space, While L encodes luminance, which corresponds to the perceived brightness (or gray scale level) of a color, U and V encode the color information of a pixel. U corresponds approximately to the red-green color from the RGB spectrum, and V to the blue-yellow color (Healey and Enns,1999). B Clustering based on OPTICS: To cluster the images, the system employs the OPTICS clustering algorithm (Ankerst,Breunig, Kriegel, and Sander, 1999), which was developed by M. Ankerst et al..OPTICS orders the points in the database following the concept of density-based clustering algorithms. This results in a set of ordered points that are useful to determine clusters at different densities. C Experimental Analysis This section focuses on testing the system to highlight its strength, applicability and effectiveness as compared to similar approaches described in the literature. So, it is desired to test on databases of images that have been previously used to test other image retrieval systems. The proposed system was developed in Java-based software development environment. The testing has been carried out on a desktop PC equipped with an Intel Pentium CPU clocked at 3.0 GHz, and has 1.00GB of RAM. The operating system installed is Microsoft Windows XP Professional Edition SP2. TABLE 1. COREL IMAGES Categories Africa people
Beach
Buildings
Buses
Dinosaurs
Elephants
Flowers
Horses
Food
& villages Mountains & glaciers
We tested the power of the system in classifying and querying non-texture images. We also compared the
935
B. Veera Jyothi et. al. / (IJCSE) International Journal on Computer Science and Engineering Vol. 02, No. 04, 2010, 934-941 performance of proposed system to other CBIR systems already described in the literature. The images used in the experiments were taken from the Corel database, which is a set of non-texture images. A subset of this database, available online, is used in the conducted experiments. 1000 images, of size 256×384 and jpeg format, containing ten different categories listed in Table 1, were used, where each category contains 100 images. With the images belonging to known categories, this made it easier to track the results and gauge system performance. We demonstrate the power of the system by primarily comparing the achieved results with those reported by two already developed systems (Chang and Kuo, 1993; Wang, Li, and Wiederhold, 2001), which were tested on the same set of images. The first criteria analyzed is the effectiveness and speed of classification as compared to the one used by Wang et al (Li,Wang, and Wiederhold, 2000; Wang, Li, and Wiederhold,2001), along with the time needed to classify an image. It was easy to analyze the effectiveness of the system because it was known in advance what the total number of correct non-texture images would be. The second parameter being considered is the precision of querying based on the feature vectors extracted; the higher the system’s precision, the higher the percentage of matching images returned to a query. The most favorable condition would be for 100% matching of images, since the idea behind a CBIR system is to retrieve from the database the maximum number of images that match a query image. For the evaluation, the definition given in Equation 3.1 is used for precision. Number of images returned Precision = Number of correct images returned (3.1)
The third factor under consideration is determining the effectiveness of incorporating clustering on the performance. For each image submitted as a query, the number of correct images returned when clusters were considered is divided by the number of correct images returned when all images in the database were checked. The results for all images belonging to one category are averaged and recorded in Table 2.
TABLE 2. COREL CLUSTERING PRECISION Category
Precision
African people
No. sampled images 100
Buildings
100
75.88%
Dinosaurs
100
91.62%
Flowers
100
51.82%
Mountains Beach
100 100
62.91% 76.27%
Buses
100
75.03%
Elephants
100
66.31%
Horses
100
Food
100
60.23%
Total & Average
1000
69.09
72.55%
58.25%
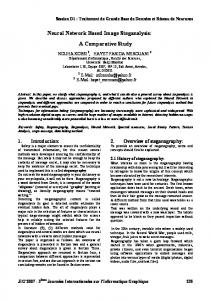
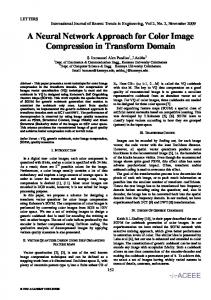
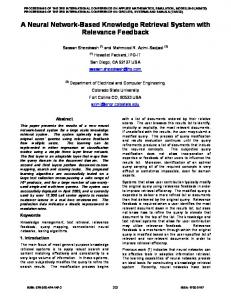
The relatively low precision and clustering precision values for the tested images merited a closer look. Several queries were run with selected images. The aim of the extra experiments is to try and pinpoint the reasons for the reported precision values. The first two queries run are shown in Figures 1 and 2.The query image is shown first (on the left) followed by the top five matches returned by the proposed system. From Figures 1 and 2, it can be concluded that the feature vector calculated by the proposed system is accurate for images containing only a single object The next two queries run are shown in Figures 3 and 4.These two queries demonstrate that the proposed algorithm is able to extract the feature vectors when the image contains only one object of interest, but there is a prominent background. The final two queries run are shown in Figures 5 and 6. The query images contain multiple objects. As seen from these images, the performance of the proposed system deteriorates when the query image contain multiple objects.
Figure 1. Sample query 1
Figure 2. Sample query 2
ISSN : 0975-3397
936
B. Veera Jyothi et. al. / (IJCSE) International Journal on Computer Science and Engineering Vol. 02, No. 04, 2010, 934-941
. Figure 3. Sample query 3
Figure4. Sample query 4
Figure 5. Sample query 5
combine values coming from preceding layers in the network--MLPs use inner products, while RBFs use Euclidean distance. There are also differences in the customary methods for training MLPs and RBF networks, although most methods for training MLPs can also be applied to RBF networks. Furthermore, there are crucial differences between two broad types of RBF network-ordinary RBF networks and normalized RBF networks--that are ignored in most of the NN literature. These differences have important consequences for the generalization ability of the networks, especially when the number of inputs is large. In this section, we propose the application of neural networks with Radial Basis Function (RBF) (Park, & Sandberg 1991) for user preference approximation. In contrast to methods described in previous sections, we do not model the user’s preferences as a distance to a query (i.e. point of set of points in feature space) but we assume that the user’s preferences can be expressed by an arbitrary utility function, which we approximate with the neural network. A model of a neuron with RBF network is depicted in Figure 8.
Figure 6. Sample query 6 One way to overcome this limitation would be to introduce segmentation into the proposed algorithm. This would improve the rate of matches when multiple objects are concerned. This idea is presented in Figure 7. Both the learning and querying phases would be expected to take more time to complete, where multiple objects are found within an image. However, it is expected that matching precision would be improved.
Figure 8. Model of neuron with Radial Basis function A. RBF NN-based Classifier RBF neural networks have recently attracted extensive research interests in community of neural networks because: (1) they are universal approximations, (2) they have very Compact topology, (3) their learning speed is very fast because of local-tuned neurons, (4) they possess the best approximation property. Structure of RBF Neural Network Figure 9 shows the basic structure of RBF neural networks.
Figure 7. Segmentation
IV. IMAGE RETRIEVAL SYSTEM BASED ON NEURAL NETWORKS Multilayer perceptrons (MLPs) and radial basis function (RBF) networks are the two most commonly-used types of feedforward network. They have much more in common than most of the NN literature would suggest. The only fundamental difference is the way in which hidden units
ISSN : 0975-3397
Figure 9. Radial Basis function Neural Network. The output of the ith RBF unit is as follow: (4.1) where x is an input feature vector with r dimensional, ci is a r-dimensional vector named center of RBF node, n is the
937
B. Veera Jyothi et. al. / (IJCSE) International Journal on Computer Science and Engineering Vol. 02, No. 04, 2010, 934-941 number of hidden node . Typically, R(x) is chosen as a Gaussian function as follow: (4.2) The jth output of RBF neural network is: (4.3) Where w2 (j , i ) is the weight of the ith RBF node to the jth output node and b( j) is the bias of the jth output. The bias is not considered in this in order to reduce network complexity. Henc:
(4.4) Advantages/Disadvantages of RBF neural Networks: •
RBF trains faster than a MLP
• Another advantage that is claimed is that the hidden layer is easier to interpret than the hidden layer in an MLP. • Although the RBF is quick to train, when training is finished and it is being used it is slower than a MLP, so where speed is a factor a MLP may be more appropriate. • Statistical feed-forward networks such as the RBF network have become very popular, and are serious rivals to the MLP. • Essentially well tried statistical techniques being presented as neural networks. • Learning mechanisms in statistical neural networks are not biologically plausible – so have not been taken up by those researchers who insist on biological analogies. B. Training or determination of model parameters Training of RBF networks is carried out using a hybrid procedure consisting of both supervised and unsupervised learning methods. The output layer is trained by a supervised learning method, similar to that used in the BP algorithm in which the synaptic weights are updated in proportion to the difference between the network output and the target output. Training of the hidden layer on the other hand involves the determination of the radial basis functions by specifying appropriate Uj and σj for each node. These parameters are dependent only on the inputs and are
ISSN : 0975-3397
independent of the outputs, making this part of the learning process an unsupervised one. The original RBF method requires that there be as many RBF centres as there are distinct data points in the input space. This however, is not possible in practice because of the large numbers of input points found in most real situations. Moreover, the inputs usually occur in clusters making overlapping of receptive fields inevitable. Choosing all points as RBF centres will therefore lead to an unnecessarily large network involving long training and computation times. An effective way of reducing the number of nodes in the hidden layer is by "clustering" the input points such that each point falls into one of the hyperspheres which collectively span the entire input space (Wasserman, 1993). Each of the RBF centres (Ujs) will then be located at the centres of each cluster. Definition of the "centre" of the cluster depends on the type of clustering technique adopted. In this study £-means clustering algorithm (Moody & Darken, 1989) is adopted where the centre is defined as the centroid (in this context, the centroid is the centre of gravity of unit masses located at each point belonging to the cluster). The value of σj is computed as the mean distance from the centre of the cluster to other points that form the cluster. The number of hidden nodes is equal to the number of clusters k. In the literature, various algorithms are proposed for training RBF networks, such as the gradient descent (GD) algorithm and Kalman filtering (KF) .These two algorithms are derivative based and have some weaknesses such as converging to a local minima and time-consuming process of finding the optimal gradient. Because of these limitations, several global optimization methods have been used for training RBF networks for different science and engineering problems such as genetic algorithms (GA), the particle swarm optimization (PSO) algorithm , the artificial immune system (AIS) algorithm and the differential evolution (DE) algorithm. Training Algorithms of RBF Networks 1.Gradient Descent (GD) Algorithm GD is a first-order derivative based optimization algorithm used for finding a local minimum of a function. The algorithm takes steps proportional to the negative of the gradient of the function at the current point. In , the output of a RBF network has been written as:
(4.5) And
938
B. Veera Jyothi et. al. / (IJCSE) International Journal on Computer Science and Engineering Vol. 02, No. 04, 2010, 934-941 (4.6) where the weight matrix is represented as W and Ԅ matrix is represented as H. GD algorithm can be implemented to minimize the error after defining the error function: (4.7) where Y is the desired output. RBF can be optimized with adjusting the weights and center vectors by iteratively computing the partials and performing the following updates:
(4.8) where η is the step size. 2. Kalman Filtering (KF) Algorithm The state of a linear dynamic system can be efficiently estimated by Kalman filter from a series of noisy measurements. It is used in a wide range of engineering applications from INS/GPS integration to computer vision and many applications in control theory. A nonlinear finite dimensional discrete time system has been considered in as:
(4.9)
crossover are the main aspects of GA that inspired from evolutionary biology. The population refers to the candidate solutions. The evolution starts from a randomly generated population. For all generations, the fitness (typically a cost function) of every individual in the population is evaluated and the genetic operators are implemented to obtain a new population. In the next iteration the new population is then used. Frequently, GA terminates when either a maximum number of generations has been reached, or a predefined fitness value has been achieved. In RBF training, the individuals consist of the RBF parameters such as weights, spread parameters, center vectors and bias parameters. The fitness value of an individual can be evaluated using an error function such as MSE or SSE of the desired output and the actual output of the network. In the case of the RBF network, unlike most other neural networks, coefficients w that are changed during the learning process are not weights: the output on the neuron depends on the distance between vector w and the input vector. Neuron input can be interpreted as a set of descriptors of the graphical object: output is high when the object’s feature represented by input is similar to the object’s feature represented by the neuron (vector w). In the training process, the neuron is taught to represent any feature desired by the user. Roughly speaking, vector w corresponds to a virtual query (but in this case, there can be many virtual queries) or in other words, it corresponds to the local maximum of utility function in a subspace of a feature space. The network structure which we used for preference approximation is depicted in Figure 10.
where the vector θk is the state of the system at time k, ωk is the process noise, yk the observation vector, vk is the observation noise and h is the nonlinear vector function of the state. KF can be used to optimize weight matrix and center vectors of RBF as a least squares minimization problem. In a RBF network, y denotes the target output vector and h(θk) denotes actual output of the kth iteration of the optimization algorithm. Figure 10. Structure of a neural network used for preference approximation in our image retrieval system. (4.10) The vector θ thus consists of all RBF parameters:
(4.11) 3. Genetic Algorithms (GA) GA is an optimization method used in many research areas to find exact or approximate solutions to optimization and search problems. Inheritance, mutation, selection and
ISSN : 0975-3397
For every representation mi there is a defined and separate sub-network Si with metric adjusted to the specific kind of representation (e.g. histogram intersection for color histogram). The number of neurons for i-th representation is chosen automatically in such a way that the sub-network Si can be trained to ensure that the margin of error is below a specific threshold, therefore the network is able to approximate utility functions regardless of shape. The output neuron, which combines outputs of sub-networks is trained by linear regression.
939
B. Veera Jyothi et. al. / (IJCSE) International Journal on Computer Science and Engineering Vol. 02, No. 04, 2010, 934-941
C. Algorithm: Interactive retrieval of non-homogenous objects based on RBF network
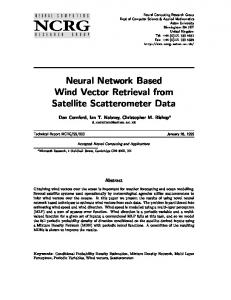
objects contains all those representing the Centrarchidae family: see images 1-5 and 10 in Figure 11.
Phase 1. Calculation/upgrade of the virtual query Step 1: Presentation of K images to the user, who can assign to them grades (positive or negative). Value of πk ranks user’s perception of similarity between a given image and the image q*, which he/she is looking for. The image with the highest value of πk. is denoted by m* Figure 11. The result of a single iteration of the algorithm based on neural networks
Step 2: Segmentation of object m* with Edge Flow algorithm. Step 3: For each object m(k) with a defined value πk finding parameters of transformation which gives the best match to the model m*, e.g. by minimalization of the Hausdorff distance. Step 4: Matching of objects m* and m(k) according to transformation found in Step 3 and calculation of local descriptors of color and texture for areas of object m(k) corresponding to sub-objects of m*. Step 5: Training of the network. Three sub-networks (for: shape, texture and color) are trained separately. Training set is a set of images presented to the user. For each of these images: a. Input vector of the i-th sub-network, i={1 for shape, 2 for texture, 3 for color} is a subset of features mi(k,r). b. Desired output of sub-network is relevance πk. Weights of the output neuron are found using linear regression in order to minimize total error of the network.
V CONCLUSIONS 1. In the first approach Clustering was used to reduce the search space by grouping similar images together in order to make querying faster. Some of the conclusions drawn from the experimentation are presented here. The classification algorithm is very fast and accurate in classifying images. This is very encouraging, especially for using the proposed system with large databases of images. Many of the queries that were run returned 100% matches, i.e., no wrong images were returned. 2. The second method, based on RBF neural networks, is based on breaking down graphical object into subobjects. Low-level features of sub-objects (like color, texture and shape) and the mutual relations between them are used for the elicitation of user queries. Target applications are mostly interactive atlases and multimedia encyclopaedias which allow the user to search for an item based on a memorized image. VI FUTURE RESEARCH DIRECTIONS 1.
Phase 2. Calculation of ranking of images from the database Step 6: Simulation of the network for all images in the database and ranking them according to value of the network output. Step 7: If the set of top K images is the same set as in the previous iteration, STOP. Otherwise, return to Step 1.
D. Comparison of Performance for Existing and Neural Network-Based Approaches 2. In Figure 11, we present the results of the first iteration of the algorithm based on the RBF neural network. The result is satisfactory: we find that the first five images from Figure 10 are the most similar to the query image in the whole database (this is, of course, a subjective view, we do not present the whole database here but suppose that most users would agree). It is worth noting that the set of 12 retrieved
ISSN : 0975-3397
As was noted, there were images in some categories that did not really fit in with the rest of the images in their category. Hence, they would not be expected to return as matches from the same category. The clustering that was implemented yielded query results that were very close to the results generated when clustering was disabled. This led to the conclusion that the clustering does not result in significant deterioration in performance. The concept of segmentation is important and should improve system performance where multiple objects are found in an image. This improvement in extracting nontexture feature vectors should also improve the matching rate when clustering is turned on. An optimal man-machine interface when designing a query and providing feedback information, and Optimised navigation in the feature space, and an adaptive feature space contraction/expansion. Research on including 3D-invariants in the IR, investigation of suitable 3D-transformations IR for 3D and moving objects.
940
B. Veera Jyothi et. al. / (IJCSE) International Journal on Computer Science and Engineering Vol. 02, No. 04, 2010, 934-941 VII ACKNOWLEDGEMENT This is to acknowledge that sincere thanks to I.R.C.Reddy, Director, CBIT. Dr.Chennakeshava Rao, Principal, CBIT.And all others who assisted me in bringing out this work successfully. VIII. REFERENCES [1] Ms.B.Veera Jyothi, Artificial Intelligence approach for improving the performance of Image retrieval system. In Proceedings International Conference for Technical Post Graduates December 2009. [2] Ankerst, M., Breunig, M.M., Kriegel, H.-P & Sander,J. (1999). Optics: Ordering points to identify the clustering structure. In Proceedings ACM SIGMOD International Conference on Management of Data, pp 49–60. [3] Bach, Fuller, Gupta, A.,Hampapur, A., Gorowitz, B, Humphrey, R., Jain, R., & Shu, C. (1996).Virage image search engine: An open framework for image management. In Proceedings of the SPIE Conference on Storage and Retrieval for Image and Video Databases IV, pp. 76–87. [4] Boggess, A., & Narcowich, F.J. (2001). A first course in wavelets with Fourier analysis, chapter Haar wavelet analysis, pp. 155-178. Prentice Hall. [5] Chang, T., & Jay, C.C., & Kuo. (1993). Texture analysis and classification with tree-structured wavelet transform. IEEE Transactions on Image Processing, 2(3), 429–441. [6] Columbia University. WebSeek. Available at http://persia.ee.columbia.edu:8008/Convera.PurchasingRetrievalWare. Available at http://www.convera.com/. [7] Chuang, S.C., et al. (2006) “A Multiple-Instance Neural Network-based Image Content Retrieval System”, in Proceedings of the First International Conference on Innovative Computing, Information and Control (ICICIC), 2006. [8].Doulamis, N., & Doulamis, A. (2006). “Evaluation of relevance feedback schemes in content-based in retrieval systems” Signal Processing: Image Communication, Vol. 21, Issue 4, April 2006, 334-357. [9]. Liu, Y.; Zheng, Q.; Shi, Z.; Chen, J. Training radial basis function networks with particle swarms.Lect. Note. Comput. Sci. 2004, 3173, 317– 322. [10]. Simon, D. Training radial basis neural networks with the extended Kalman filter. Neurocomputing2002, 48, 455–475. [11]. Karayiannis, N.B. Reformulated radial basis neural networks trained by gradient descent. IEEETrans. Neural Netw. 1999, 3, 2230–2235. [12]. Barreto, A.M.S. Barbosa, H.J.C.; Ebecken, N.F.F. Growing Compact RBF Networks Using a Genetic Algorithm. In Proceedings of the 7th Brazilian Symposium on Neural Networks, Recife, Brazil, 2002; pp. 61–66. [13]. De Castro, L.N.; von Zuben, F.J. An Immunological Approach to Initialize Centers of Radial Basis Function Neural Networks. In Proceedings of Brazilian Conference on Neural Networks, Rio de Janeiro, Brazil, 2001; pp. 79–84. [14]. Yu, B.; He, X. Training Radial Basis Function Networks with Differential Evolution. In Proceedings of IEEE International Conference on Granular Computing, Atlanta, GA, USA, 2006; 369–372.
ISSN : 0975-3397
941