K.A.G. Udeshani, R.G.N. Meegama & T.G.I. Fernando
Statistical Feature-based Neural Network Approach for the Detection of Lung Cancer in Chest X-Ray Images K.A.G. Udeshani
[email protected]
Excel Technology Lanka Ltd Thimbirigasyaya Road Colombo 05, Sri Lanka
R.G.N. Meegama
[email protected]
Department of Statistics and Computer Science Faculty of Applied Science University of Sri Jayewardenepura Gangodawila, Nugegoda, Sri Lanka
T.G.I. Fernando
[email protected]
Department of Statistics and Computer Science Faculty of Applied Science University of Sri Jayewardenepura Gangodawila, Nugegoda, Sri Lanka
Abstract Lung cancer, if detected successfully at early stages, enables many treatment options, reduced risk of invasive surgery and increased survival rate. This paper presents a novel approach to detect lung cancer from raw chest X-ray images. At the first stage, we use a pipeline of image processing routines to remove noise and segment the lung from other anatomical structures in the chest X-ray and extract regions that exhibit shape characteristics of lung nodules. Subsequently, first and second order statistical texture features are considered as the inputs to train a neural network to verify whether a region extracted in the first stage is a nodule or not . The proposed approach detected nodules in the diseased area of the lung with an accuracy of 96% using the pixel-based technique while the feature-based technique produced an accuracy of 88%. Keywords: Lung Nodule, Computer Assisted Diagnostic, Artificial Neural Network, Chest Radiography, Medical Imaging
1. INTRODUCTION Lung cancer is the growth of a tumor, referred to as a nodule, that arise from cells lining the airways of the respiratory system. These cells are often in bright contrast in chest X-rays and take the shape of a round object. However, these nodules that can be seen in a chest X-ray may not necessarily be a lung cancer; it can be due to some other disease such as pneumonia, tuberculosis or calcified granuloma. As such, the detection of lung cancer has been a tedious task in medical image analysis over the past few decades. If lung nodules can be identified accurately at an early stage, the survival rate of the patients can be increased by a significant percentage. In the health industry, chest X-rays are considered to be the most widely used technique for the detection of lung cancer. However, because it is difficult to identify lung nodules using raw chest X-ray images, analysis of such medical images has become a tedious and complicated task. This paper presents a novel technique that can be used to detect lung cancer in early stages. With the evolution of various technologies, several projects have been carried out to identify lung cancer at early stages. In these projects, digital photographs of chest X-rays and CT scans have been used to identify lung cancer. In recent research literature, it is observed that principles of neural networks have been widely used for the detection of lung cancer in medical images with simulated lung nodules [1, 5], massive training artificial neural networks [11], two level neural classifiers [23], hybrid lung nodule detection [24], and ladder structured decision trees [6, 25]. A co-occurrence matrix and texture measures have been used in [3] to
International Journal of Image Processing (IJIP), Volume (5) : Issue (4) : 2011
425
K.A.G. Udeshani, R.G.N. Meegama & T.G.I. Fernando
detect lung nodules. A rectangular area of a chest X-ray was considered in [4] as the input to a neural network. Apart from using chest X-rays, researchers have used an ensemble of artificial neural networks to detect cancer cells in specimen images of needle biopsies [2]. A template matching algorithm [7] and genetic algorithms [8] have been used to detect lung nodules. These are quite fundamental approaches to detect nodules where the similarity between an unknown object (observed image) and a template (reference image) are compared. One of the most common problems encountered during identification of lung nodules is overlapping of the ribs and clavicles with nodules. Such overlapping of images results in the detection of suspicious areas difficult. Several rib suppression techniques have been proposed in recent research literature such as blind source separation [9], texture analysis [12], watershed segmentation [10], Gaussian filters [14], active shape modeling [15] and quasi-gabo filters [12]. In [13], a set of features that contain translation invariant wavelet based features and cooccurrence features of mammograms were used to classify images. Features extracted from a multi scale Gaussian filter bank and some specific features that are readily calculated from the blob detector scheme have been used to detect nodules [15]. The local curvature of the image data were considered when viewed as a relief map [22]. An image subtraction approach was proposed in [16] where a test image and a comparison image were used. After applying several widely used pre-processing techniques, the two images were subtracted to obtain a resultant image which can be used to identify cancers with candidate nodules. This research, however, did not verify the utility of the study using many chest X-ray films. A heuristic approach using artificial intelligence tools have been used in [26] to detect cancer nodules.
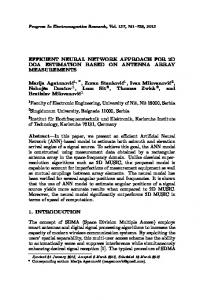
2. METHODOLOGY 2.1 Overview The proposed algorithm consists of two stages as depicted in Fig. 1. The first stage involves a pipeline of image processing routines to separate the lung from other structures of original chest X-rays and identifying the region that is suspected of being a nodule. At this stage, the system extracts 65x65 square areas considering the suspicious point as the center. Because it involves a pixel-based technique, all the pixels in the square region are considered as the inputs to the system. The intensity values of the pixels that fall within this region are extracted and are stored in a database which is used to train the system at the next stage. The database is then divided into several sub categories, and the data available in these sub categories will be used for the training as well as for testing the results. In the second stage, a neural network is trained based on two types of inputs: pixel-based inputs in which we consider the intensity levels of pixels within the suspected region and statistical feature-based inputs where we take into account first and second order statistical features.
International Journal of Image Processing (IJIP), Volume (5) : Issue (4) : 2011
426
K.A.G. Udeshani, R.G.N. Meegama & T.G.I. Fernando
FIGURE. 1: Stages of the proposed algorithm.
(a)
(b)
(c)
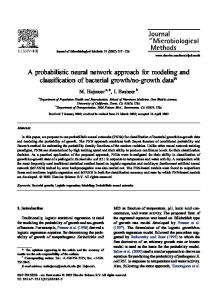
FIGURE. 2. Pre-processing of chest X-rays. (a) original image, (b) median filtering and (c) histogram equalization
2.2 Pre-processing As shown in Fig. 2, Median filtering is required to remove the effect of poor contrast due to glare, noise and effects caused by poor lighting conditions during image capture. A lowfrequency image was generated by replacing the pixel value with a median pixel value computed over a square area of 5x5 pixels centered at the pixel location. Sharpening and histogram equalization methods were used to enhance the contrast of the images.
International Journal of Image Processing (IJIP), Volume (5) : Issue (4) : 2011
427
K.A.G. Udeshani, R.G.N. Meegama & T.G.I. Fernando
(a)
(b)
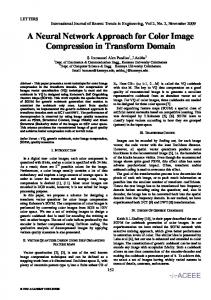
FIGURE. 3. Lung separation. (a) binary thresholded image and (b) suspicious region.
The image was then converted to binary image by using a thresholding technique. It computes a global threshold that can be used to convert an intensity image to a binary image. It utilizes Otsu's method, which chooses the threshold to minimize the intra-class variance of black and white pixels [17]. 2.3 Lung Region Segmentation Lung masks were prepared using active shape models that are available with the JSRT database [27]. These images can be used to segment the lung region while the user can identify the scope when selecting suspicious points [15]. These images consist of 154 lung nodules (100 malignant cases, 54 benign cases), and 93 non-nodules. The chest radiographs were digitized with a 0.175mm pixel size, a matrix size of 2048 x 2048 and a 12-bit grayscale level. The criteria for inclusion of radiographs in the database were: (1) absence of nodules larger than 35 mm, (2) absence of suspicious nodules that were not confirmed by CT examination, (3) no more than one nodule per patient, and (4) absence of nodules with margins that could not be confirmed by radiologists. The subtlety of the images contained in this database are grouped into five categories, namely, obvious, relatively obvious, subtle, very subtle and extremely subtle. These categories have been defined by expert radiologists which takes into account the size, contrast, and anatomical position of the lesions. We used connected components labeling to scan the binary thresholded image and group its pixels into components based on pixel connectivity, i.e.. all the pixels in a connected component share similar pixel intensity values and are in some way connected with each other as in Fig. 3 [17]. We define the roundness index of each connected component Ci as
Ci =
4πAi Ri2 th
where Ai is the area, Ri is the perimeter of the i component. This index, that gives a measure of irregularity of a connected component, is equal to 1 only for circles and less than 1 for any other shape. As such, if a connected component exhibits a roundness index closer to 1, the probability of it being a nodule can be considered to be high. After identifying a region that shows a high probability of being a nodule, we proceed to the second stage of our algorithm to train the neural network.
International Journal of Image Processing (IJIP), Volume (5) : Issue (4) : 2011
428
K.A.G. Udeshani, R.G.N. Meegama & T.G.I. Fernando
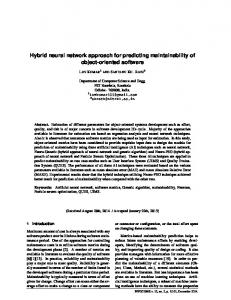
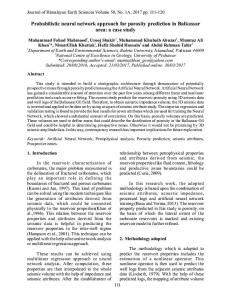
FIGURE. 4: Gray level co-occurrence matrix with different offsets. Shaded region at the middle indicates the pixel of interest.
Six features based on first order statistical textures measured with the gray level count of the image and four second order statistical texture features based on how often pairs of pixel with specific values and in a specified spatial relationship occur in an image were considered as inputs to a neural network [18, 19]. Average gray level, standard deviation, smoothness of intensity in a region, skewness (third moment) of the histogram, uniformity and entropy were the first order statistical texture features that we considered. First order statistical features th consider statistical moments of the region of interest where the n statistical moment is given by L −1
µ n = ∑ ( z i − m) n p ( z i ) i =0
where L is the possible number of intensity levels, m is the mean of intensity values, zi is the intensity value and p(zi) is the percentage of pixels with intensity value zi. Thus, skewness is rd considered to be the 3 statistical moment. The entropy e, which provides a measure of randomness in the pixels, is given as
L −1
e = −∑ p ( z i ) log 2 p ( z i ) i=0
The second order statistical texture features measure: (a) the local variations in the gray level co-occurrence matrix (GLCM), (b) correlation that measures the joint probability occurrence of the specified pixel pairs, (c) energy that provides the sum of squared elements in the GLCM and (d) homogeneity that measures the closeness of the distribution of elements in the GLCM to the GLCM diagonal. The GLCM, also known as the gray-level spatial dependence matrix, is a statistical method of examining texture and considers the spatial relationship between pixels. First, we create a GLCM with different offsets, expressed as an angle, as seen in see Fig. 4. To create this GLCM, we consider the above directions which specify the offset values with the common angles and the pixel distance. A 1-by-2 array of integers specifies the distance between the pixel of interest and its neighbor. Subsequently, we extract the statistical measures from these matrices as shown in Fig. 5 to obtain an average. A neural network with one hidden layer of 1000 neurons and an input layer of 10 neurons to accommodate the ten first and second order textures was used at the training stage [19, 21].
International Journal of Image Processing (IJIP), Volume (5) : Issue (4) : 2011
429
K.A.G. Udeshani, R.G.N. Meegama & T.G.I. Fernando
FIGURE. 5: Creating the GLCM matrix.
Recognition rate (%) Suspicious region Pixel-based
Feature-based
Nodule
96
88
Non-nodule
88
7
TABLE 1: Recognition rates for the two types of inputs to the neural network.
3. RESULTS AND DISCUSSION A 49x49 mask was selected within a suspicious region via an interactive user interface that we have developed for this purpose. After selecting the suspicious region during the first stage of our algorithm, we train the neural network until convergence is achieved. Two types of inputs were considered as inputs to the neural network. One type of inputs consists of intensity levels of pixels within the 49x49 mask. The other contains the ten statistical texture features within this mask as described in Section 2.3. This system uses a neural network with one hidden layer containing 1000 neurons, and an output layer with 1 neuron as in Fig. 7. For the pixel-based intensity input vectors, we used purelin and tansig transfer functions whereas two tansig transfer functions were used for the statistical feature-based inputs vectors. Backpropagation was created by generalizing the Widrow-Hoff learning rule to multiple-layer networks and non-linear differentiable transfer functions. Fig. 8 demonstrates the performance of the neural network for these two types of inputs considering the training approaches and the mean squared error (MSE). It was observed that during pixel-based technique, the R value was 1 and the MSE was 1.2682e009. The feature-based training resulted in an R value of 0.737 and an MSE of 0.2684. As seen in Table 1, we managed to achieve a high recognition rate for a nodule when the neural network was trained using pixel-based intensity values. Recognizing a non-nodule was 16% lower with statistical feature-based training of the neural network. We have used a pipeline of image processing routines at the first stage to identify regions suspected to be of lung nodules from the visible regions of chest X-rays. The second stage involves a neural network trained using backpropagation to verify whether the suspected region is a nodule or not. The reason for applying a neural network for the verification is due to detection of falsepositives during the image processing stage.
International Journal of Image Processing (IJIP), Volume (5) : Issue (4) : 2011
430
K.A.G. Udeshani, R.G.N. Meegama & T.G.I. Fernando
FIGURE. 6. Selecting a suspicious region on the image to determine statistical features or consider pixel intensity values.
FIGURE 7: Architecture of the neural network.
The selection of suspicious region involves a 49x49 square mask which include nodules with 13 mm diameter with a resolution of 96 pixels per inch. In the JSRT database, the size of a nodule varies between 8.9 mm and 29.1 mm with an average size of 17.4 mm. Because in medical imaging literature, the size of a lung nodule if detected at an initial stage, is considered to be between 5mm and 20 mm. We have used the masking method for lung region segmentation as the JSRT database provides all the required masks for the chest X-rays. As the final results depends on the subtlety of the images, only images with a low subtlety have been used. In contrast to other computer-aided lung cancer detection methodologies identified in research literature that are based on artificial neural networks, the proposed network uses 10 features as inputs to the system.
International Journal of Image Processing (IJIP), Volume (5) : Issue (4) : 2011
431
K.A.G. Udeshani, R.G.N. Meegama & T.G.I. Fernando
(a)
(b)
FIGURE 8: Training graph of the neural network: (a) pixel-based and (b) statistical feature-based inputs.
4. CONCLUSION In this research, we have successfully developed a solution for the detection of lung cancer nodules using image processing algorithms and neural networks. The system integrates a graphical user interface where the user is able to select a digital chest X-ray image as the input and the system will show suspected regions of the image that contain lung nodules. The detection of nodules is confounded by overlapping shadows of blood vessels and ribs. Although researchers have proposed several techniques to reduce the effect of ribs in chest X-rays to eliminate false-positives, it is prudent to consider hidden regions too, such as behind the heart, spine and the diaphragm, and apply relevant filtering techniques to suppress these anatomical structures.
5. REFERENCES [1] P.R. Snoeren, G.J.S. Litjens, B.V. Ginneken and N. Karssemeijer, Training a computer aided detection system with simulated lung nodules in chest radiographs, Proc. 3rd International Workshop on Pulmonary Image Analysis, Beijing, 2010. [2] Z.H. Zhou, Y. Jiang, Y.B. Yang and S.F. Chen, Lung cancer cell identification based on artificial neural network ensembles, Artificial Intelligence in Medicine, vol. 24, N 1, pp. 2536, 2002. [3] G.S. Cox, F.J. Hoare and G. de Jager, Experiments in lung cancer nodule detection using texture analysis and neural network classifiers, Third South African Workshop on Pattern Recognition, 1992. [4] J.W. Lee, H.W. Lee, J.H. Lee, I.T. Kang and G.K. Lee, A study on lung nodule detection using neural networks, Proc. IEEE Region 10 Conference, pp. 1150 - 1153, 1999. [5] G. Coppini, S. Diciotti, M. Falchini, N. Villari and G. Valli, Neural networks for computer aided diagnosis: detection of lung nodules in chest radiograms, IEEE Trans. on Information Technology in Biomedicine, vol. 4, pp. 344-357, 2003. [6] M.G. Penedo, M.J. Carreira, A. Mosquera and D. Cabello, Computer aided diagnosis: A neural network based approach to lung nodule detection, IEEE Trans. on Medical Imaging, vol. 17, N 6. pp. 872-880, 1998. [7] M.N. Gurcan, B. Sahiner, N. Petrick, H.P. Chan, E.A. Kazerooni, P.N. Cascade and L. Hadjiiski, Lung nodule detection on thoracic computed tomography images: Preliminary evaluation of a computer-aided diagnosis system, Medical Physics, vol. 29, N 11, pp. 2552, 2002.
International Journal of Image Processing (IJIP), Volume (5) : Issue (4) : 2011
432
K.A.G. Udeshani, R.G.N. Meegama & T.G.I. Fernando
[8] Y. Lee, T. Hara, H. Fujita, S. Itoh and T. Ishigaki, Nodule detection on chest helical CT scans by using a genetic algorithm, Proc. Intelligent Information Systems, pp. 67 - 70, 1997. [9] T. Rasheed, B. Ahmad, M. A. U. Khan, M. Bettayeb, S. Lee and T. S. Kim, Rib suppression in frontal chest radiographs: A blind source separation approach, Proc. Signal Processing and its Applications, pp. 1 - 4, 2007. [10] K. Le, Automated detection of early lung cancer and tuberculosis based on X-ray image analysis, Proc. WSEAS International Conference on Signal, Speech and Image Processing, pp. 1-6, 2006. [11] K. Suzuki, J. Shiraishi, H. Abe, H. MacMahon and K. Doi, False-positive reduction in computer-aided diagnostic scheme for detecting nodules in chest radiographs by means of massive training artificial neural network, Academic Radiology, vol. 12, N 2, pp. 191201, 2003. [12] M. Park, J. S. Jin and L. S. Wilson, Detection of abnormal texture in chest X-rays with reduction of ribs, Proc. Pan-Sydney area workshop on visual information processing, 2004. [13] L. Zhang and X. Gao, Research on translation invariant wavelet transform for classification in mammograms, Proc. 3rd international conference on natural computation, 2007. [14] P. Campadelli, E. Casiraghi and D. Artioli, A fully automated method for lung nodule detection from postero-anterior chest radiographs, IEEE Trans. on Medical Imaging, vol. 25, N 12, pp. 1588-1602, 2006. [15] A.M.R. Schilham, B.V. Ginneken and M. Loog, A computer-aided diagnosis system for detection of lung nodules in chest radiographs with an evaluation on a public database, Medical Image Analysis, vol. 10, N 2, pp. 247-258, 2006. [16] R. Hayashibe, N. Asano, H. Hirohata, K. Okumura, S. Kondo, S. Handa, M. Takizawa, S. Sone and S. Oshita, An automatic lung cancer detection from X-ray images obtained through yearly serial mass survey, Proc. International conference on image processing, pp. 343 - 346, 1996. [17] R. C. Gonzalez , R.E. Woods and S. L. Eddins. Digital Image Processing, AddisonWesley, 2002. [18] S. A. Patil and V. R. Udupi, Chest X-rays features extraction for lung cancer classification, Journal of Scientific and Industrial Research, vol. 69, pp. 271-277, 2010. [19] J. Wei, Y. Hagihara, A. Shimizu and H. Kobatake, Optimal image feature set for detecting lung nodules on chest X-ray images, Proc. Int. Workshop on Computer-Aided Diagnosis, 2002. [20] O. Ludwig and U. Nunes, Novel maximum- margin training algorithms for supervised neural networks, IEEE Trans. on Neural Networks, vol. 21, N 6, pp. 972-983, 2010. [21] R. N. Strickland, Tumor detection in non-stationary backgrounds, IEEE Trans. on Medical Imaging, vol. 13, pp. 491-499, 1994. [22] S.B. Lo, S.L. Lou, J.S. Lin, M.T. Freedman and S.K. Mun, Artificial convolution neural network techniques and applications for lung nodule detection, IEEE Trans. on Medical Imaging, vol. 14, pp. 711-718, 1995.
International Journal of Image Processing (IJIP), Volume (5) : Issue (4) : 2011
433
K.A.G. Udeshani, R.G.N. Meegama & T.G.I. Fernando
[23] J.S. Lin, S.B. Lo, A. Hasegawa, M.T. Freedman and S.K. Mun, Reduction of false positives in lung nodule detection using a two-level neural classification, IEEE Trans. on Medical Imaging, vol. 15, pp. 206-216, 1996. [24] Y.S.P. Chiou, Y.M.F. Lure and P.A. Ligomenides, Neural networks image analysis and classification in hybrid lung nodule detection (HLND) system, IEEE Workshop on Neural Networks for Signal Processing, pp. 517-526, 1993. [25] D.H. Ballard and J. Sklansky, A ladder-structured decision tree for recognizing tumors in chest radiographs, IEEE Trans. on Computers, vol. C-25, pp. 503-513, 1976. [26] B.V. Ginneken, B.M.T.H. Romeny and M.A. Viergever, Computer Aided Diagnosis in chest radiography: A survey, IEEE Trans. on Medical Imaging, vol. 20, pp. 1228-1241, 2001. [27] Japanese Society of Radiological Technology, http://www.jsrt.or.jp
International Journal of Image Processing (IJIP), Volume (5) : Issue (4) : 2011
434