1
Neural Network to Failure Classification in Robotic Systems José Jair Alves Mendes Junior, Marcelo Bissi Pires, Mário Elias Marinho Vieira, Sérgio Okida and Sergio Luiz Stevan Jr. ____________________________________________________________________________
Abstract— A robotic system is a reconfigurable element, and in its programming, an algorithm can be implemented in order to detect and classify failures. This is an important step to ensure that errors in actions do not cause damage or bring risks. Considering this, a Neural Network Multi Layer Perceptron (MLP) was used, in order to classify a set of failures in robot actuators, present in a database. This purpose is to analyze if robotic failures could be classified by MLP. The raw data are divided in a temporal progression manner and torque in x, y and z axes. In total, five MLP neural networks were implemented for each type of failure classification, using two different topologies. The number of neurons in the hidden layer is in accord with the criteria of Kolmogorov and Weka, being the latter the best topology for such application. In comparison to an algorithm (SKIL) using the same set of data, the MLP obtained the best performance in any topology of classification, with hit rates in 80 to 90%. Index Terms— Failures; Robotic; Neural Network.
I.
INTRODUCTION
R
obots replace human jobs and are used in hazardous environments, in which access may be difficult and in places where are present repetitive tasks. They bring efficiency regarding time and costs while also minimizing risky situations. However, as in any system, every robot is susceptible to failures and errors while executing a task. Furthermore, in systems containing risk factors, – as in robotic systems – non-detected failures or faults may have catastrophic consequences, causing financial losses, environmental damage, or even casualties. A robotic manipulator is a mechanical structure composed of links connected to each other through joints, which are free to move according to one or more degrees of freedom [1,3]. When its structures and movements have anthropomorphic behavior, they are known as robot manipulator, which carry the same ______________________________________________________________ José Jair Alves Mendes Junior, Marcelo Bissi Pires, Mário Elias Marinho Vieira, Sérgio Okida and Sergio Luiz Stevan Jr. are with Department of Electronic to Federal University of Technology – Paraná, Av. Monteiro Lobato, s/n, km4 - 84016-210, Ponta Grossa/PR, Brazil. (e-mail:
[email protected];
[email protected];
[email protected];
[email protected];
[email protected])
DOI:
functionalities as a human arm, controlling position and orientation [4-5]. A notable characteristic of a robotic system is the capability to reconfigure the control system (usually executed by a microcontroller, microprocessor or other type of intelligent system) [4]. Therefore, considering that a robotic system is reconfigurable, it is possible to set failure tolerance parameters, which is a developer powerful tool [2]. Regarding recognition and diagnosis of a failure, mathematic models are used to reproduce the dynamic behavior of a faultless system. To identify a failure, it is analyzed the difference between a predicted output and the actual one [2]. In recent years, many types of research related to neural networks have been applied in a diversity of problems in areas such as pattern recognition, signal processing, image processing, process identification, and nonlinear system mapping [2,6]. Using these very same functions, robotic systems may have a neural network as a way to identify and classify failures. They lead to faster diagnostics and treatment [2,7]. This work aims to use an artificial neural network to assess if it is possible to classify failures in robots when a movement is performed. This is accomplished by evaluating both parameters of torque and force, based on a temporal learning of these data. The neural network was chosen as a classification system due to its easiness to execute, fast response once trained, high generalization, and learning rate to solve problems, especially nonlinear ones. A database containing movements of a given robot in situations of failure (available in [8], data already classified) was used for training and testing. This proposal is based on a Multi-Layer Perceptron (MLP) neural network to recognize classes of errors and to compare results gathered by different topologies. These topologies are based on the criteria of both Weka and Kolmogorov, bringing robustness and reliability to the system. Regarding the network, the unprocessed (raw) data are used. The result was also compared to a classification of these data in an intelligent structure known as SKIL [9]. Once a failure is ISSN: 2318-4531
2 identified, the robot is capable of performing a corrective action whilst the diagnosis is a pattern already classified. II.
DATA
The application data represent a set of five failure classes described in the work of Lopes and Caraminha-Matos (1998) [9]. These data were taken by a case study from a “pick and place” operation, in other words, a task in which the robot grabs a piece (grasp operation), move it to the desired position, and drop it in a predetermined place (ungrasp operation). In grasp operation, 88 samples were acquired, 47 samples in movement operation, and 117 samples in ungrasp operation. Each sample is a set of 90 data, organized in a matrix of 6 columns and 15 rows. The columns represent the data obtained of the robot, near the last degree of freedom, being respectively: the force in x-axis (Fx), force in y-axis (Fy), force in z-axis (Fz), torque in x-axis (Tx), torque in y-axis (Ty), and torque in z (Tz). The 15 rows describe the data time evolution, with an interval of 315 ms between each. The failure detection mechanism needs to consider that the movement execution requires a time to perform, which delays the analysis; therefore, time progression is used to identify the classes [9]. The samples were divided into five classes (failure class) to aid and identify the problems of the system to understand and learn; which are [8-9]: LP1: Failures in approaching to the grasp position; LP2: Failures in displacement of a part; LP3: Position of a part after a displacement failure; LP4: Failures in approaching to ungrasp position and; LP5: Failures in motion with a part. Each one of these main classes is divided into other conditions, according to Table 1, that also presents the quantity of data in each class. TABLE I. Failure Class
LP1
LP2
LP3
LP4
LP5
DOI:
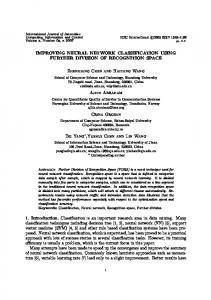
The data arrangement is presented in Fig. 1, containing a normal signal (a) and an obstruction signal (b). It is notable the difference between them. Whilst a signal considered normal has a smooth action in the three-axis of force and torque, the signal that represents the failure has expressive changes among the dimensions.
(a)
(a)
Samples Samples
(b) (b)
PROBLEM CLASSES, CONDITIONS AND THEIR DISTRIBUTION Conditions
Distribution (%)
Normal Collision Frontal Collision Obstruction Normal Front Collision Back Collision Collision to the right Collision to the left Ok Slightly moved Modev Lost Normal Collision Obstruction Normal Bottom Collision Bottom Obstruction Collision in Part Collision in Tool
24 19 18 39 43 13 15 11 19 43 19 32 6 21 62 18 27 16 13 29 16
Quantity of Data
88
47
Samples Samples Figure 1. The signal example of the database representing a) a normal signal and b) obstruction of a part.
47
III. 117
164
MULTI-LAYER PERCEPTRON
The MLP (Fig.2) is a one-layer Perceptron variant that contains at least one neuron hidden layer in addition to the input layer and output layer. These networks have high applicability, such as information processing, function approximation, temporal series prediction, and pattern recognition/classification which is intended by this work [1011] This architecture is feedforward, in other words, the information propagates in only one direction. The training is ISSN: 2318-4531
3 performed in a supervised way through the backpropagation algorithm, which consists of two steps. In the first step (forward), the signal sample is inserted in the input and propagated among the hidden layer to the output. Depending on the output produced and the desired value, it obtains the error. The synaptic weights are adjusted by the error value, from output layer to the input layer (this is the backward step) [10]. These steps are repeated successively until the error is considered tolerable. To the MLP, the activation function used in the output of each neuron must be non-linear and differentiable at any point [12]. The logistic and hyperbolic tangent functions are used because this criteria. [10,12]. Five MLP neural networks were implemented for each failure classification (LP1 to LP5). This action was adopted taking into account that the data validated by the classification system in [9] were performed on each class. Furthermore, in a real field application, the time of a system using only one network could present a higher delay than when working in parallel due to the number of math operations involved in the results of the network.
of neurons of the hidden layer is defined by the following expression (2)
n1 =
n + nc 2
(2)
Where nc is the quantity of conditions to be separated. Among the hidden layer and the output layer, there is a matrix (W2) of synaptic weight connections. The number of neurons in the output layer n2 matches the quantity of failure classes, from LP1 to LP5, for each network. For example, in the data obtained in LP1, the output vector consists of four terms (YA, YB, YC, YD). Table 2 presents the output resultant for each pattern. TABLE II. MODEL OF THE DESIRED OUTPUT FOR EACH CLASS OF LP1
Output Conditions Normal Collision Obstruction Frontal Collision
YA
YB
YC
YD
1 0 0 0
0 1 0 0
0 0 1 0
0 0 0 1
Moreover, the Table 3 presents a quantity of outputs and hidden layers among each one of the groups from LP1 to LP5. By the Kolmogorov’s method, all the networks have all 181 neurons in the hidden layer. On the other hand, for the criteria used in Weka, the quantity of neurons are presented in Table 3. TABLE III. QUANTITY OF NEURONS IN EACH OUTPUT LAYER AND HIDDEN LAYER IN WEKA ORIENTATION.
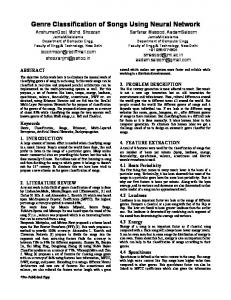
LP1 LP2 LP3 LP4 LP5 Figure 2.
MLP used topology model.
A. Implementation Characteristics The MLP topology, presented in Fig. 2, has one input layer, one hidden layer, and one output layer. Each sample has 90 data; and adding the activation threshold of each neuron in the hidden layer, the input then consists of 91 terms. In other words, the set of 90 data, which were in a matrix of 15 rows (temporal displacement) and 6 columns (forces and torques), was distributed in a single vector. The synaptic weights matrix W1 represents the synapses among each input and each hidden layer neurons. This layer has n1 number of neurons, which was defined by two criteria. The first one, Kolmogorov’s method [10], is determined by (1)
n1 = 2n +1
(1)
Where n1 is the number of neurons in the hidden layer and n is the number of network inputs. The second method tested was the one implemented in Weka’s platform (Waikato environment for knowledge analysis) [10], in which the number DOI:
Y2 4 5 4 3 5
n1(Weka) 47 48 47 47 48
Mathematically, the behavior of the MLP could be evaluated in forward step by the equation (3), based on [10]. The network output (Y2) is the result of the operations among the input vector X, the synaptic weight matrixes W1 and W2 (which are transposed), and the activation functions (g1 and g2).
Y2 = g 2 (g1 ( X × W1T ) W2T )
(3)
All parameters are found in Fig 2. It is important to notice that I1 is the result of the operation between X and W1; Y1 is the output vector of hidden layer neurons; and I2 is the resultant between Y1 and the synaptic weights W2. In I2 , the term -1 is given to each neuron as the activation threshold of the output layer. The activation function g1 matches the action of the hyperbolic tangent. This function was chosen because the input data has positive and negative values, which compose this function domain. The hyperbolic tangent is given by (4)
g1 = tanh(b a)
(4)
ISSN: 2318-4531
4 Where tanh is the trigonometrical function of the hyperbolic tangent, b is the function inflection coefficient and a is the input vector. On the other side, the logistic function is given by (5)
g2 =
1 1 exp(b a)
(5)
The data were separated to system validation and were forwarded to each network. The Table 4 presents the quantity of data divided into training and validation. The recommendation in [10] was used, where 60 to 90% of data is used for training and 10 to 40% is used for validation, based on the number of conditions in each class. TABLE IV.
Where exp is the exponential function. For g2 was chosen a logistic function as activation function because the output value is in the range from 0 to 1. Back to training step, in backward, the weight adjustment is done from output to input layer. The used method adopts the gradient to minimize the error between the actual and the desired output, elicited in [10]. The gradient in W2 is calculated by (6)
δ 2 = (d - Y2 )× g'(I 2 )
W2 = W2 + η× δ2 × Y2
(7)
Where η is the learning rate. The next step is the adjustment of the weights W1. Thus, the hidden layer gradient must be calculated by (8)
δ1 = (δ2 - W2 )×g'(I1 )
(8)
Where δ1 is the local gradient of hidden layer. Therefore, the adjustment of synaptic weights W1 is given by (9)
W1 = W1 + η× δ1 × X
Data Classes LP1 LP2 LP3 LP4 LP5
(6)
Where δ2 is the local gradient value in regard to output layer, d is the vector/matrix of desired output, and g’ is the derivative of the activation function. Hence, it is noticeable that the activation function must be entirely differentiable. With the gradient, the adjustment of the weights of W2 can be obtained by (7)
(9)
QUANTITY OF DATA FOR TRAINING AND VALIDATION OF MLP
Training
Validation
72 37 37 93 134
16 10 10 24 30
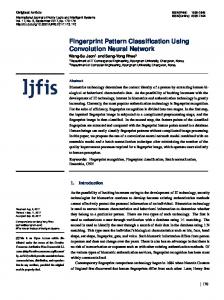
IV. MLP IMPLEMENTATION The MLP code was implemented in MATLAB® software. The code was divided into two main stages: training and validation. The training stage is divided in initial settings (such as data loading, the creation of variable and constants) and the training in itself. It is in the training stage that both forward and backward steps are done. As a stop criterion, it was established the precision of mean square error and the quantity of epoch. Thus, the precision and the mean square error were plotted according to the quantity of epochs, analyzing the evolution of error correction. The Fig. 3 presents a case of precision and mean square error obtained in a training. The curve behaves as a decreasing exponential because the error always tends to the smallest value possible. In the validation stage, the adjusted weights are used with the data separated for testing. As the end of training stage, the greatest value was identified and defined as 1 to facilitate the approximation. Among the setting parameters, the learning rate was determined as 0.1, the precision as 1e-9, and the inflection value of hyperbolic tangent and logistic function as 0.5. These parameters were chosen after a few tests performed on the network and analysis of convergence of weight values.
The stop criteria and error are based on E M: the average of the mean squared error. On the other hand, it can be obtained by (10)
EM =
1 1 2 (d - Y2 ) p 2
(10)
Where p is the total number of samples of error. When the difference between the error in two consecutive iterations of training step is small, the expression (11) is used to obtain the precision (ε)
E Actual - E Previous ε M M
(11) Figure 3.
a) Precision e b) Mean Squared Error obtained in a training stage.
Where EMActual is the mean squared error of the actual iteration whilst EMPrevious is the mean squared error of the previous iteration. DOI:
ISSN: 2318-4531
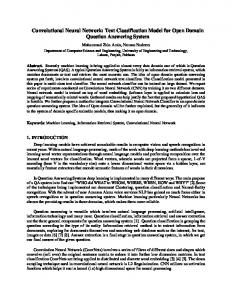
5 V. RESULTS Each network with the suggested topologies was submitted to 30 trainings. This number was chosen empirically, proving to be a reasonable quantity to assess the rate of success in each topology. After each training and validation, their synaptic weights and hit rates were gathered, in which Figure 4 presents the results obtained in each topology during the training. It was presented the minimum value, the median value, and the maximum value, where K represents the Kolmogorov’s method, whilst W, Weka. The majority of training obtained more of 80% of data classification. However, the median values held the pattern of 85 to 95 %. Kolmogorov was the topology that obtained more hits; nevertheless, with exception of LP5, the topology that obtained less standard deviation among the samples was Weka. On this subject, Weka topology presents a slighter gain.
Kolmogorov’s method. It highlights that the differences occurred in small margins.
Figure 6. Results of each topology in all data classification pattern (training and validation).
Comparing to the study presented in [9]; there were improvements in the method regarding data classification. Taking only the mean values, presented in Figure 6, and the classification obtained in data without any processing, it can be analyzed in Table 5 the performance of MLP networks (as Kolmogorov’s and as Weka’s). TABLE V. COMPARISON OF THE HIT PERCENTAGES AMONG TOOL SKIL [9], AND THE MLP NEURAL NETWORK OF NUMBER OF NEURONS OF HIDDEN LAYER WITH ORIENTATIONS KOLMOGOROV AND WEKA.
Topology Figure 4.
Results of each topology in training data classification.
The Figure 5 presents the quantity of hits in network validation. In LP1, LP3 and LP5 classifications, there were equal percentages of maximum hits, and Weka’s topology obtained the lowest deviation and greatest median values. In LP2, Weka has the largest amplitude and lowest deviation, whilst the situation in LP4 favors the topology by Kolmogorov in a larger quantity of hits, but in lower deviation. Thus, Weka presents the better result for each data class.
Figure 5.
Results of each topology in validation data classification.
Lastly, the average of all data is presented in Figure 6, containing the classification percentage of all data, from training to validation. Regarding the maximum quantity of hits, both networks have the same behavior, however, again, regarding the lowest deviation and the highest mean, Weka has the best performance. It stands out that the Weka’s criterion for this application obtained the better advantages than
DOI:
Class
SKIL[9] (%)
MLP(K) (%)
MLP(W) (%)
LP1 LP2 LP3 LP4 LP5
78 45 49 65 61
84,161 82,757 78,486 85,777 80,288
90,45 78,595 79,405 80,288 82,41
VI.
DISCUSSION
Looking at all data and Figures 4, 5, and 6, it is possible to notice that Weka’s orientation has the best performance. Besides having a numerical result, there is also both construction and execution time aspects. A Weka matrix has fewer values than a Kolmogorov matrix; that is because it has less number of neurons. Comparing a weight matrix of 91x181 to a 91x48, as in LP1, there is a reduction of more than ¼ of the matrix size, reducing the time spent in processing and calculating. There is an average of 20 seconds to train, but it goes down to the range of 6-10 seconds in Weka’s orientation. Another important aspect disclosed in [9] are the results shown using data processing, increasing classification’s performance. In order to do a comparison and to create the network, only raw data (unprocessed) were used. Moreover, the data was normalized using Tales’ standards, vectors standards, and Euclidian distance. However, best results were achieved using the original form and values. That is because, in normalizations, there are data with high discrepancy between maximum and minimum values. Most data are located in an intermediate domain, not too high and not too low. This is the reason why data was stuck in a single value with minimal changes on the first four decimal places. Final Considerations ISSN: 2318-4531
6 Lastly, it is possible to confirm the behavior of the network by the results obtained. Even as a preliminary study, this work has already shown good results. This way, it is proven that errors from robot manipulators can be classified by means of temporal progression of force and torque in a neural network. The MLP topology, where the number of neurons on the hide layer is suggested by Weka, managed to stand out in every stage. However, the greatest analysis is that the data can be separable and classifiable, which was a relevant question raised when creating the system. Future works intend to use other types of networks topologies, such as Basel Radial, Kohonen’s self-organizing maps and Extreme Learning Machine, in order to compare results aiming for better classifications.
[4]
ACKNOWLEDGMENT
[10]
The authors would like to thank the Brazilian research funding agencies CAPES and CNPq. The first for the scholarships granted to the post-graduate students participating in the study, and the last one for Technological Development Scholarship No. 312104/2015-4. REFERENCES M. L. Visinsky, “Fault Detection and Fault Tolerance Methods for Robotics”. Thesis. Rice University, 2006, pp. 103. [2] M. S. Khireddine, A. Boutarfa and N. Slimane, “Dual neural classification for robust fault diagnosis in robotic manipulators”, 9th International on Mechatronics and its applications, Amman, Jordan, April 2013. [3] J. Craig and K. Knight, Introduction to robotics: mechanics and control, 2nd ed.. Massachusetts: Addison-Wesley, xiii, 1989, pp. 450.
[5] [6]
[7]
[8]
[9]
[11]
[12]
S. B. Nikku, Introdução à robótica: análise, controle, aplicações, 2nd ed.. Rio de Janeiro: LTC, xvii, 2013, pp. 382. F. Pazos, Automação de sistemas & robótica. Rio de Janeiro: Axcel, 2002, pp. 377. T. Zouari, K. Laabidi and M. Ksouri, “Multimodel Neural Networks Identification and Failure Detection of Nonlinear Systems”. International Journal of Sciences and Techniques of Automatic control & computer engineering. Vol 2, Nº1, pp. 500515, July 2008. I. Eski, S. Erkaya, S. Savas and S. Yildirim, “Fault detection on robot manipulators using artificial neural networks”. In: Robotics and Computer-Integrated Manufacturing. 2010. UCS database. “Machine Learning for Robotic Failure”. 2015. Access in 20th Sep. 2015. Available in https://archive.ics.uci.edu/ml/machine-learningdatabases/robotfailure-mld/robotfailure.data.html. L. S. Lopes and L. M. Camarinha-Matos, Feature Transformation Strategies for a Robot Learning Problems. “Feature Extraction, Construction and Selection”. Springer US, 1998, pp. 375-391. I. N. da Silva, D. H. Spatti and R. A. Flauzino, “Redes Neurais Artificiais Para Engenharia e ciências aplicadas.” 1st ed. São Paulo: Artliber, 2010, p. 399. A. S. Mustf and Y. S. K. Swamy, "Web Service Classification Using Multi-Layer Perceptron Optimized with Tabu Search" IEEE International Advance Computing Conference, Banglore, pp. 290-294, June 2015. S. Haykin, Redes neurais: princípios e prática. 2nd ed.. Porto Alegre: Bookman, 2001, pp. 900.
[1]
DOI:
© 2016 by the authors. Submitted for possible open access publication under the terms and conditions of the Creative Commons Attribution (CC-BY) license (http://creativecommons.org/licenses/by/4.0/).
ISSN: 2318-4531