equal to 100 and a coefficient of variation of 15 %. One auxiliary file was obtained through a process known as data expansion for the purpose of training the ...
494
Scientia Agricola http://dx.doi.org/10.1590/0103-9016-2014-0057
Neural networks for predicting breeding values and genetic gains Gabi Nunes Silva1*, Rafael Simões Tomaz2, Isabela de Castro Sant'Anna2, Moysés Nascimento1, Leonardo Lopes Bhering2, Cosme Damião Cruz1,2
1
ABSTRACT: Analysis using Artificial Neural Networks has been described as an approach in the
Biometrics, Av. P H Rolfs, s/n, University Campus – 36570-
decision-making process that, although incipient, has been reported as presenting high potential
000 – Viçosa, MG – Brazil.
for use in animal and plant breeding. In this study, we introduce the procedure of using the
Federal University of Viçosa – Dept. of Applied Statistics and
2
expanded data set for training the network. Wealso proposed using statistical parameters to
Bioinformatics Lab. (BIOAGRO).
estimate the breeding value of genotypes in simulated scenarios, in addition to the mean pheno-
*Corresponding author
typic value in a feed-forward back propagation multilayer perceptron network. After evaluating
Federal University of Viçosa – Dept. of General Biology,
artificial neural network configurations, our results showed its superiority to estimates based on linear models, as well as its applicability in the genetic value prediction process. The results
Edited by: Thomas Kumke
further indicated the good generalization performance of the neural network model in several Received February 13, 2014
additional validation experiments.
Accepted April 16, 2014
Keywords: genetic value, statistics, simulation, artificial intelligence, training strategy
Introduction Genetic breeding is a science aimed at increasing the frequency of alleles and/or obtaining favorable genotypic combinations, in order to increase the production efficiency of an individual or population. The possibility of predicting the gain obtained through traditional selection methods is one of the major contributions to quantitative genetics and biometrics for breeding, since this enables more effective guidance for the breeding program so as to facilitate predicting the success of the selective scheme adopted (Cruz et al., 2012). With regard to the statistical genetic methods for selection, some methodology categories are noteworthy, and have been widely used as follows: selection index (Verardi et al., 2014), the combined selection method (Ribeiro et al., 2013; Verardi et al., 2014) and the REMLBLUP method (Ferreira et al., 2012). Nonetheless, a new paradigm can be employed in genetic breeding for selection purposes that does not involve stochastic modeling, but instead the principles of learning in a computational intelligence approach. In this context, approaches based on Artificial Neural Networks (ANN) have been described as an additional tool in the decision making process in various fields of science with great potential in animal and plant genetics (Gianola et al., 2011; Nascimento et al., 2013; Ventura et al., 2012). Still, it is usual to train the ANN with a data subset, such as historical information of the genotypes, but this presents the disadvantage that they are not necessarily contemporaries of the experiment under evaluation. An alternative is to use a virtual data set, provided by statistical techniques able to preserve some features of the original experiment such as the mean, variances and covariances. This is called the expanded data set, and, as such, is a concept to be presented and discussed. We aimed to evaluate the ability of the ANN as an alternative method for statistical studies and the predic-
Sci. Agric. v.71, n.6, p.494-498, November/December 2014
tion of breeding values, using simulated data and other relevant statistics as well as the mean phenotypic value. A simulation procedure was used to provide information on the true genetic values for comparison of the ANN technique which may, in practical situations, be suitably replaced by historical values. We investigated the performance of several ANN architectures for prediction of breeding values, and introduced the process of expanded data sets to be used in the ANN training process for subsequent prediction.
Materials and Methods Data simulation The neural networks were fitted to data in the training set, with connection strengths and biases modified iteratively. Oftentimes a data subset, such as the historical information of genotypes, is used in such a procedure. However, some alternatives to this process have been presented. One of these is to use the validation data itself for the training process, so that the predictive ability of the network is gauged in parallel with this since they are similar in structure Two scenarios of simulated characteristics were considered, with heritabilities of 40 and 70 %. The experiments consisted of a randomized block design with 100 genotypes and six blocks, assuming mean values equal to 100 and a coefficient of variation of 15 %. One auxiliary file was obtained through a process known as data expansion for the purpose of training the network, which preserves the structure of means and covariance matrix of the test file. This expansion process was carried out as described below. The simulated values were considered a random variable Y ~ N (φ, Σ). The data was transformed into a random variable Z ~ N (φ, Ι) by means of the linear transformation Z = F'Y, where F was obtained by means of the spectral decomposition process of Σ, such that Σ–1 = FF'. The amplification process consists of simulating
495
Silva et al.
new values of Y, considering Y ~ N (φ, (F')–1Z). A file of amplified data, consisting of 5000 genotypes, was considered for training of the ANN. For simulating a data set, or replicating a known data structure or even the expansion of a data set based on the structure of the other, it is required to have a data set with known distribution, and in principle a mean equal to zero and variance equal to V. In order for such requirements to be obeyed, the usual procedure is to resort to the Box Muller transform. For data simulation, the variables considered are: and ; in which RND is a random number. To ensure that the data set X in fact has zero covariance, we recommend using the principal components technique. This technique is very useful for breeding programs because it permits the simplification of data sets to a limited set of components, which present the properties to retain as much of the originally available variation and remain mutually independent. The random term Y~ N (φ, Σ) is that which we wish to transport into a random variable Z ~ N (φ, Ι). By means of the spectral decomposition process, we have Σ–1 = FF'–1. Thus, (Σ–1)–1 = (FF')–1 = (F')–1 F–1 = Σ. If Z = F'Y, then E(Z) =E(F'Y) = F'E(Y) = F'φ = φ and V(Z) = F'V(Y)F = F'Σ F = F´[(F´)–1F–1] F= I. Considering that Z~N(φ, I). If Z = F'Y, then Y = (F')–1Z. Therefore, V(Y) = V((F')–1Z) = (F')–1V(Z)[(F)–1]' = (F')–1I F–1 = Σ . The data expansion process was performed by means of the integration module in the computer application GENES. The expansion process was performed using statistical methods which allowed the preservation of traits such as the mean, variance and covariance among information of the genotypes which were considered pairs of blocks from the original data. Artificial neural network construction and evaluation Feed-forward back propagation multilayer perceptron networks were created by the Matlab software using the integration module in the computer application GENES. The training algorithm trainlm was used, along with network architecture consisting of three hidden layers, activation functions tansig or logsig, the number of neurons varying from one to seven and the maximum number of iterations (or epochs) equal to 2000. All combinations of neuron numbers and activation functions in the hidden layers were verified. For training and validation of the ANN the desired outputs of the true genotype values were used and inputs presented the following information: x1: mean phenotypic value; x2: maximum value of each genotype in b blocks; x3: minimum value of each genotype in b blocks; x4: standard deviation of each genotype; x5: coefficient of variation for each genotype; x6: sum of ranks obtained in b blocks for each of the genotypes; x7: statistic value Pi, adapted from Lin and Binns (1988) for studies of adaptability and stability, given by ,
Artificial intelligence for prediction
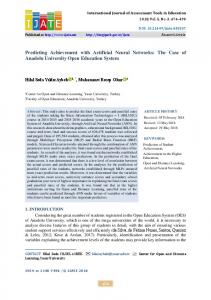
where Xij is the phenotypic value of the i-thgenotype in the j-th block; Mj is the maximum response observed in all genotypes in block j; and b us the number of blocks in the experiment; x8: discrete values, coded 1 to 6, established from transformation of the mean phenotypic value considering its variation around the average within the limits, lower and upper, considered as one, two or three standard deviations. The architecture of the ANN is exemplified in Figure 1. To verify the performance of the ANN, replicates of the test file were considered as validation files, also obtained by means of data simulation generated with the same number of blocks and genotypes, preserving the means and structure of variance and covariance between each pair of blocks. Thus, 120 validation files were used, considered as replicates of the simulated experiments. Considered as a criterion of optimization of the architecture of the ANN was the number of times in which reliability of the genotypic prediction by the network was higher than the mean phenotypic value. Reliability was given by the square of correlation between the response of the ANN and the true genotypic value compared with the square of the correlation between the mean phenotypic and true phenotypic values, which expresses the heritability of the trait, applied in all combinations of neurons, hidden layers and activation functions used. Thus, a direct comparison was made between the measure of network reliability and heritability of the trait, which is the criterion conventionally used for predicting genetic value (maximum likelihood estimator – MLE), genetic gain, identification of selective units and choosing the selection strategies.
Results and Discussion To demonstrate that data expansion did not alter the structure of the original data set, Table 1 presents
Figure 1 – Architecture of the ANN. Inputs (x1) to (x8) in the Input layer are related to the statistics estimated from data and considered as inputs. Three hidden layers consisting of ni nodes (i = 1, 2, … , 7) were considered, with the activation functions tansig or logsig. All combinations were explored. The ANN returns the predicted breeding value in the output layer.
Sci. Agric. v.71, n.6, p.494-498, November/December 2014
496
Silva et al.
Artificial intelligence for prediction
estimates of genetic parameters estimated for sets of simulated and amplified data sets, for heritability values of 40 and 70 % m = 100, CVe = 15 %. The expansion process was effective in replicating genetic information from the original dataset, since important features such as genotypic variance, coefficient of genetic variation and heritability of the trait were preserved. In conventional statistical procedures used in the genetic gain prediction process, only mean genotypic values are considered assuming the existence of their correlation with the actual genetic values of the genotypes, denoted by heritability of the trait. The mean is the main parameter needed to judge the superiority between genotypes, and in cases of low heritability, the selection process has lower reliability. However, a more detailed analysis may be performed by taking into consideration not only the mean genotype, but also other relevant statistics and those of high practical aspect, although these make the decision-making process more complex for the data analyst. Thus, two genotypes may have similar averages but different behaviors in terms of variation, ranking, maximum and minimum values and others. In the biometrics approach this additional information is neglected, but when utilizing the computational intelligence approach such information is indispensable and make up relevant inputs to be considered in the training process of the ANN.
When considering the overall values of diverse statistics of each genotype obtained in a determined assay, it is observed that more reliable criteria are obtained for predicting genotypic superiority than be based solely on the mean value obtained for genotype assays whose genotypic variability and experimental precision can vary tremendously. To verify how the amplification process affected the structure of the expanded experiment, a correlation analysis was performed between the statistics used in the input layer and the actual breeding values (Table 2). The correlations were equal, considering a t-test (p = 0.01). Moreover, although the statistics used in the input layer appeared to be sufficient to predict the genetic value, additional studies are needed to quantify the influence of each in the prediction process, as well as evaluate the removal or inclusion of statistics. The same evaluation was performed considering the simulated data file and the 120 replicated files used in the validation process, where a similar result was obtained (data not show). The reasoning behind this step is that the researcher could question the veracity of the validation process, since sometimes this can be done with the training file or only part of it. The replicated files serve to emulate situations in which the ANN created is used in contemporary prediction experiments of the genotypes evaluated.
Table 1 – Estimates of genetic parameters derived from the analysis of variance of the simulated files and expanded data, for heritability scenarios of 40 and 70 %. The data expansion process preserves the structure of the original data file. h2 = 40 %
Parameter estimates µ
σ g2
σ
2 e
h2 = 70 %
Simulated
Expanded
Simulated
100.0000
100.0001
100.0000
Expanded 99.9999
25.0000
25.0019
87.5000
87.5004
225.0000
225.0051
225.0000
225.0024
h2
40.0000
40.0013
70.0000
69.9998
h2ind
10.0000
10.0005
28.0000
27.9998
CVe (%)
15
15
15
15
CVg (%)
5
5
9
9
m – mean; σ – genetic variance; σ – residual variance; h – heritability at the level of the genotype mean; h – heritability at the level of the individual; CVe – coefficient of experimental variation; CVg – coefficient of genetic variation. 2 g
2 e
2 ind
2
Table 2 – Correlation between the genetic values (GV) and statistic values estimated for the simulated and expanded data sets. Square of the Correlation coefficient
h2 = 40 % Simulated
h2 = 70 % Expanded
Simulated
Expanded
GV × mean
0.4001**
0.4001**
0.7001**
0.7001**
GV × max
0.2928*
0.2253**
0.5512**
0.5253**
GV × min
0.2417*
0.2552**
0.5039**
0.4982**
GV × sd
0.0015ns
0.0000ns
0.0015ns
0.0022ns
GV × CVe
0.0110ns
0.0323ns
0.0570ns
0.0978**
GV × Pi
0.3623**
0.3923**
0.6696**
0.691**
GV × Rank
0.3848**
0.3772**
0.6871**
0.6752**
GV × class 0.4290** 0.3624** 0.6395** 0.641** GV– Genetic value; max – Maximum value; Min – minimum value; sd – standard deviation; Rank – sum of ranks; class – classification; CVe – coefficient of experimental variation; Pi – Lin and Bins’s statistic value; *Significance at 5 % level; **Significance at 1 % level; ns – Non-significant (p > 0.05).
Sci. Agric. v.71, n.6, p.494-498, November/December 2014
497
Silva et al.
Artificial intelligence for prediction
The usual procedure for determining the stop criterion of the ANN is the mean squared error of prediction. Once the mean squared error of prediction reached an optimal level, training stopped and this led to the best estimates of the network coefficients (Haykin, 1998). This stop criterion is usually applied when the validation process of the ANN is obtained with one validation file, and has been used by several authors (Gianola et al., 2011; Timm et al., 2006; Ventura et al., 2012). Because in this work 120 validation files were used, an alternative was adopted in which the stop criterion was the maximum number of hits obtained by the ANN considering the 120 replicates. Herein, we assessed the number of times in which the square of the correlation between the response of the ANN and the true genotypic value was higher than the square of the correlation between the mean phenotypic value and the phenotypic value considering all combinations of neurons, number of hidden layers and activation functions used. Thus, a comparison between the measure of network reliability and heritability of the trait was performed, which is the criterion used in the conventional method for predicting gain, identifying the selective units and choosing the selection strategies. Because improving selection efficiency is still a challenge shared by both breeders and biometricians, selection efficiency was evaluated by means of the ability of the ANN to discard a genotype that would eventually have a low genetic value and/or select a genotype that would have a high genetic value. Our results with the ANN are as good as or better than those obtained with traditional methodologies, based
Table 3 – Mean percentage of coincidence for selected and rejected genotypes by means of prediction via the ANN and linear models, and accuracy of prediction. Coincidence (%)
Selected (5 %)
Selected (10 %)
Rejected (20 %)
Rejected (10 %)
Accuracy
MLE ANN
h2 = 40 % 30 34
h2 = 70 % 51 52
MLE-ANN
70
92
MLE
39
58
ANN
40
58
MLE-ANN
81
95
MLE
51
68
ANN
52
68
MLE-ANN
90
98
MLE
43
62
ANN
46
63
MLE-ANN
82
97
MLE
63
84
ANN 64 84 MLE – selection by maximum likelihood estimator compared with the true genetic value, calculated by the software GENES; ANN – Artificial Neural Network selection compared with the true genetic value; MLE-ANN – selection by maximum likelihood estimator compared with Artificial Neural Network selection.
on least squares estimates. However, this comparison is unfair since the current paradigm of the selection process is based on an estimate of the mean genotype. For this reason, subsequent studies on real breeding populations are needed to prove the superiority of ANN predictions. In both cases, recovery of the genetic value as performed by the ANN was more effective than that based on the mean genotypic value, estimated by maximum likelihood (MLE) in both simulated scenarios (Table 1). Estimates of prediction accuracies by the ANN, considering the 120 validation experiments, were on average 1 % and 0.5 % higher considering the heritabilities of 40 and 70 %, respectively. After prediction and ordering of the genetic values a variation in classification of the genotypes was perceived, which according to Ventura et al. (2012) may result in risks if the ANN is used for genetic evaluation of the trait. Table 3 presents estimates of coincidence in classification of the selected – intensities of 5 to 10 % – and rejected genotypes – intensity of 10 and 20 % – based on real breeding values and genetic values obtained by the ANN and by MLE. In all cases, the ANN presented coincidences greater than those obtained by the selection process from linear models, indicating that the predictions allow for a better discrimination of genotypes based on their genetic value. Despite the low values, coincidences of selected genotypes reflect the difficulty in selecting genotypes for a quantitative trait, where this effect is more pronounced for lower heritability values. In contrast, coincidences greater than 69 % when comparing the genotypes selected by the ANN and the traditional method indicated that, for the most part, the same genotypes were selected by both approaches. Additional procedures may be performed in order to preserve other traits of the original data set, however, the traits emphasized and preserved for the purposes of this study appeared to be sufficient to test the network in its training phase, information that allowed for accurate prediction of genetic values and classification of genotypes. An important question in animal and plant breeding is how an estimated “breeding value”, i.e., an estimate of the total additive genetic effect of an individual, can be arrived at from an ANN output (Gianola et al., 2011). Gianola et al. (2011) suggested two approaches for modeling such effects. Such propositions, however, were made considering a model based on Bayesian neural networks using information of molecular markers – genomic selection. Applied to our context, although of extreme importance to the breeder, it is necessary to understand and use information concerning the relationship between the individuals, a scenario which, although relevant, was not assessed herein. Therefore, it is of great importance that more studies be conducted to permit the development and application of ANN in the field of genetic breeding.
Sci. Agric. v.71, n.6, p.494-498, November/December 2014
498
Silva et al.
Artificial intelligence for prediction
Conclusions The ANN demonstrated superiority over the traditional method to discriminate genotypes based on their real genetic value. The biometrician possesses a range of relevant statistical information, but these are underused in the decision making process. The ANN adjusted model was able to take into account these additional statistics, with high practical content, in the genetic value prediction process. ANN has great potential for use as an alternative method to predict genetic values and as a tool for genotypic selection.
Acknowledgements To CAPES – Coordination for the Improvement of Higher Level Personnel, FAPEMIG – Minas Gerais State Foundation for Research Support and CNPq – Brazilian National Council for Scientific and Technological Development, for financial support and scholarships granted.
References Cruz, C.D.; Regazzi, A.; Carneiro, P.C.S. 2012. Biometric Models Applied to Genetic Improvement. 4ed. UFV, Viçosa, MG, Brazil (in Portuguese). Ferreira, R.T.; Viana, A.P.; Barroso, D.G.; Resende, M.D.V.; Amaral Júnior, A.T. 2012. Toona ciliata genotype selection with the use of individual BLUP with repeated measures. Scientia Agricola 69: 210-216. Gianola, D.; Okut, H.; Weigel, K.A.; Rosa, G.J.M. 2011. Predicting complex quantitative traits with Bayesian neural networks: a case study with Jersey cows and wheat. BMC Genetics 12: 87.
Sci. Agric. v.71, n.6, p.494-498, November/December 2014
Haykin, S. 1998. Neural Networks: A Comprehensive Foundation. 2ed. Bookman, Upper Saddle River, NJ, USA. Lin, C.S.; Binns, M.R.A. 1988. Superiority measure of cultivar performance for cultivar x location data. Canadian Journal of Plant Science 68: 193-198. Nascimento, M.; Peternelli, L.A.; Cruz, C.D.; Nascimento, A.C.C.; Ferreira, R.P.; Bhering, L.L.; Salgado, C.C. 2013. Artificial neural networks for adaptability and stability evaluation in alfafa genotypes. Crop Breeding and Applied Biotechnology 12: 152-156. Ribeiro, N.D.; Mambrin, R.B.; Storck, L.; Prigol, M.; Nogueira, C.W. 2013. Combined selection for grain yield, cooking quality and minerals in the common bean. Revista Ciência Agronômica 44: 869-877. Timm, L.C.; Gomes, D.T.; Barbosa, E.P.; Reichardt, K.; Souza, M.D.; Dynia, J.F. 2006. Neural network and state-space models for studying relationships among soil properties. Scientia Agricola 63: 386-395. Ventura, R.V.; Silva, M.A.; Medeiros, T.H.; Dionello, N.L.; Madalena, F.E.; Fridrich, A.B.; Valente, B.D.; Santos, G.G.; Freitas, L.S.; Wenceslau, R.R.; Felipe, V.P.S.; Corrêa, G.S.S. 2012. Use of artificial neural networks in breeding values prediction for weight at 205 days in Tabapuã beef cattle. Arquivo Brasileiro de Medicina Veterinária e Zootecnia 64: 411-418 (in Portuguese, with abstract in English). Verardi, C.K.; Oliveira, A.L.B.; Silva, G.A.P.; Gouvêa, L.R.L.; Gonçalves, P.S. 2014. Comparison between different selection methods of rubber trees. Industrial Crops and Products 52: 255-263.