RIAO/OPTILAS 2007 6th Ibero-American Conference on Optics (RIAO) and the 9th Latin-American Meeting on Optics, Lasers and Applications (OPTILAS) Campinas, São Paulo, Brazil
21 – 26 October 2007
EDITORS
Niklaus Ursus Wetter Institute for Nuclear and Energetic Research São Paulo, Brazil
Jaime Frejlich IFGW-UNICAMP Campinas, Brazil All papers have been peer-reviewed SPONSORING ORGANIZATIONS The State of São Paulo Research Foundation - FAPESP The State University of Campinas - UNICAMP The Physics Institute Gleb Wataghin - IFGW The Brazilian Society of Physics - SBF The National Council for Scientific and Technological Development - CNPq The Optical Society of America - OSA The International Society for Optical Engineering - SPIE The International Commission for Optics - ICO The Abdus Salam International Centre for Theoretical Physics - ICTP The European Optical Society - EOS The University of Campinas Research Foundation - FAEPEX The National Council for High Level Education - CAPES
Melville, New York, 2008 AIP CONFERENCE PROCEEDINGS
VOLUME 992
Editors: Niklaus Ursus Wetter Institute for Nuclear and Energetic Research R. Lineu Prestes 2242 Cid. Universit. 05508-000 São Paulo - SP Brazil E-mail:
[email protected] Jaime Frejlich Laboratório de Óptica IFGW-UNICAMP Caixa Postal 6165 13083-970 Campinas - SP Brazil E-mail:
[email protected]
The article on pp. 507-512 was authored by a U. S. Government employee and is not covered by the below mentioned copyright.
Authorization to photocopy items for internal or personal use, beyond the free copying permitted under the 1978 U.S. Copyright Law (see statement below), is granted by the American Institute of Physics for users registered with the Copyright Clearance Center (CCC) Transactional Reporting Service, provided that the base fee of $23.00 per copy is paid directly to CCC, 222 Rosewood Drive, Danvers, MA 01923. For those organizations that have been granted a photocopy license by CCC, a separate system of payment has been arranged. The fee code for users of the Transactional Reporting Service is: 978-0-7354-0511-0/08/$23.00. © 2008 American Institute of Physics Individual readers of this volume and nonprofit libraries, acting for them, are permitted to make fair use of the material in it, such as copying an article for use in teaching or research. Permission is granted to quote from this volume in scientific work with the customary acknowledgment of the source. To reprint a figure, table, or other excerpt requires the consent of one of the original authors and notification to AIP. Republication or systematic or multiple reproduction of any material in this volume is permitted only under license from AIP. Address inquiries to Office of Rights and Permissions, Suite 1NO1, 2 Huntington Quadrangle, Melville, NY 11747-4502; phone: 516-576-2268; fax: 516-576-2450; e-mail:
[email protected]. L.C. Catalog Card No. 2008922554 ISBN 978-0-7354-0511-0 ISSN 0094-243X Printed in the United States of America
General Chair Jaime Frejlich UNICAMP International Scientific Committee • Erna Frins (Uruguay) • Angela Ma. Guzman H. (Colombia) • Alexei A. Kamshilin (Finland) • Guillermo Kauffman (Argentina) • Arturo Lezama (Uruguay) • Fernando Mendoza (Mexico) • Luis Mosquera (Peru) • Hector Moya (Mexico) • Jose Luis Paz (Venezuela) • Hector Rabal (Argentina) • Y. Tomita (Japan) • Yezid Torres M. (Colombia) • Asticio V. Vargas (Chile) • Maria J. Yzuel (Spain)
• Miguel V. Andres (Spain) • Cid B. de Araújo (Brazil) • Guillermo Baldwin (Peru) • Vanderlei S. Bagnato (Brazil) • Mercedes Carrascosa (Spain) • Anna Consortini (Italy) • Manuel Filipe Costa (Portugal) • Brian Culshaw (U.K.) • Luiz Davidovich (Brazil) • Rufino Diaz U. (Mexico) • Concepcion Domingo (Spain) • A.A. Friesem (Israel)
Organizing Committee
Local Committee
• Armando Albertazzi (UFSC) • Isabel Carvalho (PUC-RJ) • Tomaz Catunda (USP/S.Carlos) • Ivan de Oliveira(CESET/UNICAMP) • DarioDonatti (UNESP/RC-SP) • Pedro V. dos Santos (UFAL) • Anderson Gomes (UFPE) • Luis G. Neto (UFSC- S.Carlos) • Artur da S.Gouveia-Neto (UFRPE) • Jandir M. Hickman (UFAL) • Flavio Horowitz (UFRGS) • Salomon Mizrahi (UFSCAR-DF) • Carlos Monken (UFMG) • Sebastião Padua (UFMG) • José W. Tabosa (UFPE)
• Luis E. E. de Araujo (UNICAMP) • Eduardo A. Barbosa (FATEC/SP) • Fernando L. Braga (SBFisica) • Lucila Cescato (UNICAMP) • Cristiano Cordeiro (UNICAMP) • Flavio C. Cruz (UNICAMP) • Mikiya Muramatsu (USP/SP)) • José A. Roversi (UNICAMP) • Antonio Vidiella Barranco (UNICAMP) • Niklaus U. Wetter (IPEN) • Maria Luisa Calvo (Spain)
xix
New Approach for Fast and Accurate Color-pattern Recognition Alexei A. Kamshilin, Laure Fauch, and Ervin Nippolainen Department of Physics, University ofKuopio, P.O.Box 1627, FIN-70211 Kuopio, Finland Abstract. Measurement of the reflectance spectrum at each spatial point of an object surface certainly provides high accuracy for color classification and recognition but it takes time and requires huge computer resource. The method of principal components analysis allows us to fmd an optimal (low-dimensional) set of basic spectra with which any reflectance spectrum can be reconstructed with any required precision. By using these basic spectra high compression of multispectral images can be achieved. In this report we describe novel system for optical implementation of the principal component analysis. Projections of a reflection spectrum on the preliminary defined set of basic spectra (spectral eigenvectors) are directly and simultaneously measured at all spatial points of the object surface. The system is capable to implement even spectral eigenvectors with negative components. Key-element of the proposed approach is the computercontrolled light source. It consists of a set of the light-emitting diodes and generates any predefined basic spectrum with possibility of fast switching from one spectrum to another. The system can measure two-dimensional distribution of reflection spectra in whole visible diapason. Thereafter, the measured data are used for fast and accurate color-pattern recognition without reconstruction of the original reflection spectrum. Feasibility of the proposed technique is experimentally demonstrated by measuring weighting coefficients for four metameric colors.
INTRODUCTION Accurate recognition of color patterns is important operation for different applications including medical diagnostics, control of technological processes, authentication of art and secured papers, etc. Generally speaking, color is a result of interaction of the object's surface, illumination source, and observer. In conventional visual systems color is usually presented with a standard trichromatic color-coordinate system. Consequently, in the most cases color information is introduced in the recognition process by means of three spectral channels in addition to the channels bearing spatial information. Multi-channel joint transfer correlation with filter matching in each channel is frequently used to recognize the object [1,2]. For successful recognition of color pattern, the spectral power distribution (SPD) of the illuminant and spectral sensitivity of the imaging device are preferably to be known. Several studies were devoted to the problem of funding pattern-recognition architecture capable to remove the effects of varying illumination conditions, i.e. finding color constancy algorithms [3-5]. Common feature for all these techniques is recovery of the reflection spectrum from the responses of a trichromatic two-dimensional imaging system such as a color charge-coupled device camera. It is evident that measurement of the reflectance spectra allows overcoming abovementioned problems since it generates specific signature of the material, which could be a basis for accurate classification and recognition. However, a spatially resolved spectral measurement with consequent calculation of the correlation function of two images with big number of spectral channels is difficult and time-consuming task. Conventional spectrophotometers allow measuring reflectance with high spectral resolution but they are typically characterized by low spatial resolution. To the date no devices have been reported capable to directly measure spatially resolved twodimensional distribution of the spectral reflectance. There are only few commercially available systems capable for measuring one-dimensional distribution of the reflectance spectra along the illumination stripe. To obtain twodimensional spectral image one should scan the object in the direction orthogonal to the illumination line. Another approach for obtaining spatially resolved spectral information is multispectral imaging of the object surface [6-8]. It is usually performed by using five or more color filters for multiband filtering of the reflected/transmitted light. Typically, the rotated filters are mounted in front of a monochrome type of CCD camera [6-8]. The reflection spectra can be also reconstructed from responses of trichromatic camera-systems after proper
CP992, RIAO/OPTILAS 2007, edited by N. U. Wetter and J. Frejlich © 2008 American Institute of Physics 978-0-7354-0511-0/08/$23.00
33 Downloaded 23 May 2008 to 10.1.150.91. Redistribution subject to AIP license or copyright; see http://proceedings.aip.org/proceedings/cpcr.jsp
multispectral imaging [9,10]. The aim of multispectral imaging is reconstruction of the reflection spectrum of each pixel of CCD camera. In this paper we propose a novel approach for measurements of two-dimensional distribution of the reflection spectra with high spatial resolution. Our approach is based on the vector subspace model of color representation and it allows speeding up the process of color pattern recognition. The spectral data are already compressed on the stage of measurements, while the reflection spectrum can be readily reconstructed by using simple linear relationships. For the purpose of color classification or recognition compressed data could be directly used as well.
SUBSPACE VECTOR METHOD FOR COLOR CLASSIFICATION As known, many of natural or artificial materials have rather smooth dependence of the reflectance on the light wavelength in the visible range of the spectrum. In addition, color classification/recognition is typically performed within the limited number of samples with different reflection spectra. For such a hmited set of smooth reflectance spectra one can always find [11,12] few basis functions S,{X) so that any particular reflection spectrum R{X) is a linear combination of these basis functions:
R{l) = j]a,SX^)
(1)
1=1
Here the eigenvectors S,{1) are chosen so as to be mutually orthogonal within the limited range of wavelengths the coefficients, cr„ are real numbers, which unambiguously represent particular reflectance spectrum within the given set of samples. The number Q of the basis functions depends on the database size, complexity of the reflectance spectra, and required accuracy of spectrum recognition. It was shown previously [11,13] that surfacespectral reflectances of both natural and artificial objects can be represented with the use of 5 to 7 basis functions. Determination of these basis functions is typically performed by using statistical analysis of the measured set of the reflectance spectra, which is referred to as principle component analysis (PCA). Let us suppose that we have defined the set of reflectance spectra within which recognition/classification of different colors is to be carried out. Consequently, the shape and number of the basis functions 5',(X) is determined, as well. For example, if a color surface belongs to the set of artificial objects, one can use the basis functions calculated and published in [II]. Since the basis functions are known, the coefficients cr, associated with particular reflectance spectrum, i?(X), are defined as M
a,=X^(4K.(4)-
(2)
k=l
Here Ik is the wavelength at which the spectral reflectance assuming measurements in the discrete form (typical sampling rate is I -10 nm) as it is usually done in practice. M i s the number of the wavelength intervals defined by the sampling rate and by the spectral band used. It follows from Eq.2 that by providing illumination of the object surface by a light source, which spectral power distribution (SPD) corresponds to S,{1) we could directly measure the coefficients cr,. However, the basis functions S,{1) take both positive and negative values to satisfy the requirement of mutual orthogonalify. Therefore, straightforward design of light source with SPD of Si{l) is hardly possible. Some efforts were applied to search for approximate functions with non-negative values that can accurately enough represent any spectral reflectance from the given set [14,15]. Design of such kind of functions was optically implemented by using iterative feedback [14] or neural network [15]. In both cases an optical system with liquid-crystal spatial hght modulator was used to synthesize light with desirable spectral power distribution for further illumination of the object surface. Here we describe a technique for optical implementation of the basis functions, which may contain both positive and negative parts.
34 Downloaded 23 May 2008 to 10.1.150.91. Redistribution subject to AIP license or copyright; see http://proceedings.aip.org/proceedings/cpcr.jsp
COMPUTER CONTROLLED LIGHT SOURCE
Principle of the operation To synthesize light possessing preliminary determined spectral power distribution we propose to use set of hghtemitting diodes (LED). Recent progress in LED technology makes them very attractive for using as a light source in spectral measuring systems. LEDs are cheap and robust possessing high spectral luminous and high efficiency. It is not a problem to collect a set of LEDs generating hght at different wavelengths and covering the whole visible diapason. Switching among different LEDs can be accomplished with high speed thus providing possibility to generate any arbitrary sequence of the spectral hues. Let the output optical power of a spectral line with the central wavelength of 1^ be of P{lk)- First, we illuminate the object surface by a sequence of the spectral lines at which the basis function 5',(/lt) has positive values. Illumination by each spectral line is carried out during the exposure time of /f (l^) so that ^(/l^ )/f (l^) = S^ (l^) for all Ik at which 5',(/lt) > 0. Light reflected from the surface is collected into a photo-receiver operating in the integration regime. Integration of the reflected light flux during the total exposure by the sequence of the spectral hues results in the output signal from the photo-receiver: Mp
jf=X4^.M^.>f(^.M^J^
(3)
k=l
where 1^ is the peak wavelength of the spectral hue illuminating the object and K(lk) is the calibration coefficient, which takes into account spectral dependence of photo-receiver's sensitivity. Second, we illuminate the object by another sequence of the spectral hues emitted with exposure time of tf{l,^) chosen to satisfy the condition p{l;^)tf{l;^)=S\l;^) signal of the photo-receiver is
when5',(/lt) < 0. After illumination by this sequence, the output
Mn
jf=£.-(i,Mi,>f(iX4).
(4)
k=l
Numbers Mp and Mn satisfy the condition of Mn +Mp = M . Evidently, by calculating the difference J f - Jf
one
can obtain the coefficient cr,. Repeating the measuring procedure for all basis functions we obtain all coordinates in the «-dimensional subspace, which unambiguously represent the spectral reflectance of the object surface. Note that the calibration coefficients K(X,^) in Eqs.3,4 are independent from the shape of basis functions, while the output power P{lk) may be adjusted during switching from one function to another to optimal fitting with the dynamic range of the photo-receiver. This adjustment can be done by changing the injection current of LED. Since the integration regime of photo-receiving is typical for a CCD matrix, the proposed approach provides fast and precise measurements of two-dimensional distribution of the reflectance spectra with high spatial resolution. In this case a monochrome CCD camera is to be used as the photo-receiver. Light reflected from a small area of the object is collected into respective pixel of the CCD matrix. Under illumination of whole object surface by proper sequence of the spectral lines, measurements of coefficients cr, is done in parallel for all small areas of the surface. Difference between two frames grabbed during illumination by sequences of the spectral lines corresponding to the positive and negative parts of the basis function Si{lk) gives two-dimensional distribution of the weighting coefficients cr,. After illuminating the object by the complete set of the basis functions, we get n matrices that can be used for accurate reconstruction of two-dimensional distribution of object reflectance with high spatial resolution. The spatial resolution is defined by the illuminated area divided by the total number of pixels in CCD matrix (which is typically larger than 10*').
35 Downloaded 23 May 2008 to 10.1.150.91. Redistribution subject to AIP license or copyright; see http://proceedings.aip.org/proceedings/cpcr.jsp
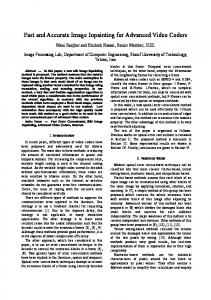
First prototype of smart light source First prototype of hght source capable to generate fast switchable sequence of spectral lines has been fabricated by Optoinspection Ltd. in accordance with design developed in our laboratory. Figure 1 shows principal layout of optical part of the light source without correct scahng and angular position of the elements to simplify the drawing. Fifteen conventionally available light-emitting diodes were used to cover a wide band of the wavelengths (390 - 710 nm). The spectral bandwidth of each individual LED varies from 20 to 150 nm. Sharpening of the emitted spectral hue was achieved by means of tunable acousto-optic filter (TAOF). As known, acoustic wave excited in acoustooptic crystal acts as a volume grating, the hght diffraction from which is allowed only within the limited spectral band. By this way the bandwidth of spectral lines is reduced to the magnitude from 4 nm in violet to 8 nm in the red. By changing the frequency of the excited acoustic wave one can readily vary the wavelength of the filtered light. In comparison with other tunable spectral filters, TAOF is characterized by fast switching time. The switching time of our particular TAOF between two arbitrary chosen wavelengths is less than 20 |is. Efficient performance of TAOF requires that the light from different LED's is incident on the filter at the same angle. Light beams from different LEDs were combined by means of a conventional diffraction grating. It is a challenging task to design an optical scheme for combining the light so as to provide propagation of all beams in the same direction. The output light power achieved in our first prototype varies between 0.7 and 8 ^W for different spectral lines. In the next version, which is currently under design in our laboratory, we expect to get 10 - 50 folds increasing of the light power.
Beam combiner
TAOF
FIGURE 1. Schematic view of the optical part of computer-controlled light source. At any given moment device emits one spectral line at the central wavelength defined by the frequency of the acoustic wave excited in TAOF and by the LED, which is switched on. Electronic unit of the light source was designed to provide the control of injection current of LEDs and both the frequency and the amplitude of the acoustic wave. It also includes a microprocessor responsible for data exchange with personal computer. The device performance is fully controlled by a personal computer so that the central wavelength of the spectral hue, duration of each illumination period, and the output power of such emission can be introduced into the computer, stored in its memory, and then retrieved in any required order. Particularly, sequences corresponding to either positive or negative part of anyone from the basis functions 5',(/l) can be generated.
DISTINGUISHABILITY OF METAMERIC COLORS Feasibility of the proposed approach was demonstrated by checking ability of the system to distinguish samples with small hue difference. Four color samples of the Macbeth Daylight metamerism kit #3 from the GretagMacbeth Company were chosen as a test object. Under dayhght illumination, colors of these samples are hardly distinguishable within the conventional three dimensional color-coordinate system (i.e., the color coordinates in three dimensions representation are the same). Difference in color is invisible even by eye. We used seven basis functions S,{X) calculated by Parkkinen et al. [15] for the set of 1257 Munsell color chips. Sequences ^(/l^ff (/l^) and ^(/l^)/^ (l^) proportional to the functions Si(X) were stored in the computer, which control performance of the hght-source prototype. Each sample of the metamerism kit was illuminated under normal incidence and light reflected from the surface at the average angle of 45° was collected into a photodiode. First we illuminate a sample by a sequence of the spectral lines proportional to the positive part of the basis function Sll^)During this illumination the electrical signal from the photodiode was integrated thus providing measurement of the coefficient Jf . Then the same sample was illuminated by the sequence constituting the negative part of the same
36 Downloaded 23 May 2008 to 10.1.150.91. Redistribution subject to AIP license or copyright; see http://proceedings.aip.org/proceedings/cpcr.jsp
basis function Silk) thus measuring Jf. By calculating the difference J f - Jf we obtain the coefficient cr,. Thereafter we repeat the procedure for other basis functions to obtain the coefficients for positive and negative parts of all 7 basis functions. After respective subtraction, we get components of a 7-dimensional (7D) vector, a , which characterizes the spectral reflectance of the sample. Measurements were carried out several times in different points of the sample. Then the similar set of measurements was carried out with each of four samples of the kit. As a result, several 7D-vectors were prescribed to the same sample. Difference between them characterizes both the uniformity of spectral reflectance over the sample surface and the experimental error of our measurements. Since the output light power of our first prototype is not very high, we beheve that this difference is mainly due to the experimental errors. For quantitative estimation, how these 7D-vectors vary from one point to another we calculate the dot product of the normalized vectors a . Similarly, the inner product of the vectors characterizing different samples, R„„, was calculated to estimate difference between reflection spectra of different samples: R^
(5)
Here symbols m and n identify the metameric samples in the kit: both symbols may run values of A, B, C, or D. Three-dimensional diagram in Fig.2 shows the difference Ai?„„ = 1 - R^^ between all possible combinations of the samples. Cylinders in the diagonal ( M , ^ when m = n) relate to difference in dot products of 7D-vectors corresponding to different measurements of the same sample. They reflect repeatability of the measurement of avector for each sample. We plot in Fig.2 the maximal values of Ai?„„ for each diagonal element. Non-diagonal elements {m ^ n) show the difference between 7D-vectors of different metameric samples. In contrast with the diagonal elements, minimal values of Ai?„„ are plotted in Fig.2 for each non-diagonal element. Comparison of the absolute maximum for diagonal elements ( M ^ B = 0.0007) with the absolute minimum for non-diagonal elements (Ai?^ = 0.0019) clearly indicates that the metameric samples are surely distinguishable.
0.035
0.030 0.025
FIGURE 2. Difference of the inner product of normalized 7D-vectors, which represent the reflection spectra of the metameric samples. Non-diagonal elements correspond to the product of two vectors from different samples, while the diagonal elements relate to the vectors from the same sample but measured in different points.
37
Downloaded 23 May 2008 to 10.1.150.91. Redistribution subject to AIP license or copyright; see http://proceedings.aip.org/proceedings/cpcr.jsp
CONCLUSION In this report we described a novel technique for fast measurements of two-dimensional distribution of the reflection spectra in the visible diapason. Projections of a reflection spectrum on the prehminary defined set of the basis functions are directly and simultaneously measured at all spatial points of the object surface. This allows us to acquire spatial distribution of the reflection spectra in the compressed form in the stage of measurements. The compressed data can be directly used for accurate color classification or recognition, without reconstruction of the reflection spectra. Key-system for the implementation of the proposed approach is computer-controlled light source capable to generate fast switchable sequence of spectral lines. First prototype of such a hght source was fabricated and used to demonstrate ability of the system to distinguish samples with extremely small hue difference. Owing to parallel processing of the spatial information, fast switching time, and high sensitivity to the reflectance spectra difference, the proposed approach may be very useful for quality control of various industrial processes through on-line color monitoring. Fast and accurate measurement of 2D-distribution of the reflection spectra is also important instrument for medicine and cosmetic. For example, precise measurements of the spectra distribution of human skin could provide important information not only for skin-diseases diagnostics but also for monitoring diseases treatment. These spectral measurements should be taken quite rapidly to prevent spatial blurring of information, which may be caused by patient's movement. High speed of spectral data acquisition is even more required for obtaining color distribution of eye cornea. The proposed method is capable to provide such fast measurements of 2D distribution of the reflection spectra. It could also find apphcations in systems for security document authentication where high distinguishing of colors is very important factor.
REFERENCES 1. C. Warde, H. J. Caulfield, F. T. S. Yu, and J. E. Ludman, Opt. Commun. 49, 241-244 (1984). 2. M. S. Millan, M. Corbalan, J. Romero, and M. J. Yzuel, Opt. Lett. 20, 1722-1724 (1995). 3. M. D'Zmura and G. Iversion, J. Opt Soc. Am. A 10, 2148-2165 (1993). 4. B. V. Funt and G. D. Finlayson, IEEE Trans. Pattern Anal. Mack Intell. 17, 522-529 (1995). 5. M. Corbalan, M. S. Millan, and M. J. Yzuel, Opt Eng. 41, 130-138 (2002). 6. S. Tominaga, J. Opt Soc. Am. A 13, 2163-2173 (1996). 7. S. Baronti, F. Casini, F. Lotti, and S. Porcinai, ^/>p/. Opt 37, 1299-1309 (1998). 8. D.-Y. Ng and J. P. AUebach, IEEE Trans, on Image Processing 15, 2631-2643 (2006). 9. L. T. Maloney and B. A. Wandell, J. Opt Soc. Am. A 3, 29-33 (1986). 10. V. Cheung, S. Westland, C. Li, J. Y. Hardeberg, and D. Connah, J. Opt Soc. Am. A 22, 1231-1240 (2005). 11. J. P. Parkkinen, J. Hallikainen, and T. Jaaskelainen, J. Opt Soc. Am. A 6, 318-322 (1989). 12. J. Y. Hardeberg, F. Schmitt, and H. Brettel, Opt Eng. 41, 2532-2548 (2002). 13. T. Jaaskelainen, J. P. Parkkinen, and S. Toyooka, J. Opt Soc. Am. A 1, 725-730 (1990). 14. N. Hayasaka, S. Toyooka, and T. Jaaskelainen, Opt. Commun. 119, 643-651 (1995). 15. M. Hauta-Kasari, K. Miyazawa, S. Toyooka, and J. P. Parkkinen, J. Opt Soc. Am. A 16, 2352-2362 (1999).
38 Downloaded 23 May 2008 to 10.1.150.91. Redistribution subject to AIP license or copyright; see http://proceedings.aip.org/proceedings/cpcr.jsp