Magyar Kutatók 7. Nemzetközi Szimpóziuma 7th International Symposium of Hungarian Researchers on Computational Intelligence
Node Similarity-based Graph Clustering and Visualization Miklós Erdélyi, János Abonyi Department of Process Engineering, University of Pannonia P.O. Box 158, H-8201 Veszprém, Hungary, e-mail:
[email protected]
Abstract: The basis of the presented methods for the visualization and clustering of graphs is a novel similarity and distance metric, and the matrix describing the similarity of the nodes in the graph. This matrix represents the type of connections between the nodes in the graph in a compact form, thus it provides a very good starting point for both the clustering and visualization algorithms. Hence visualization is done with the MDS (Multidimensional Scaling) dimensionality reduction technique obtaining the spectral decomposition of this matrix, while the partitioning is based on the results of this step generating a hierarchical representation. A detailed example is shown to justify the capability of the described algorithms for clustering and visualization of the link structure of Web sites.
1
Introduction
Complex networks are getting more important and by time they get more complex also, thus in order to be able to gain insight into these sophisticated structures we need to somehow visualize them. There have been many graph drawing algorithms developed in recent years [1, 2], however, they alone cannot be efficiently used to visualize large graphs which have hundreds or thousands of nodes. The problem with traditional graph drawing algorithms is that because of the complexity of the networks which have to be visualized the resulting drawing is difficult to interpret for humans. In order to encounter this problem clustering of these kinds of graphs can be used to reduce the visual complexity and help the data miner discover the intrinsic features. Examples of complex networks are scale-free networks. A network is named scale-free if its degree distribution, i.e. the probability that a node selected uniformly at random has a certain number of links (degree), follows a particular mathematical function called a power law. The power law implies that the degree distribution of these networks has no characteristic scale. Albert-László Barabási is one of the most well-known researchers of scale-free networks. In the Barabási-Albert preferential attachment model the probability of
483
M. Erdélyi et al. Node Similarity-based Graph Clustering and Visualization
adding a new edge between an existing and a new node is proportional to the degree of the existing node [3]. In [4] it is concluded that the Web forms a smallworld network, which characterizes social or biological systems, such that two randomly chosen documents on the Web are on average 19 clicks away from each other. That is, despite its huge size, the Web is a highly connected graph with an average diameter of only 19 links. In the well-known book [5], though in a less scientific manner, more examples and explanation of the workings of scale-free networks are given. Because of the large-scale property of the Web and its high growth rate, finding information on it is becoming more challenging. A well-known algorithm for extracting relationships between Web pages is PageRank [6] which creates a transition matrix for the Markov chain of a theoretical infinitely dedicated Web surfer browsing the Web by randomly clicking on links to obtain the ‘authority’ of individual Web pages. Another solution to easing the location of information is clustering the Web pages. In [7] a way of web content mining is introduced by performing relational clustering of Levenshtein distances. Relational alternating cluster estimation (RACE) is applied to automatically extract meaningful keywords from documents and then these keywords are used to automatically classify (previously unknown) documents. In order to speed up the web mining process a new graph representation, the graph matrix, which combines the adjacency matrix with the linked lists allowing for the fastest possible access to different types of information on a graph is shown in [8]. The graph representation is increasingly important for a high search performance, for instance, for rapidly extracting information from the link structure in a hub and authority graph of the Web. An application of this data structure arises from categorical data clustering defining proximity and similarity of data through their patterns of co-occurrence. Another sophisticated document clustering is presented by [9]. It is concluded that the novel normalized-cut method using a new approach of combining textual information, hyperlink structure and co-citation relations into a single similarity metric provides an efficient way of clustering documents. Graph-theoretic clustering methods include [10] in which a structure called scale-free minimum spanning tree is used. In [11] a spectral method is described which can be used to partition graphs into non-overlapping subgraphs along with how the Fiedler-vector of the Laplacian matrix can be used to decompose graphs into non-overlapping neighbourhoods that can be used for the purposes of clustering. There is also a growing research interest in complex networks from the perspective of bioinformatics. Primarily for this field Vicsek et al. developed the application CFinder [12] for locating and visualizing overlapping, densely interconnected nodes in an undirected graph. This application is able to locate the cliques of large sparse graphs efficiently and allows the user to navigate between the original graph and the web of interconnected node groups. In a letter Vicsek et al [13] discussed clique percolation in Erdős-Rényi random graphs, a novel and efficient
484
Magyar Kutatók 7. Nemzetközi Szimpóziuma 7th International Symposium of Hungarian Researchers on Computational Intelligence
approach for discovering the overlapping communities in large networks. It was obtained that the percolation transition takes place when the probability of the connection of two vertices reaches a threshold, and at this transition point the scaling of the giant component with the number of vertices in the random graph is highly non-trivial and is related to the size of the inspected cliques. The most related work to this paper is presented in [14]. A novel metric of node similarity is proposed which is used for clustering the graph and with the help of which the linkage pattern of the graph is encoded into the similarity matrix. The hierarchical abstraction of densely linked subgraphs is obtained by applying the kmeans algorithm to this matrix with a heuristic method to overcome the inherent drawbacks of the k-means algorithm. For the resulting clustered graphs a multilevel multi-window approach is presented to hierarchically draw them in different abstract level views with the purpose of improving their readability. Visualization of large graphs is very important because humans are better at pattern recognition in the two-dimensional space. In this paper the main emphasis is on the visualization and clustering of Web graphs but the methods presented here apply generally to other complex networks also. On a related note another method of visualization for the Web has to be mentioned. This is based on Kohonen's self-organizing map (SOM) algorithm which is able to automatically categorize a large Internet information space into manageable sub-spaces. However, because of the ever increasing information on the Web, the size of the map has to be increased and thus the visual load of the SOM increases also, making it difficult to clearly recognize local details. Fisheye views and fractal views have been investigated [15] in order to support the visualization of SOM. This paper describes a new approach to hierarchically clustering graphs and the visualization of them. The key idea behind this approach is to use the results of the dimensionality reduction technique multidimensional scaling (MDS) [16] not for only visualization but for clustering too. This is achieved by first constructing a node similarity matrix based on a novel node similarity metric and then applying the dimensionality reduction technique on it. The obtained two-dimensional data points are then used as the input to the traditional single-linkage clustering algorithm, from the results of which a dendrogram and the Visual Assessment of Cluster Tendency (VAT) [17] figures can be generated. The remainder of this paper is as follows. In the next section the definitions needed for the graph clustering problem are presented, then the node similarity matrix is described in Section 3 along with the proposed clustering and visualization algorithms. Section 4 presents the experimental results including an example of visualization and clustering of a small Web graph followed by the conclusions and possible future work.
485
M. Erdélyi et al. Node Similarity-based Graph Clustering and Visualization
2
Definitions
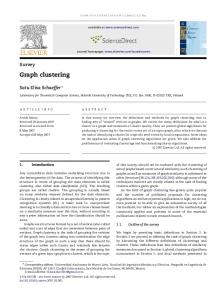
A graph G = (V,E) is a set V of vertices and a set E of edges such that an edge joins a pair of vertices. In this paper G will be always a general undirected or binary graph. The adjacency matrix A of G is a matrix with rows and columns labeled by graph vertices, with a 1 or 0 in position (vi,vj) according to whether vi and vj are neighbours or not. For an undirected graph, the adjacency matrix is symmetric. If a graph G is a large graph it is important to note that its adjacency matrix A can be characterized by high dimensionality and sparsity. The incidence matrix R of G is a matrix defined as R=(rij)|E|x|V| such that rij equals to 1 or 0 whether node vj is incident with edge ei or not. An example graph and its matrices A and R are shown in Fig. 1. R= A= 0 1 1 1 0 0 0
1 0 1 1 0 0 0
1 1 0 1 0 0 0
1 1 1 0 0 1 0
0 0 0 0 0 1 1
0 0 0 1 1 0 1
0 0 0 0 1 1 0
1 1 1 0 0 0 0 0 0 0
1 0 0 1 1 0 0 0 0 0
0 1 0 1 0 1 0 0 0 0
0 0 1 0 1 1 1 0 0 0
0 0 0 0 0 0 0 1 1 0
0 0 0 0 0 0 1 1 0 1
0 0 0 0 0 0 0 0 1 1
Figure 1 An example of a simple graph and its adjacency and incidence matrices
As the basis of the later described similarity measure a so-called node vector has to be defined. The node vectors are represented by the columns of R, thus they simply define to which edges a node belongs. In other words, the column space of R represents nodes and each row of R characterizes an edge. Note that node vectors of an undirected graph are binary vectors since they are derived from the adjacency matrix of the graph. The k-clique of an undirected graph G is a complete subgraph of G with k number of vertices.
486
Magyar Kutatók 7. Nemzetközi Szimpóziuma 7th International Symposium of Hungarian Researchers on Computational Intelligence
3 3.1
Clustering and Visualization Algorithms Node Similarity Matrix
For the purpose of clustering a graph, a node metric has to be defined which quantifies the abstract features of the nodes, and then clustering can then be done by assigning the nodes to a group according to their metric values. In this paper a node structural metric has been chosen 14 making use of the number of shared edges. The similarity degree of two nodes is partly determined by the number of shared edges between them. The more shared edges two nodes have, the more similar they are, and conversely, the more edges they do not share, the less similar they are. In order to quantify these features a good choice is the Jaccard coefficient among the other most used measures in the literature such as the Euclidean distance, the Minkowsky distance and the dot product. The Jaccard coefficient is a good choice because it is able to measure the degree of overlap, which is defined as
(1) where a and b are binary vectors. For example, the numerator in the above equation denotes the number of common attributes i (i.e., edge) of a and b. According to the above definition (1) the similarity degree of two nodes are calculated using their node vectors defined in Section 2. Substituting a, b with the node vectors in the incidence matrix R yields the following equation:
(2) where i and j is from the set {1, 2, ..., |V|}, and ei (ej) denotes the ith (jth) canonical vector of dimension e, i.e., e = (1, 1, …, 1)T. Note that the more similar two nodes, the less links that connect them. The degree of similarity of two nodes will reach its maximum, i.e., 1, when the two nodes are connecting a sole edge. The problem with using this metric alone is that the similarities of all pairs of nonneighbour nodes are zero, which is inadequate in real applications. For example, if a Web page represented by node v1 links to another one represented by node v2, which in turn links to node v3, then v1 should be somewhat related to v3. To solve this problem, a transitive similarity has to be used. Thus sim(r1, r3) becomes sim(r1, r2)*sim(r2, r3) assuming that an existing path between v1 and v3 is (v1, v2) and (v2, v3).
487
M. Erdélyi et al. Node Similarity-based Graph Clustering and Visualization
The shortest paths between non-neighbour nodes, that is, the paths which have the fewest edges can be found by the well-known Dijkstra or Floyd’s algorithm. The products of sequentially multiplying similarity values of node pairs of the resulting paths can then be calculated. Finally, the minimum value among those products is chosen as the degree of similarity between two non-neighbour nodes. Thus the node similarity matrix is of the following form: S = [sim(ri, rj)] |V|x|V| . The symmetirc node similarity matrix of the example graph in Fig. 1 is shown below. S= 1.000 0.200 0.200 0.167 0.007 0.028 0.007
3.2
0.200 1.000 0.200 0.167 0.007 0.028 0.007
0.200 0.200 1.000 0.167 0.007 0.028 0.007
0.167 0.167 0.167 1.000 0.042 0.167 0.042
0.007 0.007 0.007 0.042 1.000 0.250 0.333
0.028 0.028 0.028 0.167 0.250 1.000 0.250
0.007 0.007 0.007 0.042 0.333 0.250 1.000
Visualization of the Graph with Dimensionality Reduction
Let X = {x1, x2, …, xN} be a set of the observed data, denote xi the i-th observation. Each data object is characterized by D dimension, so xi;j yields the jth (j = 1, 2, .., D) attribute of the i-th (i = 1, 2, …, N) data object. The goal of dimensionality reduction is to map a set of observations from a high-dimensional space (D) into a low-dimensional space (d, d