A noise-robust, signal-to-noise ratio (SNR)-weighted correlogram- based pitch estimation algorithm (PEA) in which a bank of comb filters operates in each of the ...
NOISE-ROBUST F0 ESTIMATION USING SNR-WEIGHTED SUMMARY CORRELOGRAMS FROM MULTI-BAND COMB FILTERS Lee Ngee Tan and Abeer Alwan Department of Electrical Engineering, University of California, Los Angeles {tleengee, alwan}@ee.ucla.edu ABSTRACT A noise-robust, signal-to-noise ratio (SNR)-weighted correlogrambased pitch estimation algorithm (PEA) in which a bank of comb filters operates in each of the low, mid, and high frequency bands is proposed. Correlograms are obtained by applying autocorrelations directly on the low-freq filterbank (FBK) output, and the output envelopes of all 3 FBKs. An SNR-weighting scheme is used for channel selection to yield a summary correlogram for each FBK. These summary correlograms are averaged to obtain an overall summary correlogram, which is time-smoothed before peak extraction is performed. The final pitch contour is obtained via dynamic programming. The proposed PEA is evaluated on the Keele corpus with additive white or babble noises. In comparison with widely-used PEAs, the proposed PEA has the lowest overall gross pitch error (GPE), especially in low SNR cases. Index Terms— Pitch estimation, correlogram, multi-band, comb filtering, noise-robustness 1. INTRODUCTION Fundamental frequency (F0) or pitch information of voiced speech is required for many speech applications. Although F0 estimation is a well-researched topic, accurate F0 estimation in noise still poses a challenge. Pitch estimation algorithms (PEAs) can be broadly classified into three categories: 1) time-domain, 2) frequency-domain, and 3) time-frequency-domain. Time-domain PEAs directly exploit a signal’s temporal periodicity, which includes zero-crossing rate, average magnitude difference function (AMDF), and autocorrelationbased methods [1–3]. Frequency-domain PEAs estimate F0 using the signal’s short-time spectral harmonicity [4, 5]. Time-frequency domain PEAs typically separate a signal into various frequency bands, and then apply time-domain processing in each band. The auditory-model correlogram-based PEA is a popular time-frequency domain method inspired by Licklider’s duplex theory of pitch perception [6]. The signal is first decomposed into multiple frequency channels by an auditory filterbank to model the cochlear frequency analysis function, for which the gammatone auditory filters [7] are widely used [8–11]. Autocorrelation is then applied directly on every channel’s output [10] or on its envelope. The latter is generally done on mid and high frequency channels (with center frequencies > 1 kHz) [8, 9], whose wide bandwidths allow the capturing of multiple harmonics, resulting in signal envelopes that oscillate at F0 (beats). Together, these multi-channel autocorrelations form the correlogram, from which single, or possibly multiple F0 candidates are derived. Correlogram-based perceptual PEAs can yield estimates close to human’s perceived pitch for signals with a missing Work supported in part by NSF and DARPA
978-1-4577-0539-7/11/$26.00 ©2011 IEEE
4464
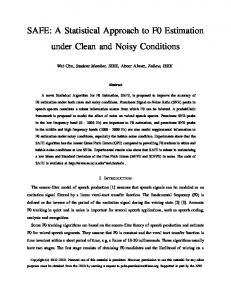
fundamental, inharmonic complexes and noise tones [12]. Being a multi-band approach, correlogram-based PEAs have the potential to be noise-robust, especially in the presence of colored noise. Signal processing schemes employing comb filters have also been proposed for F0 estimation, especially in the presence of noise and harmonic disturbances. A spectral comb analysis technique [5] involving cross-correlation between the spectrum and spectral comb function with teeth of decreasing amplitude, and variable teeth intervals, gives more accurate F0 estimates than a cepstrum-based PEA [13]. An adaptive comb filter was formulated in [14] for pitch estimation and harmonic enhancement in additive white noise. In the presence of overlapping periodic signals, an F0-tuned comb filter has been successfully applied to notch or enhance one of the sources, before performing F0 estimation on individual signals [15]. Motivated by the information richness present in the correlogram representation, and the harmonic enhancement/suppression capability of comb filters, the multi-band comb FBK correlogrambased PEA is proposed in this paper. Details on the proposed algorithm can be found in Section 2. Section 3 describes the performance evaluation criteria and setup, while Section 4 presents the results of the proposed method in comparison to other PEAs. The findings are summarized in Section 5. 2. PROPOSED METHOD The block diagram in Fig. 1 summarizes the proposed PEA. 8 kHz Speech 8192-pt FFT Low-freq comb FBK (0 - 1 kHz)
Mid-freq comb FBK (1 - 2 kHz)
High-freq comb FBK (2 - 3 kHz)
Compute SNR (based on inter-harmonic noise) and perform IFFT on selected channels Envelope extraction Compute SNR-weighted summary correlograms sRev, high sR ev, low sRev, mid sRl ow Compute smoothed overall summary correlogram sRsmooth Peak-extraction and dynamic programming F0 contour
Fig. 1. Block diagram of proposed pitch estimation algorithm. Multi-channel outputs are indicated by bold arrows.
ICASSP 2011
comblow,k( f ) 500
1000
1500
2000
1000
1500
2000
1000
1500 2000 2500 Frequency, f (Hz)
140 120 100 80 60 40 20
3000
3500
4000
0
0.5
1
1
1.5
2
0
0.5 Freq, f (kHz) a)
1
1
1.5 Freq, f (kHz) b)
2
ev_low
0.4 0.2 0
sR
30 20
20 40 60 80 100 120 140 160
10
0.4 0.2 0
ev_high
20 40 60 80 100 120 140 160
low
sR
0.4 0.2 0
20 40 60 80 100 120 140 160 Lag, τ a)
20 40 60 80 100 120 140 160 Lag, τ b)
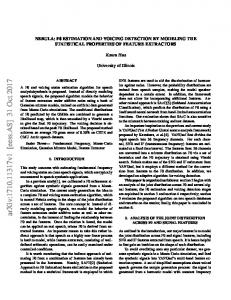
Fig. 4. Low-freq FBK correlogram and summary correlograms of a babble-corrupted speech frame at 5 dB SNR with a period of τ = 80. a) Low-freq FBK correlogram (top) and its summary correlogram (bottom), and b) summary correlograms for low-freq (top), mid-freq (middle), and high-freq FBK envelopes (bottom). 140 120 100 80 60 40 20
gammatone
where X(f ) is an 8192-pt discrete Fourier transform (DFT) coefficient of an input frame sampled at 8 kHz. SNRs for mid and high-freq FBK channels are computed using the same scheme. The mean SNR of the kth channel is computed over the 3 FBKs, SNRlow (k)+SNRmid (k)+SNRhigh (k) . Peaks in i.e. SN R(k) = 3 SN R(k) with values > 1 are identified, and only comb-filtered DFTs, X(f ) comb[freq band] (f ) of the corresponding channels in the 3 FBKs are reverted back to their time-domain representations for further processing. The new indices of these selected channels are denoted by k� in subsequent text. The number of selected channels per FBK is found to be ≈ 30 on average. An energy-normalized correlogram, Rlow,k� is obtained by computing the autocorrelation of selected channels in the low-freq FBK, as shown in Eq. (3).
4000 (f)
140 120 100 80 60 40 20
sR
(2)
3500 high,k
500
sR
|X(f ) comblow,k (f )|2
3000
0.2 0.1 0 −0.1 20 40 60 80 100 120 140 160
0.2 0.1 0 −0.1
sRall
f
|X(f ) noise comblow,k (f )|2
2500
Fig. 3. Magnitude spectra of a babble-corrupted voiced speech frame at 5 dB SNR, after multi-channel comb filtering (top panels), and prior to filtering (bottom panels) for (a) low-freq and (b) mid-freq FBKs.
Channel index
�
f
4000 (f)
Fig. 2. A comb FBK channel (bold solid line) and its corresponding noise-capturing filter (thin solid line) with an F0 of 250 Hz: low-freq FBK channel (top), mid-freq FBK channel (middle), and high-freq FBK channel (bottom). Note that the comb filters are symmetric about 0 Hz, but only the positive frequency portion is drawn here.
On a 30 ms frame-by-frame basis, SNR for the kth channel in lowfreq FBK, SN Rlow (k) is computed using: �
3500
comb
20 40 60 80 100 120 140 160
SN Rlow (k) =
3000
mid,k
500
0.5 0 −0.5
2.2. Multi-band SNR-weighted Summary Correlograms
2500
comb
ev_mid
where τk = τmax , τmax −1, ..., τmin . τmax = fs / min F0, τmin = fs / max F0, and fs is the sampling freq. The corresponding comb filter for capturing noise power in-between harmonics is defined as noise combk (f ) = 1 − combk (f ). For an F0 search range of 50 400 Hz, and fs of 8 kHz, τmin is 20, and τmax is 160, resulting in a total of K = 141 comb filter channels in each FBK. An example of the comb filter channel with an F0, comb f0,k = 250 Hz (correkHz ) and its noise-capturing filter each FBK, are sponding to fsτ=8=32 k illustrated in Fig. 2. The comb filter in each FBK is designed such that its lower cut-off freq is at the null just prior to the band’s lower freq limit; while its upper cut-off freq is at the null just after the band’s upper freq limit. Fig. 3 plots the magnitude spectra of the low and mid-freq FBKs, post and prior to multi-channel comb filtering of a G.712-filtered [16] voiced speech frame corrupted with babble noise at 5 dB SNR. Lower spectral energies are denoted by darker pixels and higher channel indices correspond to comb filters with higher F0s. Each channel captures a different set of harmonics that are multiples of its comb f0,k , and suppresses spectral energies at odd 0.5 multiples of it. For example, the 80th channel in Fig. 3a (boxed) captures harmonics at 0.2, 0.3, 0.4 and 0.5 kHz, and attenuates in-between interferences. This noise-suppression scheme helps to generate a more periodic envelope signal when noise straddles the signal’s harmonics, resulting in a more prominent autocorrelation peak at the true F0 for particular channels.
1 0.5 0 0 1 0.5 0 0 1 0.5 0 0
sR
(1)
Channel index
combk (f ) = 0.5 + 0.5 cos(2πf τk )
Channel index
The front-end comprise three FBKs. The low-frequency (freq) comb FBK covers 0 to 1 kHz, the mid-freq FBK covers 1 to 2 kHz, while the high-freq FBK covers 2 to 3 kHz. In each FBK, there are multiple channels of comb filters: one channel for each autocorrelation lag, τ within a possible F0 range (50-400 Hz). The comb filter in the kth channel is implemented in the freq (f ) domain using a raised-cosine function shown in Eq. (1).
Magnitude
2.1. Multi-band Comb Filterbanks
20 40 60 80 100 120 140 160 Lag, τ a)
20 40 60 80 100 120 140 160 Lag, τ b)
(3)
Fig. 5. a) Gammatone FBK correlogram and b) summary correlogram obtained from gammatone FBK (top), and overall summary correlogram obtained from multi-band comb FBKs (bottom).
xlow,k� is the time-domain signal from the k� th channel in low-freq comb FBK; while N = 240 is the total number of samples in a 30 ms frame. Autocorrelation is also applied to the mean-normalized envelopes of xlow,k� , xmid,k� , and xhigh,k� . The signal envelope is extracted by taking the squared magnitude of its analytic signal
(via the Hilbert transform). Each envelope has its mean subtracted before applying autocorrelation. From these, the low-freq FBK envelope correlogram Rev low,k� , mid-freq FBK envelope correlogram Rev mid,k� , and high-freq FBK envelope correlogram Rev high,k� are obtained. An SNR-weighted summary correlogram, sR∗ (τ ) is
Rlow,k� (τ ) =
�N −τ m=1
xlow,k� (m)xlow,k� (m+τ ) �N 2 � (m) m=1 x low,k
4465
then computed by combining the channels in each correlogram using an SNR-weighting function, wSNR (k� ): �
)−1 wSNR (k� ) = � SNR(k � k� [SNR(k )−1] � R∗,k� (τ )wSNR (k� ) sR∗ (τ ) =
(4) (5)
k�
where ∗ represents “low”, “ev low”, “ev mid”, or “ev high”. Finally, the overall multi-band summary correlogram, sRall (τ ) is obtained by averaging these 4 sR∗ (τ )s. Fig. 4 displays the lowfreq FBK correlogram, and all sR∗ (τ )s of a G.712-filtered voiced speech frame corrupted with additive babble noise at 5 dB SNR. For comparison, an energy-normalized correlogram obtained using 141 gammatone filters (with center frequencies equally distributed on the equivalent rectangular bandwidth (ERB) scale from 50 Hz to 4 kHz), and its summary correlogram sRgammatone for the same speech frame, is plotted in Fig. 5, together with sRall obtained from averaging the 4 sR∗ (τ )s in Fig. 4. The comb FBK-generated correlogram does not have the usual dendritic structure found in that generated by gammatone filters, because the comb filters used are not narrowband like the gammatone filters. In Fig. 5, sRall has a more prominent peak at the true periodicity of τ = 80 than sRgammatone . The peak prominence at τ = 80 in sRall is mainly contributed by the summary correlograms of the envelopes. Through this example, the advantages of using comb FBKs, and including summary correlograms of signal envelopes in separate freq bands are highlighted. 2.3. Post-processing A first-order exponential smoothing in Eq. (6) is used to yield a time-smoothed overall summary correlogram sRsmooth,n , where n is the frame index. sRsmooth,n (τ ) = 0.5 sRall,n (τ ) + 0.5 sRsmooth,n−1 (τ ) (6) F0 candidates corresponding to the 10 highest peaks with magnitudes >0 in sRsmooth,n are passed into a simple dynamic programming algorithm to obtain the final F0 contour. A node’s local score is defined by the candidate’s peak magnitude in sRsmooth,n ; while the min(F0 ,F0curr ) , where F0prev , and transition score is defined by: max(F0prev prev ,F0curr ) F0curr are the previous and current nodes’ F0 values, respectively. 3. EXPERIMENTS 3.1. Evaluation Database and Performance Measure Performance evaluation of the proposed pitch estimator is conducted with adult speech from 5 males and 5 females in the Keele database [17]. This dataset consists of a phonetically balanced story: ”The North Wind”. F0s in the reference files, (precalculated from the larynograph signals recorded simultaneously,) are taken as the ground truth. To generate noisy speech for assessing noiserobustness, the original clean speech is first down-sampled to 8 kHz. Then, white and babble noises from the NOISEX92 corpus [18] (down-sampled to 8 kHz) are added using the Filtering and Noiseadding Tool (FaNT) at SNRs from 20 to 0 dB (with options “-d -m snr 4khz”). A noisy testset with narrowband telephone speech characteristics is also generated using FaNT by applying the G.712 filter (with “-f g712” and default SNR computation options). The G.712 filter has a flat bandpass response between approximately 300 to 3400 Hz. Since spectral harmonics below 300 Hz would be attenuated, the noisy narrowband telephone speech would be a more challenging corpus than its full-band counterpart. Gross Pitch Error (GPE) [19] is the measure used for performance evaluation. It is defined as the percentage of reference voiced
4466
frames that has an F0 estimation error. An error for frame n occurs when the F0 estimate, F0est (n), deviates from the reference F0 by more than 20%. 3.2. PEAs for Performance Comparison GPEs of 3 other PEAs are also evaluated for benchmarking purposes. The 3 PEAs include: Get F0 [2] used in Wavesurfer [20], YIN [3], and Rouat’s auditory model-based PEA [8]. The gammatone FBK in [8] is implemented using Slaney’s Matlab Auditory Toolbox [21]. To ensure there is an F0 estimate for almost every voiced frame, the voicing bias parameter in Get F0 is set to 1, while the peak detection thresholds, S and Spe in Rouat’s PEA are lowered to 0. For all PEAs, a frame size of 30 ms, and F0 range from 50 to 400 Hz are used. The results in Section 4 for Get F0 are obtained with its “lag-weight” parameter set to 0.7 (up from default value of 0.3); while those for YIN with its lowpass cutoff freq set to 1 kHz. These parameters yield the lowest GPE (averaged over all test data) for their PEAs. To analyze the factors contributing to the performance of the proposed PEA, variants of our PEA are also evaluated. The variants are: 1) MB Rect - a single-channel rectangular filter with a bandwidth of 1 kHz is used in each freq band, instead of a comb FBK; 2) NoEvLow - the summary correlogram of low-freq FBK envelopes, sRev low is omitted in the calculation of sRall ; and 3) NoSNRwt - each summary correlogram sR∗ (τ ), is obtained by averaging autocorrelations from all 141 channels in each FBK (i.e. no SNRweighted channel-selection). These factors are selected because the usage of comb FBKs, low-freq FBK envelopes, and SNR-weighting are the main design novelties of this PEA. 4. RESULTS AND DISCUSSION Table 1 tabulates the PEAs’ GPEs, averaged over all speakers. The average GPEs of G.712 filtered data are higher than those of the full-band data for all cases. In both clean and noisy conditions, the proposed PEA or its variants has the lowest GPE out of the PEAs evaluated. NoEvLow has higher GPEs than the proposed PEA for all cases, which is more significant for G.712-filtered than full-band data. This is because the inclusion of sRev low (summary correlogram of low-freq FBK envelopes) in the proposed PEA helps in reducing F0 doubling and tripling errors (which are more prevalent in the G.712 data,) caused by missing 1st and/or 2nd harmonics in low-pitched signals after the G.712 filtering. We also observed that MB Rect and NoSNRwt have lower GPEs compared to the proposed algorithm for high SNR cases. MB Rect performs better at high SNRs than its comb FBK variants due to the finite freq resolution of comb f0,k , which results in a higher degree of attenuation of the target speech (that has an F0 that differ from f0,comb in the FBK) than noise when SNRs are high. The proposed PEA performs worse than NoSNRwt at high SNRs because it has more F0 doubling and tripling errors for low-pitched speakers. However, the proposed PEA is computationally more efficient, and more noise-robust than NoSNRwt, with an improvement of >3% for white noise corrupted G.712-filtered data at 0 dB. In the presence of a very dominant 2nd/3nd harmonic component (more prevalent for low F0 cases), channel selection with the proposed SNR-weighted scheme is heavily biased towards channels in the low-freq FBK that capture this component, resulting in over-estimations of F0. Hence, the proposed PEA is likely to suffer in the presence of a strong tonal interference. Similarly, for G.712-filtered data, Get F0 has higher GPEs under clean condition than at 20 and (sometimes) 10 dB. The increment of the lag-weight parameter which biases Get F0 towards higher F0
estimates, coupled with dominant 2nd/3rd harmonic in low-pitched signals, led to a larger number of F0 doubling/tripling errors for lowpitched speakers. We also found that using time-smoothed overall summary correlogram sRsmooth , improves GPEs by ≈ 2% on the average for 0 dB cases.
[2] D. Talkin, “Robust algorithm for pitch tracking,” Speech Coding and Synthesis, pp. 497–518, 1995.
Table 1. Average GPEs (%) of various PEAs using the downsampled (8 kHz) Keele corpus corrupted with additive white (WN) and babble (BN) noises. The lowest GPE in each column is bold-faced. SNR (dB) Clean 20 10 5 0 8 kHz Keele with WN added Get F0 [20] 2.58 2.63 3.56 5.48 12.06 YIN [3] 2.68 2.77 3.45 5.60 11.79 Rouat et al. [8] 2.56 3.33 6.46 11.20 20.38 MB Rect 2.34 2.65 3.25 5.23 10.93 NoEvLow 2.88 2.66 3.07 3.77 7.02 NoSNRwt 2.24 2.26 2.81 3.97 7.22 Proposed 2.65 2.62 2.73 3.60 6.28 8 kHz Keele with BN added Get F0 2.90 6.90 12.81 26.28 YIN 3.14 8.69 18.58 36.74 Rouat et al. 3.69 9.64 18.19 32.83 MB Rect 2.53 5.37 11.00 24.26 NoEvLow 3.16 5.48 10.76 23.38 NoSNRwt 2.36 4.83 9.73 22.23 Proposed 2.63 4.81 9.42 21.87 G.712-filtered Keele with WN added Get F0 6.92 6.45 6.33 8.44 14.27 YIN 6.95 7.3 9.15 12.85 21.75 Rouat et al. 6.25 8.38 14.46 21.53 32.03 MB Rect 4.76 5.04 6.18 9.12 16.29 NoEvLow 7.61 7.17 7.82 9.47 14.20 NoSNRwt 4.74 5.14 5.47 7.55 12.90 Proposed 5.88 5.40 4.97 6.10 9.22 G.712-filtered Keele with BN added Get F0 6.59 10.97 17.1 28.65 YIN 8.37 16.23 27.55 44.49 Rouat et al. 8.97 18.24 28.86 42.82 MB Rect 5.14 9.36 16.31 29.79 NoEvLow 7.61 10.76 15.68 27.98 NoSNRwt 5.35 8.42 14.89 26.23 Proposed 5.90 8.26 12.75 24.97
[4] D. J. Hermes, “Measurement of pitch by subharmonic summation,” JASA, vol. 83, no. 1, pp. 257–264, 1988.
[3] A. Cheveign´e and H. Kawahara, “YIN, a fundamental frequency estimator for speech and music,” J. of the Acoustical Society of America (JASA), vol. 111, pp. 1917–1930, 2002.
[5] P. Martin, “Comparison of pitch detection by cepstrum and spectral comb analysis,” in Proc. IEEE Int. Conf. on Acoustics, Speech, and Signal Processing (ICASSP), 1982, pp. 180–183. [6] J. C. R. Licklider, “A duplex theory of pitch perception,” Experientia, vol. 7, pp. 128–134, 1951. [7] R. D. Patterson, K. Robinson, J. Holdsworth, D. McKeown, C. Zhang, and M. Allerhand, “Complex sounds and auditory images,” Auditory Physiology and Perception, vol. 83, pp. 429–446, 1992. [8] J. Rouat, Y. Liu, and D. Morissette, “A pitch determination and voiced/unvoiced decision algorithm for noisy speech,” Speech Comm., vol. 21, pp. 191–207, 1997. [9] M. Wu, D. Wang, and G. Brown, “A multipitch tracking algorithm for noisy speech,” TSAP, vol. 11, pp. 229–241, 2003. [10] N. Ma, P. Green, J. Barker, and A. Coy, “Exploiting correlogram structure for robust speech recognition with multiple speech sources,” Speech Comm., vol. 49, pp. 874–891, 2007. [11] X. Zhang, W. Liu, Li P., and B. Xu, “Multipitch detection based on weighted summary correlogram,” in Int. Symp. on Chinese Spoken Lang. Proc., 2008, pp. 1 – 4. [12] R. Meddis and M. J. Hewitt, “Virtual pitch and phase sensitivity of a computer model of the auditory periphery. I: Pitch identification.,” JASA, vol. 89, pp. 2866–2882, 1991. [13] A. M. Noll, “Cepstrum pitch determination,” JASA, vol. 41, no. 2, pp. 293–309, 1967. [14] A. Nehorai and B. Porat, “Adaptive comb filtering for harmonic signal enhancement,” ICASSP, vol. 10, pp. 335–338, 1985. [15] A. Cheveign´e, “Separation of concurrent harmonic sounds: Fundamental frequency estimation and a time-domain cancellation model of auditory processing,” JASA, vol. 93, pp. 3271– 3290, 1993. [16] ITU-T recommendation G.712, “Transmission performance characteristics of pulse code modulation channels,” 1996. [17] F. Plante, G. Meyer, and W. A. Ainsworth, “A pitch extraction reference database,” in European Conf. on Speech Comm. and Tech., 1995, pp. 837–840.
5. CONCLUSION An SNR-weighted correlogram-based PEA using multi-band comb FBKs is proposed. The proposed PEA is effective in enhancing the accuracy of F0 estimation in the presence of noise. The inclusion of low-freq FBK envelope information improves performance when dealing with signals with missing lower harmonics (G.712), while the usage of comb FBKs, SNR-weighted and time-smoothed summary correlogram is beneficial at low SNRs. Together, these novel processing techniques enhance noise-robustness.
[18] A. Varga and H. Steeneken, “Assessment for automatic speech recognition: II. NOISEX-92: A database and an experiment to study the effect of additive noise on speech recognition systems,” Speech Communication, vol. 12, pp. 247–251, 1993. [19] L. Rabiner, M. Cheng, A. Rosenberg, and C. McGonegal, “A comparative performance study of several pitch detection algorithms,” IEEE Trans. on Acoustic, Speech, and Signal. Proc., vol. 24, pp. 399–418, 1976.
6. REFERENCES
[20] K. Sj¨olander and J. Beskow, “WaveSurfer - An Open Source Speech Tool,” in Proc. of Int. Conf. on Spoken Lang. Proc., 2000, pp. 464–467.
[1] T. Shimamura and H. Kobayashi, “Weighted autocorrelation for pitch extraction of noisy speech,” IEEE Trans. on Speech and Audio Processing (TSAP), vol. 9, pp. 727–730, 2001.
[21] M. Slaney, “Auditory toolbox, version 2,” Tech. Rep. 1998101, Interval Research Corporation, 1998.
4467