University of Nebraska - Lincoln
DigitalCommons@University of Nebraska - Lincoln Papers in Natural Resources
Natural Resources, School of
1-1-2001
NON-DESTRUCTIVE AND REMOTE SENSING TECHNIQUES FOR ESTIMATION OF VEGETATION STATUS Anatoly A. Gitelson University of Nebraska at Lincoln,
[email protected]
M. N. Merzlyak Moscow State University
Y. Zur University of Negev
R. Stark University of Negev
U. Gritz University of Negev
Follow this and additional works at: http://digitalcommons.unl.edu/natrespapers Part of the Natural Resources and Conservation Commons Gitelson, Anatoly A.; Merzlyak, M. N.; Zur, Y.; Stark, R.; and Gritz, U., "NON-DESTRUCTIVE AND REMOTE SENSING TECHNIQUES FOR ESTIMATION OF VEGETATION STATUS" (2001). Papers in Natural Resources. Paper 273. http://digitalcommons.unl.edu/natrespapers/273
This Article is brought to you for free and open access by the Natural Resources, School of at DigitalCommons@University of Nebraska - Lincoln. It has been accepted for inclusion in Papers in Natural Resources by an authorized administrator of DigitalCommons@University of Nebraska - Lincoln.
Gitelson, Merzlyak, Zur, Stark & Gritz in the Proceedings of the 3rd European Conference on Precision Agriculture, Montpelier, France, 2001. Grenier & Blackmore, editors.
NON-DESTRUCTIVE AND REMOTE SENSING TECHNIQUES FOR ESTIMATION OF VEGETATION STATUS A. A. GITELSON School of Natural Resource Sciences, University of Nebraska-Lincoln, 113 Nebraska Hall, Lincoln, NE 68588-0517, USA E-mail:
[email protected] M. N. MERZLYAK Department of Cell Physiology & Immunology, Faculty of Biology, Moscow State University, Moscow, Russia Y. ZUR, R. STARK, U. GRITZ Department of Geological and Environmental Sciences, Ben-Gurion, University of the Negev, Israel
ABSTRACT The goal of this work is to develop non-destructive techniques that can conveniently, rapidly and accurately assess crop physiological status and objectively evaluate plant responses to environmental factors, both natural and anthropogenic. High spectral resolution reflectance and absorption spectra of different and unrelated plant species were analyzed to determine spectral variability and information content in the visible and near-infrared spectrum at leaf and canopy levels. Techniques were developed to quantitatively retrieve chlorophyll, carotenoid and anthocyanin content from reflectance in a wide range of pigment content and composition. Techniques for vegetation fraction retrieval those based on channels in visible range of the spectrum were developed and validated. Despite the fact that the reflectance contrast among the visible channels is much smaller than between the visible and near infrared, the sensitivity to moderate to high values of vegetation fraction is much higher than for NDVI and the error in vegetation fraction prediction did not exceed 10 per cent. Leaf pigment content estimation Optical properties of the leaves of several plant species in a wide range of chlorophyll (Chl), carotenoid (Car) and anthocyanin (Anth) contents have been investigated (Gitelson and Merzlyak, 1997; Zur et al., 2000; Gitelson et al., 2001a) in order to develop techniques for non-destructive estimation of pigment content and composition. It was found that the reflectance in spectral band near 700 nm was sensitive to Chl content only, whereas reflectance around 550 nm was sensitive to both Chl and Anth content, and near 500-520 nm was sensitive to both Car and Chl content. The technique was developed to remove Chl effect from reflectance near 550 nm and 500-520 nm. Algorithms for Chl, Car and Anth contents estimating were devised and, finally, validated by few independent data sets.
205
Gitelson, Merzlyak, Zur, Stark & Gritz in the Proceedings of the 3rd European Conference on Precision Agriculture, Montpelier, France, 2001. Grenier & Blackmore, editors.
0.14
(R700)-1 = 1.68*10-3Chl+ 0.0249
0.12
R2 = 0.9512, STD = 3.7 nmol/cm2
(R700)-1
0.1 0.08 0.06 0.04
Anth-free
0.02
Anth 2.9 to 100 nmol/cm2
0 0
10
20
30
40
Chlorophyll content, nmol/cm2
50
60
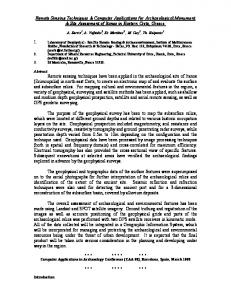
FIGURE 1. Inverse reflectance at 700 nm vs. Chl content for Anth-containing and Anth-free leaves. Chlorophylls. Reflectance in spectral bands near 550 nm and 700 nm was found to be sensitive to Chl content (Gitelson and Merzlyak, 1994; 1996; Blackmer et al., 1994; Lichtenthaler et al., 1996; Scheppers et al., 1996; Gamon and Surfus, 1999). For many unrelated plant species, inverse reflectance (R550)-1 and (R700)-1 was a precise measure of Chl, and the reflectance ratios in near infrared range (RNIR) to those in the green (R550) and red edge (R700) regions, RNIR/R550 and RNIR/R700, were linearly proportional to Chl content (determination coefficient r2 = 0.95; root-mean square variation < 4 nmol/cm2) for Chl ranged from 3 to 75 nmol/cm2 (Gitelson and Merzlyak, 1997). In this study, we investigated the sensitivity of these indices to Anth content. Absorption by Anth in vivo at 550 nm (Gitelson et al., 2001a) prevents to use the index RNIR/R550 for Chl estimation in Anth-containing leaves. Nevertheless, it has been found that reciprocal reflectance at 700 nm (R700)-1 remained linearly proportional to Chl content in leaves with Anth content ranged from 0.3 to 100 nmol/cm2 and Car content from 3 to 18 nmol/cm2 (Fig. 1). Thus, for Chl assessment in Anthfree leaves, we suggest using reflectance ratios RNIR/R550 and RNIR/R700. Inverse reflectance (R700)-1 or ratio RNIR/R700 can be employed for Chl estimation in leaves with a wide range of Chl, Car, and Anth variation. Carotenoids. Car and Chl have overlapping absorption bands in the blue range of the spectrum, making it difficult to distinguish between them by remote sensing techniques (Merzlyak et al., 1999). To find spectral range that is sensitive to Car content, absorption and reflectance spectra of leaves in a wide range of Car (1 to 18 nmol/cm2) and Chl (0.1 to 75 nmol/cm2) content were studied. The standard deviation (STD) of absorbance spectra, normalized to Chl absorption maximum at 670 nm, peaks at 520 nm; this peak is attributed to Car absorption (Zur et al., 2000). The determination coefficient of the relationship ‘Reflectance vs. Car’ also shows prominent peak in the range 500-520 nm. The technique was devise to remove Chl effect on reflectance in this spectral region and the index for non-destructive Car estimating was developed. The Carotenoids Reflectance Indices in the forms CRI550 = (R510)-1-(R550)-1 and CRI700 = (R510)-1-(R700)-1 206
Gitelson, Merzlyak, Zur, Stark & Gritz in the Proceedings of the 3rd European Conference on Precision Agriculture, Montpelier, France, 2001. Grenier & Blackmore, editors.
were found to be proportional to Car (r2 = 0.93, an estimation error of Car < 2 nmol/cm2) and almost insensitive to Chl content (Fig. 2). Chlorophyll Content, nmol/cm2 0
10
20
30
40
50
60
0.04
0.04
Carotenoids Reflectance Index
Chlorophyll 0.03
0.03
0.02
0.02
2
Carotenoids, r = 0.94
0.01
0.01
0
0 0
2
4
6
8
10
12
14
Carotenoids Content, nmol/cm
16
18
2
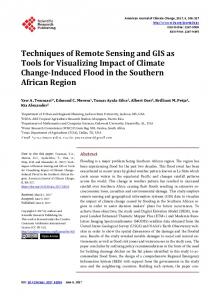
FIGURE 2. Index for carotenoids estimation plotted versus Car and Chl content Anthocyanins. Comparing absorption spectra of anthocyanin-containing and anthocyanin-free leaves with the same chlorophyll content, absorption spectra of anthocyanin in intact leaves were derived. The main spectral feature of anthocyanin absorption in vivo was a peak around 550 nm which magnitude was closely related to anthocyanin content (Fig. 3). A technique was developed to subtract Chl contribution to reflectance in this spectral region and quantitatively non- destructively retrieve Anth content from reflectance in a wide range of pigment content and composition (Gitelson et al., 2001a). Anthocyanin Reflectance Index in the form ARI = (R550)-1-(R700)-1 allowed an accurate estimation of anthocyanin accumulation (STD within 3.9 nmol/cm2), even in minute amounts, in intact stressed and senescing leaves (Fig. 4). Vegetation fraction and density estimation The decreased reflectance in the NIR, occurring at or near the midseason of a growing crop, can be a limiting factor in the use of that spectral region for estimating of vegetation fraction (VF). In order to evaluate the information content inherent in reflectance spectra and devise a technique for remote estimation of vegetation fraction, spectral behavior of reflectance and absorption of a wheat canopy with vegetation fraction ranged from 0 to 100% were studied in visible and near-infrared ranges of the spectrum. The MODIS blue (459-479 nm), green (545565 nm), and red (620-670 nm) channels as well as MERIS red edge channel (695-705 nm) were used in developed Visible Atmospherically Resistant Indices (VARI) VARIgreen = (Rgreen-Rred)/(Rgreen+Rred-Rblue) and VARI700 = (R700-1.7*Rred+0.7*Rblue)/(R700+2.3*Rred-1.3*Rblue) 207
Gitelson, Merzlyak, Zur, Stark & Gritz in the Proceedings of the 3rd European Conference on Precision Agriculture, Montpelier, France, 2001. Grenier & Blackmore, editors.
0.2
60
r2 = 0.91, STD= 5.1 nmol/cm2, n=51
Maple 50
(R550)-1-(R700)-1, (%)-1
Anthocyanin absorption, per cent
2
Anthocyanin = 39.1 nmol/cm
40
22.9 30
9.1 20
6.4 10
0.15
0.1
0.05
2.9 0
0 450
500
550
600
650
Wavelength, nm
FIGURE 3. Anthocyanin absorption retrieved from absorption spectra of leaves with equal Chl content and different Anth content
0
5
10
15
20
25
30
35
40
45
50
Anthocyanin content, nmol/cm2
FIGURE 4. Index for anthocyanin estimation plotted versus anthocyanin content
The indices were found to be minimally sensitive to atmospheric effects allowing estimation of VF with an error of less than 10% in a wide range of atmospheric optical thickness (Gitelson et al., 1999; 2001b). Another technique for vegetation fraction estimation was proposed (Gitelson et al., 2000; Stark et al., 2000). It was found that reflectance of the wheat with 100% vegetation fraction, despite various canopy structures and pigment contents, forms a vegetation line defined by close linear relationships reflectances R700 vs. R550 and R670 vs. R500. The position and orientation of the lines in two-dimensional spectral space were repeatable for four types of wheat during two years of observations. Soils of very different types and wetness form soil lines in the R700 vs. R550 and R670 vs. R500 spectral spaces. The soil lines have also proven to be repeatable over the course of two years of data collection. Two-dimensional spectral space, as defined and constrained by soil and vegetation lines, includes all possible canopy reflectances with VF ranging from 0 to 100%. We suggest using the location of reflectance in these spectral spaces as a quantitative measure of VF. Predicted VF was proportional to measured VF with root-mean square variation of predicted values from measured of less than 10%. For the independent data set (cornfields in Nebraska), excellent correspondence between predicted and actually measured vegetation fraction values was found. Despite the fact that the reflectance contrast among the visible channels is much smaller than between the visible and NIR, the sensitivity of both techniques to moderate to high values of VF was much higher than for NDVI. Suggested techniques will complement the widely used NDVI, ARVI, SAVI, and GARI (Gitelson et al., 1996), which is based on the green and the NIR bands. Therefore, we propose using only the visible range of the spectrum to quantitatively estimate vegetation fraction, and we are interested in applying the algorithms to new satellite technologies including the high spectral and radiometric resolution achieved in the recently launched SeaWiFS, MODIS, ASTER, MISR, and near future space systems such as HYPERION and MERIS.
208
Gitelson, Merzlyak, Zur, Stark & Gritz in the Proceedings of the 3rd European Conference on Precision Agriculture, Montpelier, France, 2001. Grenier & Blackmore, editors.
1
NDVI
Vegetation Indices
0.8
0.6
0.4
0.2
0
(Rgreen-Rred)/(Rgreen+Rred-Rblue)
-0.2
-0.4 0
20
40
60
80
100
Vegetation fraction, per cent FIGURE 5. NDVI and newly developed vegetation index (Rgreen-Rred)/(Rgreen+Rred-Rblue) versus vegetation fraction for wheat canopy REFERENCES Blackmer, T.M., Schepers, J.S. and Varvel, G.E. (1994) Light reflectance compared with other nitrogen stress measurements in corn leaves, Agron. J. 86:934-938. Gamon, J.A., Surfus, J.S. (1999) Assessing leaf pigment content and activity with a reflectometer. New Phytol. 143:105-117. Gitelson, A.A. and Merzlyak, M.N. (1994a) Quantitative estimation of chlorophyll-a using reflectance spectra: Experiments with autumn chestnut and maple leaves. J. Photochem. Photobiol. B: Biol. 22: 247-252. Gitelson, A., Merzlyak, M.N. (1994b) Spectral reflectance changes associated with autumn senescence of Aesculus hippocastanum L. and Acer platanoides L. leaves. Spectral features and relation to chlorophyll estimation. J. Plant Physiol. 143:286-292. Gitelson, A., Merzlyak, M.N. (1996) Signature analysis of leaf reflectance spectra: algorithm development for remote sensing of chlorophyll. J. Plant Physiol., 148:494-500. Gitelson, A., Kaufman, Y.Z., Merzlyak, M. (1996) Use of a green channel in remote sensing of global vegetation from EOS-MODIS. Remote Sens. Environ. 58: 289-298. Gitelson, A., Merzlyak, M.N. (1997) Remote estimation of chlorophyll content in higher plant leaves. Int. J. Remote Sens. 18, 291-298. Gitelson, A.A., Stark, R. Kaufman, Y.Z., Rundquist, D. (1999) A Technique for remote estimation of percent vegetation fraction, In Proc. the International Symposium on Spectral Sensing Research, Systems and Sensors for the New Millennium, Int. Society for Photogrammetry & Remote Sensing, Oct. 31-Nov. 4, 1999, Las Vegas NV, pp.191201.
209
Gitelson, Merzlyak, Zur, Stark & Gritz in the Proceedings of the 3rd European Conference on Precision Agriculture, Montpelier, France, 2001. Grenier & Blackmore, editors.
Gitelson, A., Grits, U., Stark, R., Rundquist, D., Kaufman, Y.Z. (2000) Novel algorithms for remote estimation of vegetation fraction, In Proc. Second Int. Geospatial Information in Agriculture and Forestry Conference, Florida, 10-12 Jan. 2000, Vol. 2, pp. 1-8. Gitelson, A., Merzlyak, M. N., Chivkunova, O. (2001a) Optical properties and nondestructive estimation of anthocyanin content in plant leaves. Photochem. Photobiol. (forthcoming). Gitelson, A.A., Kaufman, Y.Z., Stark, R., Rundquist, D. (2001b) Novel algorithms for remote estimation of vegetation fraction. Submitted to Rem. Sens. Environ. Lichtenthaler, H.K., Gitelson, A.A., Lang, M. (1996) Non-destructive determination of chlorophyll content of leaves of a green and an aurea mutant of tobacco by reflectance measurements, J. Plant Physiol. 148: 483-493. Merzlyak, M.N., Gitelson, A.A., Chivkunova, O.B., Rakitin, V.Y. (1999) Non-destructive optical detection of pigment changes during leaf senescence and fruit ripening, Physiol. Plant. 106: 135-141. Schepers, J.S., Blackmer, T.M., Wilhelm, W.W., Resende, M. (1996) Transmittance and reflectance measurements of corn leaves from plants with different nitrogen and water supply, J. Plant Physiol. 148:523-529. Schepers, J.S., Blackmer, T.M., Francis, D.D. (1998) Chlorophyll meter method for estimating nitrogen content in plant tissue, in Handbook of Reference Methods for Plant Analysis, Y.P. Kalra (ed.), pp. 129-135 Stark, R., Gitelson, A. Grits, U., Rundquist, D., Kaufman, Y.Z. (2000) New technique for remote estimation of vegetation fraction: principles, algorithms and validation. Aspects Appl. Biol. 60: 241-246. Zur, Y., Gitelson, A.A., Chivkunova, O.B., Merzlyak, M.N. (2000) The Spectral contribution of carotenoids to light absorption and reflectance in green leaves. In Proc. Second Int. Geospatial Information in Agriculture and Forestry Conference, Florida, 10-12 Jan. 2000, Vol. 2, pp. 17-23.
210