flush a file's dirty data from the cache to the file server's disk [1]. Non-volatile memory (NVRAM), such .... problem for clients that do not recover quickly, it must be.
Non-Volatile Memory for Fast, Reliable File Systems Mary Baker, Satoshi Asami, Etienne Deprit, John Ousterhout, Margo Seltzer Computer Science Division Electrical Engineering and Computer Sciences University of California, Berkeley, CA 94720
Abstract Given the decreasing cost of non-volatile RAM (NVRAM), by the late 1990’s it will be feasible for most workstations to include a megabyte or more of NVRAM, enabling the design of higher-performance, more reliable systems. We present the trace-driven simulation and analysis of two uses of NVRAM to improve I/O performance in distributed file systems: non-volatile file caches on client workstations to reduce write traffic to file servers, and write buffers for write-optimized file systems to reduce server disk accesses. Our results show that a megabyte of NVRAM on diskless clients reduces the amount of file data written to the server by 40 to 50%. Increasing the amount of NVRAM shows rapidly diminishing returns, and the particular NVRAM block replacement policy makes little difference to write traffic. Closely integrating the NVRAM with the volatile cache provides the best total traffic reduction. At today’s prices, volatile memory provides a better performance improvement per dollar than NVRAM for client caching, but as volatile cache sizes increase and NVRAM becomes cheaper, NVRAM will become cost effective. On the server side, providing a one-half megabyte write-buffer per file system reduces disk accesses by about 20% on most of the measured logstructured file systems (LFS), and by 90% on one heavilyused file system that includes transaction-processing workloads. 1. Introduction Improving I/O performance of future distributed file systems will require improving write performance.
����������������������������������� The work described here was supported in part by the National Science Foundation under grants CCR-8900029 and MIP-8715235, and the National Aeronautics and Space Administration and the Defense Advanced Research Projects Agency under contracts NAG2-591 and DABT63-92-C-0007. This paper appeared in the Proceedings of the Fifth International Conference on Architectural Support for Programming Languages and Operating Systems, October, 1992.
Because large, main-memory file caches more effectively reduce read traffic than write traffic, the write traffic in distributed systems will become increasingly important. A recent study of the Sprite distributed file system [17] shows that for the workload measured, client workstation caches reduce read traffic from applications by 60%, but only reduce the write traffic by 10% [1]. As file caches on both clients and servers continue to grow and satisfy even more read traffic, the proportion of write traffic will increase and could potentially become a bottleneck. The failure of caches to reduce write traffic is not due to insufficient cache size but instead to the need to protect newly-written (dirty) data from machine failures. Dirty data must be written from volatile cache memory to non-volatile storage to guarantee its permanence; thus there is a tradeoff between reducing write traffic and protecting the reliability of dirty data. The longer dirty data is held in the cache, the more likely it is to be absorbed in the cache by being overwritten or deleted, but at the same time it becomes more vulnerable to machine failures such as power outages. For this reason, systems such as UNIX and Sprite limit the amount of time dirty data remains in the cache. It is this eventual write-back that causes most dirty data to be written to the server. In Sprite, for example, data written to a cache on either a client or a file server is written from the cache after about 30 seconds, and seventy percent of the file data transferred from clients to the file server is triggered by this delayed write-back from client caches. Another 15% is forced from the client caches by application fsync calls that immediately and synchronously flush a file’s dirty data from the cache to the file server’s disk [1]. Non-volatile memory (NVRAM), such as RAM with battery backup, offers a possibility for reducing write traffic. By storing dirty data in NVRAM, we can guarantee its permanence without the cost of transferring it from client cache to server cache and from server cache to disk. Until recently, NVRAM was not economically feasible in the general workstation environment. Today, NVRAM is still four to six times more expensive per megabyte than DRAM, but we expect the per-megabyte cost of NVRAM to decrease. Many workstations today include a small amount of RAM with battery backup for the time-of-day
clock. Because these systems already include the overhead of the batteries, incremental additions to the amount of memory included may not be costly. As shown in Table 1, NVRAM is also available in separate memory components (SIMMs) and on boards with triply redundant batteries. While the SIMMs incur the overhead of batteries and failover systems for each component, this overhead on the boards can be amortized over more megabytes of memory. For one-megabyte boards, the boards are 20 - 70% more expensive than SIMMs depending on the bus, but the 16megabyte boards are nearly 60% less expensive than SIMMs and only four times the cost of an equivalent amount of DRAM.
allow dirty data to remain longer in the client cache without loss of reliability, assuming that it is possible to restart a crashed client quickly. Our results show that one megabyte of NVRAM can potentially reduce file write traffic from clients to servers by more than 50%. However, at today’s prices, adding NVRAM to client caches is only cost-effective if the cache already includes nearly sixteen megabytes of volatile memory. Our results also show that the NVRAM’s block replacement policy makes little difference in overall file traffic reduction, but the extent of its integration with the volatile cache is important. In Section 3, we consider using a non-volatile write buffer on the file server to reduce the number of disk accesses. Others have reported 50% performance gains by putting non-volatile caches on traditional UNIX file systems in the NFS environment [15][19]. Our measurements show that some new file systems, without NFS’s requirement for synchronous operations, can still obtain a significant reduction in the number of writes. Sprite’s logstructured file system (LFS) [18] is an example of a writeoptimized file system that amortizes write cost by collecting a large amount of dirty data and writing it contiguously. Currently, fsync requests from clients often force LFS to write to disk before it has accumulated much data. Our analysis shows that using a non-volatile buffer to collect a large amount of data before writing would reduce the number of disk write accesses by 10 to 25% on most file systems, and by as much as 90% on one heavily-used file system.
An uninterruptible power supply (UPS) is an alternative method for providing non-volatile memory, but it is more expensive for small amounts of memory. A UPS with enough power to support a Sparcstation for one to two hours costs a minimum of $800. Another alternative, flash EEPROM, has write access times significantly slower than RAM, can only be written a limited number of times, and is therefore not appropriate for our purposes. In this paper we consider using NVRAM in two different ways to improve write I/O performance in distributed systems: as a non-volatile cache on client workstations and as a write-buffer on file servers. NVRAM’s combination of high performance relative to disks and permanence relative to volatile RAM will make it worthwhile for small caches and write buffers, even without its price dropping to that of volatile RAM [4]. In Section 2, we analyze the effects of the addition of a small amount of NVRAM to the cache on client workstations to reduce write traffic to servers. This non-volatile memory will
In Section 4, we address some of the difficulties in incorporating NVRAM into system designs. For data in non-volatile client caches to be considered as permanent as
���������������������������������������������������������������������������������������������������� ���������������������� ������������������������������������������������ ��������������������� ����������������������������� ��������������������������� Price Minimum � � Component � Speed � Number � � � � � (ns) � lithium � per megabyte � configuration ���������������������� ������������������������������������������������ ����batteries (in ���� ���� ���� ���� ���� ���� ���� ��� �� ���� ���� ���� ���� ���� ���� ���� ���� ���� ���� ���� ���� ���� ��� �� ���� �� ���� ��megabytes) ���� ���� ���� ���� ���� ���� ���� ���� ���� ������������������������������������������������������������������������ �� �� � � � � � � 128K*9 SRAM 120 2 $328 0.5 � � � � � � � � � � � � � � � � � � � � � � � � � � � � � � � � � � � � � � � � � � � � � � � � � � � � � � � � � � � � � � � � � � � � � � � � � � � � � � � � � � � � � � � � � � � � � � � � � � � � � � � � � � � � � � � � � � � � � � � � � � � � � � � � � SRAM ������������ �������������������������85 ��������� ����������2����������� ����������$336 ������������������� ������������32 ��������������� � SIMMs ��� ��1M*1 ������� ���� ���� ���� ���� ���� ���� ���� ���� ��� �� ��512K*8 ���� ���� ���� ���� ���� ���� ��RAM ���� ���� ���� ���� ���� ���� ����� ���� ���� ���� ��70 ���� ���� ���� ��� �� ���� ���� ���� ���� ��1�� ���� ���� ���� ���� ��� �� ���� ���� ���� ���� ��$370 ���� ���� ���� ���� ���� ���� ���� ���� ��� �� ���� ���� ���� ���� ���� ���� ��2�� ���� ���� ���� ���� ���� ���� �� �� �� �� � � PC-AT Bus � � � 70 � 3 $439 1 � Board � PC-AT Bus � � � 70 � 3 $134 16 � � � � � VME Bus 70 � 3 $634 1 � � � � � � VME Bus 70 3 $147 16 ������� � � � � � � � � � � � � � � � � � � � � � � � � � � � � � � � � � � � � � � � � � � � � � � � � � � � � � � � � � � � � � � � � � � � � � � � � � � � � � � � � � � � � � � � � � � � � � � � � � � � � � � � � � � � � � � � � � � � � � � � � � � � � ������������������� ������������������������������������������������ ��������������������� ����������������������������� ���������������� ���� ���� ���� ���� ���� ���� Volatile 1M*9 DRAM 70 0 $33 4 ��������������������������������������������������������������������������������������������������������������������������������������������� � � � � � � � � � � � � �
Table 1: Current NVRAM costs. This table gives the current price of some sample non-volatile memory components from Dallas Semiconductor, some non-volatile memory boards, and a volatile memory component for comparison. The table shows list prices for lots of 5000 or more. The column Number lithium batteries gives the number of batteries on the SIMM or board. Most of the components have at least one extra battery in case the first battery fails. For the SIMMs, the column Minimum configuration gives the minimum number of megabytes necessary to purchase for a 4-byte wide memory bus. For the NVRAM boards, this column just lists configurations using different amounts of memory. The boards have a fixed overhead cost for the batteries and assembly plus an incremental cost for memory. The Price per megabyte column shows the amortized cost for a configuration of the size indicated in the Minimum configuration column.
-2-
data on disk, the data must reach non-volatile storage on the server before it is removed from the client cache. This could require some changes in client cache protocols, or else a synchronous write from the client cache to the server’s disk. An alternative that avoids the latency of a disk access is to write the data into NVRAM on the server. Finally, modified data may become unavailable if it resides in an NVRAM cache on a crashed client. To avoid this problem for clients that do not recover quickly, it must be possible to move an NVRAM component to another client and retrieve its data from the new location.
What block replacement policies work best in the non-volatile cache? How should we integrate NVRAM into the cache organization in order to get most of the potential benefits? Given current costs, does it make economic sense to invest in NVRAM as opposed to buying more volatile memory? We addressed these questions using file system trace data to simulate different models of non-volatile client caches, with varying amounts of NVRAM and different block replacement policies.
We gathered our measurements on the Sprite distributed file system. Sprite is a cluster of about 40 SPARCstation 1, SPARCstation 2, Sun 3, DECstation 3100, and DECstation 5000 workstations, all diskless and most with 24 to 32 megabytes of memory. The cluster has a number of file servers, but most of the traffic is handled by a single Sun 4 file server with 128 Mbytes of main memory. All of the workstations in the cluster run the Sprite network operating system, which is largely UNIX-compatible. Most of the applications running on the cluster are standard UNIX applications. In addition, Sprite provides process migration [5], allowing users to offload jobs easily to idle machines in the cluster. The user community during the measurement period included operating systems researchers, architecture researchers working on the design and simulation of new I/O subsystems, a group of students and faculty working on VLSI circuit design and parallel processing, administrators, and graphics researchers. About 30 users do their day-to-day computing on Sprite, and another 40 people use the system occasionally.
2.1. Caching Models We considered two models for incorporating nonvolatile memory in a client file cache, write-aside and unified, and compared them to a volatile client cache model. The volatile model captures most of the behavior of Sprite’s client caching except for dynamic cache sizing and preference for dirty blocks. Sprite’s caches change in size, according to the relative memory needs of the file system and the virtual memory system. For simplicity, we assumed caches of static size in this study and also did not give dirty blocks preference in the block replacement policy. Giving dirty blocks preference helps reduce write traffic, but at the expense of increasing read traffic. Sprite’s client caches maintain two separate lists of four-kilobyte cache blocks: the free list contains free blocks and the LRU list contains blocks in use with the least-recently accessed blocks first. When a block must be read or written into the cache, a free block is chosen. If there are no free blocks, the first clean block on the LRU list is chosen for replacement. Files containing dirty blocks that are less-recently accessed than the selected clean block are scheduled to be written back to the server, and a block cleaner is started. The block cleaner also runs at five second intervals and writes back blocks containing dirty data more than 30 seconds old. This produces clean blocks that are then subject to block replacement. While the Sprite policy gives preference to dirty blocks (a clean block is always replaced before a dirty block, even if a dirty block is less-recently accessed), our volatile model does not. Instead, the least-recently accessed block is replaced, whether clean or dirty, and is written back to the server if necessary.
2. Non-Volatile Client File Caches The study in [1] found that write events currently account for about one-third of the total file bytes transferred from clients to the file server and that most of these writes were a result of Sprite’s 30-second delayed write-back and cache consistency policy rather than cache block replacement. Since most file data in Sprite is overwritten or deleted within half an hour of its creation, retaining file blocks in non-volatile client caches may significantly improve system performance by reducing server write traffic. To determine the effectiveness of NVRAM for this purpose, we addressed the following questions: How long does dirty data last before being overwritten or deleted?
In addition to data written by the block cleaner, dirty data is also written to the server cache due to Sprite’s cache consistency policy. Sprite file servers maintain consistency between client caches. The server keeps track of the last client to write each file. If another client opens that file, the server recalls any dirty data not yet flushed from the last writer’s cache. If two or more clients have the same file open simultaneously, and at least one of them has it open for writing, the server disables client caching on the file until all the clients have closed it. This is called concurrent write-sharing. During concurrent write-sharing all
If there were infinite room in the non-volatile cache, what percentage of dirty data would be overwritten or deleted? How much must be written back to the file server due to the cache consistency policy? Given an omniscient block replacement policy, how much NVRAM would it take to get a significant reduction in write traffic?
-3-
read and write requests for the file bypass the client cache and go directly to the file server.
volatile caches. The unified model more closely integrates the volatile and non-volatile file caches. The blocks are not duplicated between the NVRAM and the volatile cache: dirty blocks reside only in the NVRAM while clean blocks may reside in either the volatile cache or the NVRAM. A clean block may be put in the NVRAM if a read operation finds the volatile cache full while the NVRAM has a free block or contains the least-recently accessed block. Application writes are directed only to the NVRAM, but read requests can be satisfied from either cache. As in the write-aside policy, there is no 30-second delayed write on dirty data; blocks leave the NVRAM only due to the consistency mechanism or when replaced by other blocks. The unified model retains strict LRU semantics with respect to the volatile cache, although we experimented with different replacement policies (described in Section 2.5) for blocks in the NVRAM. When an incoming write request causes a block to be replaced in the NVRAM, the removed dirty block is written back to the server and its access time is compared to that of the least-recently used block in the volatile cache. If the least-recently-used block in the volatile cache is older, then it is replaced with a clean copy of the block removed from the NVRAM.
While all read and write requests are directed to a single volatile cache in the volatile model, the two NVRAM models include both volatile and non-volatile caches, as illustrated in Figure 1. In the write-aside model, the NVRAM is intended only to protect dirty data in the volatile cache; it holds copies of blocks that are also present in the volatile memory, so it is never read except during crash recovery. This minimizes accesses to the NVRAM and would accommodate NVRAM access times significantly slower than volatile memory access times. Writing data into both the volatile cache and the NVRAM increases traffic on the memory bus. The volatile cache no longer uses a 30-second delayed write on dirty data, and dirty blocks, even those from files explicitly fsync’d by the user, remain in the NVRAM until replaced by other blocks or until flushed back to the server by Sprite’s consistency mechanism. (For the purposes of this study, we assume that data written to NVRAM is as permanent as data written to disk. In a real system, it would be possible to provide a method for flushing data from the NVRAM to server disk.) After dirty data blocks are written to the file server, they are removed from the NVRAM but may remain as clean blocks in the volatile cache. As in the volatile model, block replacement is strictly LRU with respect to the volatile cache. If a dirty block is replaced, it is written to the server and then invalidated in both the volatile and non-
2.2. The Simulations We simulated client cache behavior using file system trace data previously obtained from Sprite. The traces
����������������������������������������������������������������������������������������������������
Application
Application
Client
Client
Volatile Cache
NVRAM
Volatile Cache
Network
NVRAM
Network
Disk
Disk
Cache
Cache
Server
Server Write-aside Model
Unified Model
Figure 1: NVRAM cache models. In the write-aside model, file data is written into both the volatile cache and the NVRAM. The NVRAM is used only to protect the permanence of the dirty data in the volatile cache, and is otherwise not accessed except after system failure. In the unified model, the volatile memory and NVRAM are combined into a single larger cache. An individual block may reside in either memory (but not both), and all dirty blocks are required to be kept in the NVRAM.
-4-
record key file system operations such as file opens, closes, and seeks. The current file offset appears in each of these events, making it possible to deduce the order and amount of read and write traffic to files. However, it is not possible to deduce the actual number or exact times of write operations or which write operations were caused by application fsync requests. The traces also record file truncation and deletion events that, along with overwriting, cause bytes to die in the client caches. Sprite’s consistency protocols and process migration also generated trace events that flush bytes from the client caches to the server. The trace data is broken into eight 24-hour trace runs. The traces record similar workloads, except for traces 3 and 4 in which two users performed long-running simulations on large files, resulting in higher file system throughput. More detailed information about the traces can be found in [1], and more detailed information about the trace methodology can be found in [16].
simulation started with empty caches, thereby misclassifying some writes as new data rather than overwrites. The results in Figure 2 indicate that holding dirty blocks in the cache for longer than the traditional 30 seconds will reduce write traffic from clients to servers. The lifetime simulation also generated information concerning the final fate of file bytes, given a non-volatile cache of infinite size. With a cache of infinite size, no bytes are ever written back to the file server due to cache block replacement. Table 2 summarizes the fate of all written bytes across all eight traces and also across the ‘‘typical’’ traces alone (all traces except for 3 and 4). Across all traces, 85% of bytes written could be absorbed by a sufficiently large NVRAM. However, if we exclude traces 3 and 4, only 65% absorption is possible. The table shows two categories of write traffic from the clients to the server: Concurrent writes and Called back bytes. The concurrent writes row gives the number of bytes for which caching was disabled due to concurrent write-sharing; this category turns out to be minuscule. Bytes called back include those written back to the server due to the migration of a process, and those recalled to the server after one
The simulations required several passes over the trace data. We first processed the trace data to convert it into read, write, delete, flush, and invalidate operations on ranges of bytes. Given this data, the simulator kept track of the contents of both volatile and non-volatile caches for all client machines and maintained file sizes and block access and modify times. Input parameters to the simulator specify the maximum sizes of the volatile and non-volatile caches, the NVRAM model, and the replacement policy in the non-volatile cache. LRU replacement was used in the volatile cache for all simulations. The simulations counted the number of bytes read and written from applications, and the number and ages of bytes overwritten, deleted, or transferred to or from the file server. For most of the simulations, these counts yielded the final result, but the measurements of lifetimes of cached data and the simulation of an omniscient replacement policy required a third pass over the data. To obtain these results, we simulated a non-volatile cache of infinite size. The simulator then produced a log of all runs of bytes overwritten, deleted, or left remaining in the cache, along with their times of creation and deletion. The omniscient policy simulator used this information to choose the block with the next modify time furthest in the future.
�����������������������������������������������
Net write traffic (%) 100
Trace 1 Trace 2 Trace 3 Trace 4 Trace 5 Trace 6 Trace 7 Trace 8
75
50
25
0 0.01
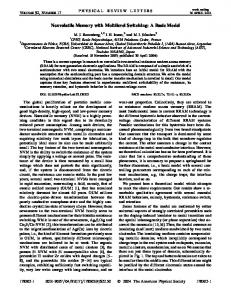
2.3. Byte Lifetimes The lifetime simulation determined the fraction of bytes that die in the NVRAM within a given write delay. As demonstrated in Figure 2, for most of the traces 35 to 50% of written bytes die within 30 seconds, while about 60% of bytes die within a few hours. For traces 3 and 4, in which large amounts of data were transferred, only 5 to 10% of bytes die within 30 seconds, while more than 80% die within half an hour. In reality, more bytes will die in the cache than suggested by Figure 2 for two reasons. First, the traces are of finite length and we assume that all bytes left in the NVRAM at the end of the trace are eventually written back to the server. Some of these bytes would be overwritten or deleted, reducing the fraction that would need to be written back to the server. Second, the
0.10
1
10
100
1000
10000
Time in minutes Figure 2: Byte lifetimes. Net write traffic (expressed as the percentage of bytes written to client caches that eventually had to be written to the server) when bytes are flushed after a fixed write-back delay from a cache of infinite size. The X axis is a log scale. Results are shown for all eight 24-hour traces in [1]. Traces 3 and 4 represent workloads different from the other traces because two users performed long-running simulations on large files, resulting in higher file system throughput.
-5-
�� �������������������� � ��������������������������������������� ������������������������������������������� ��������������������������������������������� � � Traffic type �� ������������Megabytes ���������� ����������������������� � ��������������������� ����������������������� % �� �������������������� � ��������������������������������������� ��All � ���� traces No 3 or 4 All traces � � � � � � � � � � � � � � � � � � � � � � � � � � � � � � � � � � � � � � � � � � � � � � � � � � � � � � � � � � � � �� �� �� � ���������������������������������������������������������������������������������������������������������������������������� ��No ���� ���� ��3 ���� ��or ���� ��4�� ���� ���� ���� � � � Never � Overwritten 189 142 � 2.86 � 7.36 � � � � � Leave �����Deleted 5,439 1,128 82.27 � 58.27 ������������������������������������ � � ��������������������� ����������������������� ����������������������� ����������������������� NVRAM Total absorbed 5,629 1,271 85.13 � � � � � � � � � � � � � � � � � � � � � � � � � � � � � � � � � � � � � � � � � � � � � � � � � � � � � � � � � � � � � � � � � � � � � � � � � � � � � � � � � � � � � � � � � � � � � � � � � � � � � � � � � � � � � � � � � � � � � � � � � � � � � � � � � � � � � � �� ��� �� � � � ���������������������������������������������������������������������������������������������������������������������������� ��������������65.63 ���� ���� ���� ���� � Cause � Called back � � 534 321 8.07 16.56 � � � Server � Concurrent writes � 7����� ����������0.42 ��������������������������������������������������27 ����������� ������������������ ������������� ����������������0.36 ������� � � � � Traffic �����Total server writes � ��������561 328 �������������������������� ��������� ����������8.49 ��������������������������16.92 ��������� � ������������������������������������ � � � � 390 ���� ���� ���� ���� ���� ���� ���� ���� ���� ���� ��Remaining ���� ���� ���� ���� ���� ���� ���� ���� ���� ���� ���� ���� ���� ���� ���� ���� ���� ���� �� ���� ���� ���� ��507 ���� ���� ���� ���� ���� ���� �� ���� ���� ���� ���� ���� �� ���� ���� ���� ���� �� ���� ���� ���� ���� ��7.67 ���� ���� ���� ���� ���� ��� �� ���� ���� ���� ���� ���� ���� ��20.17 ���� ���� ���� ���� ���� �� �� �� �� �� �� � �� Total application writes 6,612 1,936 100.00 100.00 � ������������������������������������������������������������������������������������������������������������������������������������������������� � � � � � � � � � � � ��
Table 2: Summary of types of write traffic. This table gives the fate of all bytes written into a non-volatile cache of infinite size. The columns labeled All traces give the results summed across all eight traces. The columns labeled No 3 or 4 give the results summed across all traces except 3 and 4, during which large amounts of data were transferred. The row Remaining indicates how many bytes were left in the cache at the end of the trace interval. The column totals exceed the Total application writes because an application write of less than an entire block may cause a whole cache block to be written back to the server. ������������������������������������������������������������������������������������������������������
client has written a file and another has opened it. The number of bytes written back to the server due to process migration is less than one percent of the total traffic, so the server traffic is almost entirely due to the cache consistency mechanism. Reducing write traffic beyond 10 to 17% would require choosing a cache consistency policy more efficient than Sprite’s, such as a protocol based on block-by-block invalidation and flushing, rather than whole-file invalidation and flushing [21].
Net write traffic (%) 100
Trace 1 Trace 2 Trace 3 Trace 4 Trace 5 Trace 6 Trace 7 Trace 8
75
2.4. Small NVRAM Reduces Traffic
50
Figure 3 shows that in most cases a small NVRAM significantly reduces write traffic from clients to servers. We used the byte lifetimes derived from the processed trace data to simulate an omniscient cache manager, using the unified NVRAM model, that can always flush the block in the cache whose next modify time is the furthest in the future. These results give the possible reduction in write traffic as a function of NVRAM cache size for each of the eight traces. The results are optimal in terms of blocks, but not necessarily in terms of bytes, since the block with the next modify time furthest in the future may contain many dirty bytes, while the block that is spared replacement may contain only a few dirty bytes to be overwritten or deleted. One-eighth of a megabyte of NVRAM (small in comparison with the average seven megabytes of volatile file cache in Sprite) eliminates 30 to 50% of the server write traffic for most of the traces. Figure 3 also shows that increasing the amount of NVRAM results in rapidly diminishing returns. For most of the traces, one megabyte reduces write traffic by 50% while eight megabytes provides less than 10% further reduction. The net traffic in Figure 3 and all other figures in this section includes the bytes remaining in the NVRAM at the end of the trace. Thus, these figures present a pessimistic view of the benefits of client NVRAM caches.
25
0 0.01
0.10
1
10
100
Megabytes NVRAM Figure 3: Results of an omniscient replacement policy. The omniscient policy replaces the block with the latest next-modify time. This figure shows the net file write traffic to the server using this omniscient policy for various client NVRAM cache sizes. The X axis is a log scale. Results are shown for all eight traces. �������������������������������������������
2.5. Replacement Policies After observing that a small non-volatile cache with an omniscient replacement policy significantly reduces write traffic for most of the traces, we examined the results of the unified NVRAM model using realistic replacement policies: LRU and random. The LRU policy favors the
-6-
short-lived blocks in the cache by replacing the leastrecently-used (modified or accessed) block. The random policy chooses random blocks for replacement, thus gauging the sensitivity of write traffic reduction to the particular replacement policy. These simulations are also more realistic than the omniscient policy in that they include the effects of read traffic on cache replacement: dirty blocks may be replaced not just to make room for other dirty blocks, but also to make room for more recent clean blocks.
frequency of NVRAM accesses. While both non-volatile cache models do equally well for absorbing write traffic, the unified model does better with read traffic, by effectively increasing the overall size of the cache. In the unified model, clean blocks can be placed in the non-volatile cache as well as in the volatile cache, depending on which cache contains the leastrecently accessed block. In the write-aside model, only dirty blocks reside in the non-volatile cache, with duplicate copies in the volatile cache, so adding NVRAM does not increase the size of the cache for clean blocks.
The simulations of block replacement policies surprised us by demonstrating only small differences between the policy designed to favor short-lived blocks and the random replacement policy. Figure 4 shows insignificant differences in write traffic reduction between the replacement policies in a typical trace (Trace 7). Indeed, the random policy behaves almost as well as the LRU policy. With one megabyte of NVRAM, however, the omniscient policy performs only 10 to 15% better than the feasible replacement policies. The difference between the omniscient and other policies is at most 22% across all the traces, including traces 3 and 4.
Figure 5 shows the effect of the different cache models on total (both read and write) traffic between the clients and servers. For these simulations, we used an LRU replacement policy in both the volatile and nonvolatile caches. All the models began with an eightmegabyte volatile cache. The non-volatile policies were simulated with increasing quantities of non-volatile cache, while the volatile policy was simulated with an increasing quantity of volatile cache. The unified model performs 8% better than the volatile cache model with the addition of four extra megabytes of cache memory, while the write�����������������������������������������������
2.6. Comparison of Cache Models To contrast the non-volatile cache models, we examined their effect on read and write traffic between clients and servers, on client memory bus traffic, and on the
Net total traffic (%) 60
�����������������������������������������������
Net write traffic (%)
write-aside
40 100
volatile unified 75
20
50 random 0
LRU
0 0.01
0
omniscient
25
2
4
6
Megabytes extra memory
0.10
1 10 Megabytes NVRAM
Figure 5: Effect of cache models on net total traffic. This figure shows the percentage of total file traffic from clients that is read from or written to the file server for each of the cache models using Trace 7. Each of the models starts with eight megabytes of volatile cache. The X axis shows the effect of adding memory to the cache. For the volatile model, volatile memory is added. For the unified and write-aside models, NVRAM is added.
100
Figure 4: Replacement policies. This figure gives the net file write traffic achieved by three replacement policies for Trace 7. The X axis is a log scale.
-7-
8
aside model performs 8% worse. The unified model performs better than the write-aside model because it reduces both read traffic and write traffic, while the write-aside model only helps reduce write traffic. With eight extra megabytes of cache memory, the unified model performs 14% better than the volatile policy, while the write-aside model performs 14% worse. Thus, NVRAM should be closely integrated into the cache mechanism for best effect.
2.7. Non-Volatile Versus Volatile Caches Another question we considered is whether money is better spent on volatile or non-volatile memory for client caches. To examine the cost-effectiveness of NVRAM versus volatile memory, we used Figure 6 to compare the total file traffic reduction produced by varying amounts of volatile and non-volatile memory, and then we weighed the benefits against the prices. Given current costs for NVRAM and the fact that read traffic today is the majority of traffic between clients and servers, we expected NVRAM to make a poor showing. The cost-effectiveness of NVRAM, however, depends upon the amount of volatile memory already present in the system. Given sufficient volatile memory, NVRAM may be a cost-effective method for reducing network write traffic even at today’s prices.
For amounts of NVRAM less than a half megabyte, the volatile model performs better than both the NVRAM models. In the volatile model, the pool of blocks available for replacement for newly-written data consists of the entire volatile cache, while it consists only of the NVRAM for the NVRAM models. This indicates that an even more closely integrated NVRAM model that allows dirty blocks to be written both to the NVRAM and to the volatile cache (subject to a 30-second delayed write-back) would provide superior performance to the models discussed here. However, this model would allow some dirty data to be vulnerable for at least 30 seconds in the volatile cache.
Figure 6 shows that the addition of two megabytes of NVRAM on top of eight megabytes of volatile cache reduces total network file traffic by the same amount as the addition of four megabytes of volatile memory. Similarly, adding four megabytes of NVRAM on top of eight megabytes of volatile cache produces the same benefit as the addition of eight more megabytes of volatile memory.
Other differences between the two NVRAM models are the amount of traffic they generate on the memory bus and the number of accesses they generate to the NVRAM. Blocks are written to both the NVRAM and volatile cache in the write-aside model, whereas blocks are written only to the NVRAM in the unified model, thus the write-aside model starts with twice as much memory traffic. However, when blocks are flushed from the NVRAM in the unified model, they may be transferred to the volatile cache. One megabyte of NVRAM absorbs about half of the bytes written by applications, so the unified model transfers at most 50% of the original blocks to the volatile cache. Including this traffic transferred from the NVRAM to the volatile cache, the unified model generates at least 25% less file cache traffic on the the local memory bus than the writeaside model. There is also a small amount of data transferred from the cache to the NVRAM; this occurs when an application updates part of a file block, rather than overwriting the whole block. If the cache manager finds this file block in the volatile cache, it transfers the block to NVRAM and updates it there. Our measurements show that this is rare and amounts to less than one percent of the write events requested by applications.
�����������������������������������������������
Net total traffic (%) 60 Volatile-8Mbytes Volatile-16Mbytes Unified-8Mbytes Unified-16Mbytes 40
20
0
The unified cache model generates many more accesses to the NVRAM than does the write-aside model. This is because blocks are written to, but not read from, the NVRAM in the write-aside model, while both clean and dirty blocks may be read from the NVRAM in the unified model. For an eight-megabyte volatile memory and an eight-megabyte NVRAM, the simulation results show that the unified model generates from two to two-and-a-half times as many NVRAM accesses. If NVRAM access times were significantly slower than volatile memory access times, this could make NVRAM less appealing. Otherwise, the unified model seems superior to the writeaside model in terms of total network traffic reduction and local memory bus traffic.
0
2 4 6 Megabytes extra memory
Figure 6: Benefits of additional memory. This figure shows the percentage of total file traffic from clients that is read from or written to the file server for the volatile and unified cache models using Trace 7. Each of the models starts with 8 megabytes or 16 megabytes of volatile cache. The X axis shows the effect of adding memory to the cache. For the volatile model, volatile memory is added. To the unified model, NVRAM is added.
-8-
8
This indicates that with only eight megabytes of volatile cache, adding NVRAM would be the right choice if it were less than twice as expensive as volatile memory. But at today’s prices, with NVRAM at least four times as expensive as volatile memory, the trade-off is not yet favorable for client caching using NVRAM.
3. Using NVRAM as a File System Write Buffer While the previous section showed how NVRAM can be used to reduce write traffic between diskless clients and the file server, this section describes how NVRAM can be used to reduce physical writes from the server to its disk system. Servers can also use NVRAM file caches to absorb write traffic, producing reductions in the server-disk traffic similar to those in the client-server traffic. Since this use of NVRAM was covered in Section 2, we will now consider the use of NVRAM as a write buffer in front of the disk to reduce the number of disk write accesses.
With 16 megabytes of volatile cache, NVRAM performs more successfully, because the larger volatile cache has already reduced read traffic, but is not capable of further reducing write traffic. In this situation, just a halfmegabyte of NVRAM provides the same benefit as more than six additional megabytes of volatile memory. Given sufficient volatile memory, NVRAM provides better price/performance even at today’s prices.
The use of NVRAM to improve disk performance is not new. Traditional distributed file systems, especially file servers running the UNIX fast file system [13] in the NFS [19] environment, have already used NVRAM to reduce disk traffic. It is particularly beneficial for NFS file systems, since the NFS protocol requires many synchronous write operations [11]. The Legato Systems Prestoserve board [15] caches NFS server requests in non-volatile memory to reduce the latency of synchronous writes to the file system, and performance improvements of up to 50% have been reported on systems using this board. IBM uses four megabytes of NVRAM on the 3990-3 disk controller in a similar fashion [10][14]. Disk writes go to this nonvolatile speed matching buffer to reduce latency. Buffering writes also allows more efficient disk utilization since the system can sort its I/O operations to reduce disk head
Finally, non-volatile caches on client workstations make sense only for systems such as Sprite and AFS 4.0 [12] that improve performance by caching dirty data on clients. In NFS file systems, the cache consistency mechanism requires that dirty data be written through almost immediately to the file server, removing any benefit for using non-volatile memory for file caching on clients. In these NFS systems, it makes more sense to put nonvolatile memory on the file servers, as described in the next section.
���������������������������������������������������������������������������������������������������� file1
file2
(a)
... more modified blocks ...
... unused blocks ...
SEGMENT
SEGMENT
file1
(b)
block 2 file2
file2
... more modified blocks ...
file3
more of file1 ... more modified blocks ...
SEGMENT
SEGMENT
Data Block
Metadata
Summary Block
Figure 7: A log-structured file system. These figures show a simplified example of file allocation in LFS. In figure (a), two files have been written, file1 and file2. Each file has a metadata block, describing the location of the file’s data blocks, that is allocated after the file on disk. In figure (b), the middle block of file2 has been modified. A new version of it has been added to the log, as well as a new version of its metadata. Then file3 is created, causing its blocks and metadata to be appended to the log. Next, file1 has two more blocks appended to it. These two blocks and a new version of file1’s metadata are appended to the log. At the end of each segment, LFS appends a summary block that describes the segment’s contents.
-9-
motion. Simulation results in [20] show that only 7% of disk bandwidth is used when writing dirty data randomly to a disk. Instead of writing blocks randomly, 1000 I/O’s, requiring four megabyte of NVRAM, can be buffered and sorted to utilize 40% of the disk bandwidth.
describing the segment’s contents, and writes out the whole unit with a single seek. Figure 7 shows the allocation of three files in a log-structured file system. Before the log uses up all the space on disk, LFS’s garbage collector reclaims space from old segments containing data that has been overwritten or deleted, compacting the remaining live data into a smaller number of new segments.
In this paper, we consider the use of NVRAM on a file server in a more modern, write-optimized file system. Several database and file systems use various forms of logging on the file server to improve write I/O performance by minimizing the latency of disk writes [6][7][9][12][18]. Sprite’s log-structured file system [18] (LFS) is the most extreme example of a logging file system, because file data and metadata are written to disk only in a log format. Also, file metadata operations in Sprite are performed asynchronously rather than synchronously. While we do not see as great an improvement in performance due to NVRAM with this write-optimized file system as with the NFS protocol and the UNIX fast file system, we do see some improvement. According to our measurements of LFS disk activity, a one-half megabyte non-volatile write buffer for a Sprite LFS would reduce the number of disk write accesses for most file systems measured by a modest 10 to 25%, but would reduce disk write accesses by 90% on the most heavily-used file system.
LFS is not always able to write out full segments. If LFS must issue a disk write before a full segment’s worth of data has accumulated, then less data is written per seek, resulting in lower disk bandwidth utilization. There are two causes for these partial segment writes in Sprite: a 30second timeout that causes data to be written from the server’s cache to disk and fysnc requests from user applications. In the current Sprite file system, dirty data older than 30 seconds is flushed from the cache every 5 seconds. Partial segments due to this flushing do not impact disk bandwidth, because they only occur when the file system is lightly utilized. However, fsyncs require that LFS immediately write out whatever dirty data is present, regardless of the amount of disk traffic, and these forced synchronous writes from applications reduce the efficiency of LFS. In the NFS network protocol, there are even more synchronous write operations, so using LFS as the storage manager for an NFS file server would result in even more partial segment writes.
In contrast to traditional UNIX file systems, LFS is optimized for writing rather than reading. It amortizes the cost of writes by collecting large (one-half megabyte) segments of data before issuing contiguous disk writes. The file system’s disk layout is a sequence of segments that comprise a log of the system. File metadata, incorporated into the log, describes the location of the blocks in the file to support efficient reads. While traditional file systems seek to a predefined disk location to update metadata or to write different files, LFS gathers all the dirty file data and metadata into a single segment, appends a summary block
To measure LFS disk activity, we sampled kernel counters on the main Sprite file server every half hour over a period of two weeks. We recorded the number and size of disk writes and whether the writes were the result of application fsyncs. There are eight LFS file systems on the server. /user1, /user2, /user4 and /user6 all contain home directories. Processes page to the /swap1 disk, /sprite/src/kernel contains the Sprite kernel development area, and various local programs are installed on the /local
���������������������������������������������������������������������������������������������������� �� �������������������������������� ����������������������������������� ��������������������������������������������������� ������������������������������� % total segments � File system � % total segments � � % segments from �� �������������������������������� ������that � ���� � ���� are partial that are partial due to fsync this � � � � � � � � � � � � � � � � � � � � � � � � � � � � � � � � � � � � � � � � � � � � � � � � � � � � � � � � � � � � � � � � � � � � � � � � � � �� �� �� � ��������������������������������������������������������������������������������������������������������������������� ������ ���� ���� ��file ���� ���� ��system ���� ���� ���� ���� ���� ���� � /user6 � � � 97 92 89.0 � �������������������������������������������������������������������������������������������������������������������������������������������������� � � � � /local 65 0.01 3.0 �� �������������������������������� ����������������������������������� ��������������������������������������������������� ������������������������������� /swap1 70 0 �� �������������������������������� ����������������������������������� ��������������������������������������������������� ����������������3.0 ��������������� �� �/user1 ������������������������������� ����������������90 ������������������� ��������������������18 ������������������������������� ����������������1.9 ��������������� � /user4 � � � � �����������������������������������������������92 ��������������������������������������10 ����������������������������������������������1.5 ��������������� � � � � �� �/sprite/src/kernel ������������������������������� ����������������71 ������������������� ��������������������22 ������������������������������� ����������������0.9 ��������������� ��� �/user2 �������������������������������� ����������������92 �������������������� ��������������������20 �������������������������������� ����������������0.3 ��������������� � �/scratch4 ����������������������������������������������96 ����������������������������������������0 ����������������������������������������< ����0.1 ���������������
� � � � � � � � � � � ��
Table 3: Percent of forced partial segments on LFS file systems. The column % total segments that are partial gives the percentage of segment writes that are partial segments, including both fsyncs and data written by the 30-second delay, while the next column includes only those partial segments resulting from fsyncs. The column % segments from this file system gives the percentage of segment writes received by the particular file system, out of the total number of segment writes across all the file systems. This total includes both full and partial segments.
- 10 -
file system. Finally, /scratch4 is a scratch disk generally used for storing long-lived trace data.
almost one third of the available disk space until the garbage collector runs. On /sprite/src/kernel the overhead is only about 8% of each partial segment. Partial segments account for about 70% of total segment writes to /sprite/src/kernel, so the overhead on this file system could only reach about 5%. Using NVRAM would eliminate partial segment writes and would therefore reduce the disk space overhead to the less than 1% overhead for full segments. This would improve disk utilization by 5 - 33% and reduce garbage collection load on the server CPU.
Table 3 shows the percentage of partial segments due to fsyncs for each of the LFS file systems on Sprite’s main file server. Our measurements show that for most Sprite file systems, 10 to 25% of segments written to an LFS disk are partial segments due to application fsyncs. The most heavily-used file system, /user6, showed 92% of segment writes were partial segments due to fsyncs, in part because one of the users was executing long-running data base benchmarks that request five fsyncs after every database transaction. With a write-buffer, these disk accesses could be avoided, because the writes would remain in the NVRAM buffer until a whole segment accumulated [8]. For some file systems, no forced synchronous writes occur. /swap1, for instance, saw no partial segments due to fsyncs, because applications never write directly to the swap disk.
Unfortunately, because we did not have data on the number of disk reads, we were unable to measure the ratio of read accesses to write accesses or to determine the overall disk traffic reduction that the NVRAM made possible. This paper has only examined minimizing the number disk write accesses, but read latency may also be an important parameter for some systems. Extremely large write I/O’s can cause potentially unacceptable latency to any synchronous read requests that queue up behind them. Analytic results in [3] show that the optimal write size for an LFS is approximately two disk tracks, typically 50 - 70 kilobytes. The analytic study reports that the increase in mean read response time due to full segment writes is sometimes as much as 37%, but typically about 14%. This increase in response time affects only those reads that miss in the file data cache, so further measurements are required to compute the effect on total I/O cost.
In addition to the disk bandwidth reductions, there is a disk space cost associated with partial segments. To each full or partial segment, LFS appends at least one fourkilobyte block of metadata. In addition, LFS places a 512-byte summary block at the end of the segment to describe its contents. The smaller the average unit of writing, the higher a percentage of disk space is occupied by the metadata and summary blocks. The lost disk space is not reclaimed until LFS’s garbage collector runs. Table 4 allows us to estimate the disk space overhead for partial segments. The table shows the average number of kilobytes of file data (not including metadata or summary information) written per partial segment on each of the eight file systems. The partial segments average from 8 kilobytes on /user6 to 55 kilobytes on /sprite/src/kernel. On /user6, the space taken up by the metadata and summary blocks in partial segments is about one third of the segment. Since 97% of the segments are partial segments on /user6, the overhead could reach
4. Impact on System Design While the use of NVRAM on client workstations can improve write performance in distributed file systems, it also creates some new system design issues. The issues arise from the treatment of long-lived data in the client caches and from clients crashing while their non-volatile caches contain live data.
���������������������������������������������������������������������������������������������������� ����������������������������������� � ����������������������������� ��������������������������������������� ����������������������������������� File system Kbytes/fsync partial traffic ������� � �� � � � � � � � � � � � � � � � � � � � � � � � � � � � � � � �� �� �� �� �� �� �� �������������������������������� ��Kbytes/partial ���� ���� ���� ���� ���� ���� ���� ���� ���� ���� ���� ���� ��� �� ���� �� ���� ���� ���� ���� ���� ���� ���� ���� ���� ���� �� ���� ���� ���� ���� ���� ��� �� ���� ��% ���� ��total ���� ���� ���� ��write ���� ���� ���� ���� �� ���� ���� ���� ���� � /user6 � � � 7.9 6.6 49.3 ��������������������������������������������������������������������������������������������������������������������������������������� � � � � /local 45.0 113.0 20.4 ����������������������������������� � ����������������������������� ��������������������������������������� ����������������������������������� ������������������������������ ������������������� ����������������NA ����������������������� ����������������19.0 ������������������� �����/swap1 � ����������53.0 20.3 14.9 �����/user1 � � ������������������������������������������������������������������������������������������������� ������������������3.4 ����������������� � /user4 � � � ��������������������������������������������18.7 ����������������������������������23.4 ����������������������������������������2.2 ����������������� � � � � 55.0 21.3 5.0 ��� ��/sprite/src/kernel ������������������������������ � � � � � � � � � � � � � � � � � � � � � � � � � � � � � � � � � � � � � � � � � � � � � � � � � � � � � � � � � � � � � � � � � � � � � � � � � � � � � � � � � � � � ����������������� � � �