FY05-SED-35 and the final report FY06; U.S. Army Research Laboratory: Adelphi, MD, December 1996. 3. Kwon, H. ..... BATTLE LAB INTEGRATION &.
Nonlinear Joint Fusion and Detection of Mines Using Multisensor Data by Nasser M. Nasrabadi
ARL-TN-314
Approved for public release; distribution is unlimited.
May 2008
NOTICES Disclaimers The findings in this report are not to be construed as an official Department of the Army position unless so designated by other authorized documents. Citation of manufacturer’s or trade names does not constitute an official endorsement or approval of the use thereof. Destroy this report when it is no longer needed. Do not return it to the originator.
Army Research Laboratory Adelphi, MD 20783-1197
ARL-TN-314
May 2008
Nonlinear Joint Fusion and Detection of Mines Using Multisensor Data Nasser M. Nasrabadi Sensors and Electron Devices Directorate, ARL
Approved for public release; distribution is unlimited.
Form Approved OMB No. 0704-0188
REPORT DOCUMENTATION PAGE
Public reporting burden for this collection of information is estimated to average 1 hour per response, including the time for reviewing instructions, searching existing data sources, gathering and maintaining the data needed, and completing and reviewing the collection information. Send comments regarding this burden estimate or any other aspect of this collection of information, including suggestions for reducing the burden, to Department of Defense, Washington Headquarters Services, Directorate for Information Operations and Reports (0704-0188), 1215 Jefferson Davis Highway, Suite 1204, Arlington, VA 22202-4302. Respondents should be aware that notwithstanding any other provision of law, no person shall be subject to any penalty for failing to comply with a collection of information if it does not display a currently valid OMB control number.
PLEASE DO NOT RETURN YOUR FORM TO THE ABOVE ADDRESS. 1. REPORT DATE (DD-MM-YYYY)
2. REPORT TYPE
3. DATES COVERED (From - To)
May 2008
Final
1 December 2007
4. TITLE AND SUBTITLE
5a. CONTRACT NUMBER
Nonlinear Joint Fusion and Detection of Mines Using Multisensor Data 5b. GRANT NUMBER 5c. PROGRAM ELEMENT NUMBER 6. AUTHOR(S)
5d. PROJECT NUMBER
Nasser M. Nasrabadi
DRI 2007 5e. TASK NUMBER 5f. WORK UNIT NUMBER
7. PERFORMING ORGANIZATION NAME(S) AND ADDRESS(ES)
8. PERFORMING ORGANIZATION REPORT NUMBER
U.S. Army Research Laboratory ATTN: AMSRD-ARL-SE-SE Adelphi, MD 20783-1197
ARL-TN-314
9. SPONSORING/MONITORING AGENCY NAME(S) AND ADDRESS(ES)
10. SPONSOR/MONITOR’S ACRONYM(S)
11. SPONSOR/MONITOR'S REPORT NUMBER(S) 12. DISTRIBUTION/AVAILABILITY STATEMENT
Approved for public release; distribution unlimited. 13. SUPPLEMENTARY NOTES
14. ABSTRACT
This report describes a new nonlinear joint fusion and anomaly detection technique for mine detection applications using two different types of sensor data (synthetic aperture radar [SAR] and hyperspectral sensor [HS] data). A well-known anomaly detector called the “RX algorithm” is first extended to perform fusion and detection simultaneously at the pixel level by appropriately concatenating the information from the two sensors. This approach is then extended to its nonlinear version. The nonlinear fusion-detection approach is based on the statistical kernel learning theory which explicitly exploits the higher-order dependencies (nonlinear relationships) between the two types of sensor data through an appropriate kernel. Experimental results for detecting anomalies (mines) in hyperspectral imagery are presented for linear and nonlinear joint fusion and detection for a co-registered SAR and HS imagery. The results show that the nonlinear techniques outperform linear versions. 15. SUBJECT TERMS
sensor fusion, nonlinear anomaly detection, hyperspectral detection, joint fusion and detection, kernel RX 17. LIMITATION OF ABSTRACT
16. SECURITY CLASSIFICATION OF: a. REPORT
b. ABSTRACT
c. THIS PAGE
UNCLASSIFIED
UNCLASSIFIED
UNCLASSIFIED
18. NUMBER OF PAGES
19a. NAME OF RESPONSIBLE PERSON
Nasser M. Nasrabadi 19b. TELEPHONE NUMBER (Include area code)
UL
18
(301) 394-0806 Standard Form 298 (Rev. 8/98) Prescribed by ANSI Std. Z39.18
ii
Contents
List of Figures
iv
1.
Objective
1
2.
Approach
1
2.1
Joint Fusion and Detection Using SAR and HS at the Pixel Level.................................2
2.2
Nonlinear Joint Fusion and Detection Using SAR and HS at the Pixel Level................4
3.
Results
5
4.
Conclusions
7
Distribution List
8
iii
List of Figures Figure 1. A sliding dual window: an IWR and an OWR. ..............................................................2 Figure 2. (a) HS image, (b) SAR image, (c) RX detected mines for HS, (d) RX detected mines for SAR, (e) kernel RX detected mines for HS, (f) kernel RX detected mines for SAR, (g) joint linear fusion/detection RX results, and (h) joint nonlinear fusion/detection KRX results................................................................................................................................6 Figure 3. The ROC plots for the conventional RX and kernel RX algorithms...............................7
iv
1. Objective The recent availability of accurately geo-located, multisensor data (collected as part of the Wide Area Airborne Mine Detection program) has created unprecedented opportunities for the exploration of multisensor, target detection algorithms. Even with this high-fidelity data set, the sensor fusion task still presents many daunting challenges. The objective of this Director’s Research Initiative (DRI) investigation is to develop a nonlinear joint fusion and detection technique for mine detection applications using two different types of sensor data—synthetic aperture radar SAR data and hyperspectral sensor (HS) data. A well-known anomaly detector, called the RX algorithm,1 is extended to perform fusion and detection simultaneously at the pixel level by appropriately concatenating the information from the two sensors. This approach is then extended to its nonlinear version. The nonlinear fusion-detection approach is based on the statistical kernel learning theory which explicitly exploits the higher-order dependencies (nonlinear relationships) between the two types of sensor data through an appropriate kernel.
2. Approach The main purpose of this DRI project is to nonlinearly fuse the information contents in HS and SAR imagery to effectively detect targets of interests (buried and surface mines). Because of the significant differences in basic physical properties and signal dimensionality between these two sensors, fusion of the raw or processed data from these sensors might mitigate the false alarm rate significantly for anomaly detection purposes. In the previous DRI project (FY05), the main focus was on co-registration of the SAR and HS image data. Individually linear and nonlinear signal detection tools for HS and SAR imagery were developed.2 In this DRI report, the nonlinear joint fusion and detection technique is summarized and its detection performance on several mine imageries is reported. The proposed approach is to extend the well-known RX anomaly detector and its nonlinear version (the kernel RX algorithm3) to an integrated multiplesensor data.
1
Reed, S.; Yu, X. Adaptive Multiple-Band CFAR Detection of an Optical Pattern With Unknown Spectral Distribution. IEEE Trans. on Acoustics, Speech Signal Process 1994, 38 (10), 1760–1770. 2 Ranney, K.; Rosario, D.; Nasrabadi, N. M. Fusion of Synthetic Aperture Radar and Hyperspectral Imagery; DRI proposal FY05-SED-35 and the final report FY06; U.S. Army Research Laboratory: Adelphi, MD, December 1996. 3
Kwon, H.; Nasrabadi, N. Kernel Orthogonal Subspace Projection for Hyperspectral Signal Classification. IEEE Transactions on Geoscience and Remote Sensing 2005, 43 (12), 2952–2962.
1
2.1
Joint Fusion and Detection Using SAR and HS at the Pixel Level
In the proposed approach, detection and fusion is done at the pixel level by concatenating each HS spectral pixel with its corresponding high-resolution SAR pixels and then processing the concatenated data by the RX anomaly detector. This approach jointly exploits the linear correlation or dependencies between the two sensors in order to simultaneously fuse and detect the objects of interest. In Reed and Yu,1 a spectral anomaly detection algorithm was developed for detecting targets of unknown spectral distribution against a background with unknown spectral covariance. This algorithm is now commonly referred to as the RX anomaly detector, which has been successfully applied to many hyperspectral target detection applications. It is now considered as the benchmark anomaly detection algorithm for multispectral/hyperspectral data. The RX algorithm is a constant false alarm rate (CFAR) adaptive anomaly detector which is derived from the Generalized Likelihood Ratio Test. The RX algorithm is based on exploiting the difference between the spectral signatures of an input pixel with its surrounding neighbors. This distance comparison is very similar to the Mahalanobis distance measure calculated by comparing the corresponding wavelengths (spectral bands) of two measurements. The RX algorithm assumes that the covariance of the background clutter is unknown or calculated from the data. In the conventional RX algorithm, a nonstationary local mean is subtracted from each spectral pixel. The local mean μ b is obtained by sliding a double concentric window (a small inner window region [IWR] centered within a larger outer window region [OWR]; see figure 1) over every spectral pixel in the image and calculating the mean of the spectral pixels falling within the outer window. The size of the inner window is assumed to be the size of the typical target of interest in the image. The residual signal after mean subtraction is assumed to approximate a zero-mean pixel-to-pixel independent Gaussian random process. Let each input spectral signal consisting of J spectral bands be denoted by x(n) = (x1 (n), x 2 (n),…, x J (n)) T . Define X b to be a J × M matrix of M centered (mean-removed) reference background clutter pixels (or pixels in the outer window). Each observation spectral pixel is represented as a column in the sample matrix X b = [x(1), x(2),…, x(M)] . OWR
r
μ
b
IWR
Figure 1. A sliding dual window: an IWR and an OWR.
2
Consider a test pixel
r ij
at pixel location ij. The RX algorithm output at each pixel is given by
the following:
δ rx (rij ) = (rij − μˆ b )T Cˆ b-1 (rij − μˆ b ) ,
(1)
where rij represents the pixel under consideration located at the center of the IWR, μˆ b represents
ˆ is the estimated covariance matrix of the estimated mean of the pixels within the OWR, and C ˆ = (1/N) X X T . the pixels within the OWR given by C b
b
The size of the dual window is set such that the IWR encloses a target-sized region and the OWR includes its surrounding region. If the dual window is placed within a spatially homogeneous region consisting of similar types of materials, such as natural backgrounds, the statistical characteristics of the IWR and OWR will be similar to each other. The IWR and OWR will contain significantly different statistical features if the dual window is centered on a region where the target is surrounded by the local background. Use of appropriate thresholding on the RX output (equation 1) allows most targets to be detected as anomalies. The dual window RX algorithm (equation 1) is easily applied to each HS pixel since these pixels are already in vector form. However, in the case of high resolution SAR each co-registered HS pixel corresponds to a block of pixels in the SAR image due to the difference in spatial resolution between the SAR and HS. For SAR imagery we group all the pixels that physically correspond to a single HS pixel and represent them as a SAR vector pixel. This process is done for each corresponding HS pixel in order to form a SAR cube image of the same spatial resolution as HS image. It should be noted that the number of corresponding SAR pixels to each HS pixel will obviously be different from the number of spectral bands in HS. Now the RXalgorithm can be applied separately to the HS and SAR cubes of the same resolution to obtain the anomalies from each sensor data. To develop an RX-like joint fusion and anomaly detection algorithm, let each pixel located at (i, j) in the HS image be represented by a vector xh (i ,j) consisting of J spectral bands and the corresponding block of pixels centered at (i, j) be represented by xs (i, j) consisting of P pixels since for practical platforms, the SAR image has much higher resolution than the HS sensor. Furthermore, let the concatenated vectors from the two sensors corresponding to the same HS pixel location (i, j) after normalization be represented by a partition vector xhs (i, j) = ⎡ x h (i, j ) ⎤ ⎢ x (i, j ) ⎥ , where xh (i, j) and xs (i, j) are the pixels under consideration at the center of the dual ⎣ s ⎦ window in the HS and SAR images, respectively. Applying the RX algorithm on the concatenated data x h (i, j) is given by the following:
3
δ
hs rx
T
⎡ x h ( i , j ) ⎤ ⎡ μˆ h ⎤ ⎞⎟ ⎛ Cˆ hh ⎜ ⎥ ⎢ x (i, j ) ⎥ − ⎢ ⎜ ⎣ s ⎦ ⎢⎣ μˆ s ⎦⎥ ⎟⎠ ⎝ Cˆ sh
⎛ ( i,j ) = ⎜ ⎜ ⎝
Cˆ hs ⎞⎟ Cˆ ss ⎟⎠
−1
⎛ ⎜ ⎜ ⎝
⎡ x h ( i , j ) ⎤ ⎡ μˆ h ⎤ ⎞⎟ ⎥ , ⎢ x (i, j ) ⎥ − ⎢ ⎣ s ⎦ ⎢⎣ μˆ s ⎦⎥ ⎟⎠
where μˆ h and μˆ s are the estimated means of all the pixels ( X h and
Xs )
(2)
in the corresponding
outer windows and Cˆ hh and Cˆ ss are the estimated covariance matrices of the HS and SAR data, respectively. In equation 2, the linear correlation between the HS and SAR data is exploited through the inverse covariance matrix of the concatenated data. If the SAR data is not linearly ˆ = 0 in equation 2, then the joint fusion/detection algorithm is correlated to the HS data Cˆ hs = C ss the same as performing the RX on each sensor data separately and adding the results. 2.2 Nonlinear Joint Fusion and Detection Using SAR and HS at the Pixel Level One way to exploit the higher-order correlation between the two data is to explicitly map each sensor data into a higher dimension by a nonlinear mapping. For example, assume the input hyperspectral data is represented by the data space ( X ⊆ R d ) and F is a feature space associated with X by a nonlinear mapping function.
Φ : X →F xh (i, j) Φ(xh (i, j)) ,
(3)
where xh (i, j) is an input vector which is mapped into a potentially much higher (possibly infinite) dimensional feature space. Any linear anomaly technique can now be remodeled into this high-dimensional feature space by replacing the original input data xh (i,j) with the mapped data Φ ( x ( i , j)) = x ( i , j ) . Due to the high dimensionality of the feature space, F, it is h
h
Φ
computationally not feasible to directly implement any algorithm in this feature space. However, kernel-based learning techniques use an effective kernel trick given by the following:
k ( x, y ) = < Φ ( x), Φ (y ) > = Φ ( x) T Φ ( y ) ,
(4)
which implements a dot product between two vectors in the feature space by employing a kernel function k associated with the nonlinear mapping Φ . Using the kernel trick representation (equation 4), allows us to implicitly compute the dot products in F without mapping the input vectors into F . Therefore, in the kernel methods, the mapping function, Φ , does not have to be identified. A dot product in F can be avoided and replaced by a kernel function, k, a nonlinear function which can be easily calculated without identifying the nonlinear map, Φ . A preferred kernel to utilize is the Gaussian radial basis function kernel: ⎛− x−y 2 ⎞ ⎟ , where σ > 0 is a constant. k (x, y) = exp ⎜⎜ ⎟ σ ⎜ ⎟ ⎝ ⎠
4
Kwon and Nasrabadi3 show how to extend the RX algorithm given by equations 1 or 2 to a nonlinear version (so-called kernel RX) by using the idea of kernel-based learning theory. The kernel version of the linear RX algorithm3 for HS and SAR sensor data is given by equations 5 and 6, respectively.
δ KRX (i , j ) = (k x − k μ ) K x (k x − k μ ),
(5)
s ˆ −2 (k − k ) δ KRX (i, j ) = (k x s − k μ s )T K x ss xs μs ,
(6)
h
−2
T
h
h
hh
h
h
and
where k x h = k ( X h , x h (i, j )) , k x s = k ( Xs , xs (i, j )) , k μ = k (X h , μ h ( i , j )), and h
k μ = k (X s , μ s (i , j )) are the kernel empirical expansion maps and similarly, s K x hh = K ( X h , X h ) = (K )ij and K x ss = K ( Xs , Xs ) = (K )ij are N × N kernel (gram) matrices whose
entries are the dot products 〈Φ(x h (i)), Φ(x h ( j ))〉 and 〈Φ(x s (i)),Φ(x s ( j ))〉 , respectively. X h and Xs are matrices whose columns represent the data in the outer window of HS and SAR, respectively. The kernel RX version for the concatenated data is given by the following: hs δ KRX (i, j ) = (k x hs − k μ ) T K −x2hs (k x hs − k μ ) , hs hs
(7)
where k x hs = k x h + k x s , k μ hs = k μ h + k μ s , and K x hs = K x hh + K xss , which is a N × N kernel matrix whose entries are the dot products.
(K x ) ij = k (x hs (i ), x hs ( j )) = 〈{Φ (x h (i )), Φ (x s (i ))},{Φ (x h ( j )), Φ (x s ( j ))}〉 hs
= 〈{Φ (x h (i )), Φ (x h ( j ))}〉 + 〈{Φ (x s (i )), Φ (x s ( j ))}〉.
(8)
Using different kernel functions or appropriately weighting the kernel functions for HS or SAR can achieve different fusion results.
3. Results The hyperspectral mine image consists of 70 bands over the spectral range of 8–11.5 μm , which includes the long-wave infrared band. The SAR images used were produced from a SAR sensor operating in the high- and low-frequency range. Figure 2a and b shows the co-registered SAR and HS images, which contain surface mines and disturbed soil representing buried mines, respectively. The RX anomaly detector has been implemented, as well as the kernel RX, to detect mines in SAR and HS images separately and on concatenated SAR/HS data to obtain a
5
(a) Original HS
(b) Original SAR
(c) RX_HS
(d) RX_SAR
(e) KRX_HS
(f) KRX_SAR
(g) Fused RX
(h) Fused KRX
Figure 2. (a) HS image, (b) SAR image, (c) RX detected mines for HS, (d) RX detected mines for SAR, (e) kernel RX detected mines for HS, (f) kernel RX detected mines for SAR, (g) joint linear fusion/detection RX results, and (h) joint nonlinear fusion/detection KRX results.
6
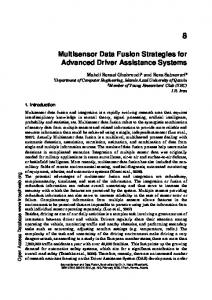
joint fusion/detection algorithm. Figure 2a and b shows the original HS and SAR images of the same region that are processed, respectively. Results of the RX algorithm and kernel RX are shown in figure 2c–f. Figure 2g and h shows the joint linear and nonlinear fusion/detection results using the concatenated data, and the ROC curves are represented in figure 3. It is clear from figure 3 that the nonlinear joint fusion/detection algorithm performance exceeds the linear RX as well as the single sensor results.
Figure 3. The ROC plots for the conventional RX and kernel RX algorithms.
4. Conclusions A nonlinear fusion algorithm for detection of surface and buried mines has been designed. Nonlinear pixel level joint fusion and detection were developed based on the in-house kernel RX algorithm. The nonlinear correlation between the SAR and HS data was exploited in the pixelbased fusion and detection algorithm. Use of different kernels as well as developing procedures for weighting the kernels is still to be investigated.
7
NO. OF COPIES ORGANIZATION 1 DEFENSE TECHNICAL (PDF INFORMATION CTR ONLY) DTIC OCA 8725 JOHN J KINGMAN RD STE 0944 FORT BELVOIR VA 22060-6218 1
DIRECTOR US ARMY RESEARCH LAB IMNE ALC IMS 2800 POWDER MILL RD ADELPHI MD 20783-1197
1
DIRECTOR US ARMY RESEARCH LAB AMSRD ARL CI OK TL 2800 POWDER MILL RD ADELPHI MD 20783-1197
1
DIRECTOR US ARMY RESEARCH LAB AMSRD ARL CI OK T 2800 POWDER MILL RD ADELPHI MD 20783-1197
1
DIRECTOR US ARMY RESEARCH LAB AMSRD ARL RO EV W D BACH PO BOX 12211 RESEARCH TRIANGLE PARK NC 27709 ABERDEEN PROVING GROUND
1
DIR USARL AMSRD ARL CI OK TP (BLDG 4600)
8
NO. OF COPIES ORGANIZATION 1
US ARMY CERDEC NVESD AMSRD CER NV OD J RATCHES 10221 BURBECK RD STE 430 FT BELVOIR VA 22060-5806
2
US ARMY CERDEC NVESD AMSRD CER NV ST J HILGER P PERCONTI 10221 BURBECK RD STE 430 FT BELVOIR VA 22060-5806
1
US ARMY CERDEC NVESD AMSRD CER NV MS R DRIGGERS 10221 BURBECK RD STE 430 FT BELVOIR VA 22060-5806
1
US ARMY RDECOM AMRDEC AMSRD AMR SG IP H ANDERSON BLDG 5400 REDSTONE ARSENAL AL 35898
1
US ARMY RDECOM AMRDEC AMSRD AMR SG W PITTMAN BLDG 5400 REDSTONE ARSENAL AL 35898
1
1
1
1
NO. OF COPIES ORGANIZATION
US ARMY RDECOM AMRDEC AMSRD AMR SG IR R SIMS BLDG 5400 REDSTONE ARSENAL AL 35898 US ARMY RDECOM AMRDEC AMSRD AMR WS PL W DAVENPORT BLDG 7804 REDSTONE ARSENAL AL 35898 US ARMY AVN & MIS CMND AMSAM RD W C MCCORKLE REDSTONE ARSENAL AL 35898-5240 US ARMY NATICK RDEC ACTING TECHL DIR SBCN TP T P BRANDLER KANSAS ST BLDG 79 NATICK MA 01760-5056
9
1
US ARMY TACOM AMSRD TAR R G R GERHART MS 263 6501 E ELEVEN MILE RD WARREN MI 48397-5000
1
COMMANDER US ARMY TRADOC SCIENCE & TECHLGY DIV ATFC J KINCAID FT MONROE VA 23651-5850
1
US ARMY ARDEC AMSTA AR A BLDG 1 PICATINNY ARSENAL NJ 07806-5000
1
US ARMY RDECOM ARDEC RADIOGRAPHIC LAB AMSRD AAR AEP S P WILLSON BLDG 94 PICATINNY ARSENAL NJ 07806-5000
1
US ARMY RDECOM ARDEC RADIOGRAPHIC LAB AMSRD AAR AEP S J ROMANO BLDG 924 PICATINNY ARSENAL NJ 07806-5000
1
US ARMY TRADOC BATTLE LAB INTEGRATION & TECHL DIR ATCH B 10 WHISTLER LANE FT MONROE VA 23651-5850
1
COMMANDER USAISEC AMSEL TD BLAU BLD 61801 FT HUACHUCA AZ 85613-5300
2
DARPA J RICKLIN S WELBY 3701 N FAIRFAX DR ARLINGTON VA 22203-1714
NO. OF COPIES ORGANIZATION 1
NGA R S RAND MS DN 11 12310 SURSISE VALLEY DR RESTON VA 20191-3449
1
AFRL/SNAA M JARRATT AREA B BLDG 620 2241 AVIONICS CIR WPAFB OH 45433-7321
NO. OF COPIES ORGANIZATION 1
DIRECTOR US ARMY RESEARCH LAB AMSRD ARL RO M R ZACHERY BLDG 4300 RM 249 PO BOX 12211 RSRCH TRIANGLE PARK NC 27703
1
DIRECTOR US ARMY RESEARCH LAB AMSRD ARL RO MM H CHANG BLDG 4300 RM 249 PO BOX 12211 RSRCH TRIANGLE PARK NC 27703
1
CMTCO A SUZUKI 1030 S HIGHWAY A1A PATRICK AFB FL 23925-3002 1
3
SITAC H STILES K WHITE R DOWNIE STE 500 11981 LEE JACKSON MEMORIAL HWY FAIRFAX VA 22033-3309
DIRECTOR US ARMY RESEARCH LAB AMSRD ARL SE J PELLEGRINO BLDG 207 RM 4D-28 2800 POWDER MILL RD ADELPHI MD 20783-1197
1
US MILITARY ACADEMY MATHEMATICAL SCIENCE CTR OF EXCELLENCE PHOTONICS CENTER THAYER HALL RM 226C J HARTKE WEST POINT NY 10996-1786
DIRECTOR US ARMY RESEARCH LAB AMSRD ARL SE N SROUR BLDG 202 RM 3G124 2800 POWDER MILL RD ADELPHI MD 20783-1197
1
DIRECTOR US ARMY RESEARCH LAB AMSRD ARL RO MI L DAI BLDG 4300 PO BOX 12211 RSRCH TRIANGLE PARK NC 27703
DIRECTOR US ARMY RESEARCH LAB AMSRD ARL SE S J EICKE BLDG 202 RM 3G020 2800 POWDER MILL RD ADELPHI MD 20783-1197
1
DIRECTOR US ARMY RESEARCH LAB AMSRD ARL SE SE N NASRABADI BLDG 204 RM 2C118 2800 POWDER MILL RD ADELPHI MD 20783-1197
1
1
1
DIRECTOR US ARMY RESEARCH LAB AMSRD ARL RO MM D ARNEY BLDG 4300 PO BOX 12211 RSRCH TRIANGLE PARK NC 27703
10
NO. OF COPIES ORGANIZATION 1
1
NO. OF COPIES ORGANIZATION
DIRECTOR US ARMY RESEARCH LAB AMSRD ARL SE SE L KAPLAN BLDG 202 RM 3F082 2800 POWDER MILL RD ADELPHI MD 20783-1197 DIRECTOR US ARMY RESEARCH LAB AMSRD ARL SE SE A CHAN BLDG 202 RM 3F068 2800 POWDER MILL RD ADELPHI MD 20783-1197 ABERDEEN PROVING GROUND
1
DIRECTOR USAMSAA AMSRD AMS SC J MAZZ BLDG 328 RM 155 392 HOPKINS RD APG MD 21005-5071
1
DIRECTOR USAMSAA AMSRD AMS SC G KISTNER BLDG 392 RM 201A 392 HOPKINS RD APG MD 21005-5071
1
DIRECTOR USAMSAA AMSRD AMS SC R WHEELER 392 HOPKINS RD APG MD 21005-5071
1
US ARMY SOLDIER & BIOLOGICAL CHEMICAL CMND EDGEWOOD CHEMICAL & BIOLOGICAL CTR AMSSB RRT DP W LOEROP BLDG E 5554 APG MD 21020-5424
11
1
US ARMY ATC CSTE DTC AT TC N D JENNINGS 400 COLLERAN RD APG MD 21005-5059
1
US ARMY ATC CSTE DT AT WC A F CARLEN BLDG 355 400 COLLERAN RD APG MD 21005-5009
2
DIR USARL AMSRD ARL WM BF W OBERLE AMSRD ARL VT UV G HAAS
INTENTIONALLY LEFT BLANK.
12