Note: On-line weak signal detection via adaptive ... - Semantic Scholar
Recommend Documents
At the stage of performance .... to a scalar, taking the vectorization operation of both sides of (3) results in .... Taking the same fashion as that of (29), we have the ...
Jan 8, 2016 - Abstract. One of the practical applications of the weak measurement proposed by Aharonov and his colleague is the signal amplification, which ...
Abstract. Aiming at the difficult problem of weak signal detection, a weak signal detection method based on the compound system for weak signal with unknown ...
REDUCTION IN JPEG IMAGE. H. C. Kim* and H. W. Park. Dept. Informatiom and Communication Eng., KAIST. 207-43 Cheongryangni, Dongdaemungu.
Thus, by constructing D cost functions ,Jk, k = 1, . . . . D, as in (2.6) and ..... based algorithm AN will have an edge over AA and AE under nonstationary signal ...
J. Luo was with the Department of Electrical Engineering, Center for. Electronic Imaging Systems ... He is now with the Image Science Technology Laboratory, Imaging. Research and Advanced Development, Eastman Kodak Company, Rochester, ...... where he
Figure 5: Example analysis of the first 5 s of Chopin's Nocturne. Op. 9 No. 1 in form of a piano-roll plots. From top to bot- tom: the ground truth (MIDI data), notes ...
PRIMER ON SIGNAL DETECTION THEORY. Signal detection involves the perception of some information from the environment (the signal) and a decision ...
30. 35. 40. 45. 50. Spectrum of the ATSC DTV signal. Frequency (MHz). M a g n itu ..... [2] H.Urkowitz, âEnergy detection of unknown deterministic signals,â Proc.
Fuzzy Signal Detection Theory (FSDT) has the potential of enhancing ... tasks in which precision of Signal Detection Theory (SDT) analysis is limited by discrete ...
ABSTRACT. We propose a novel, online adaptive one-class support vector machines algorithm for anomaly detection in crowd scenes. Integrating incremental ...
ABSTRACT. We propose a novel, online adaptive one-class support vector machines algorithm for anomaly detection in crowd scenes. Integrating incremental ...
Jun 20, 2005 - and Rodman [LR]. Two notions of linearization are to be examined. The weaker form is most frequently used and is defined as follows: An ln ...
Twitter Sentiment Detection via Ensemble Classification. Using Averaged Confidence Scores. Matthias Hagen, Martin Potthast, Michel Büchner, and Benno ...
The edge detection algorithm based on adaptive threshold which is obtained by ..... current research interests include wireless communication technology,.
However, in case of sentiment detection in tweets, acquiring training data typically ..... Android phone), or events (e.g., Japan earthquake, NHL playoffs) [28, 38].
Viterbi-like receiver (e.g., partial response maximum likelihood, ... The first block is a Viterbi-like detector. ..... are not bit error rates, but (raw) symbol error rates.
Computer Aided Diagnosis and Therapy Group. Siemens Medical Solutions, Inc. 51 Valley Stream Parkway, Malvern, PA 19355. {jinbo.bi, senthil.periaswamy, ...
bearings local damage detection in complex mining mechanical ... weak signal recovery from raw vibration signals captured from complex mechanical ... (selection of parameters for data acquisition system, choice of signal ... DRIVE. PULLEY. Fig 2. Dia
tion with locally adaptive saliency map fusion via solving an energy optimization problem over a graph. It is evaluated on a benchmark dataset and compared to ...
Sep 6, 2018 - 33â35, 97, 107â113, 153â166, and 221â224). ..... Author Contributions: Y.D. and B.D. conceived, designed and performed the experiments; ...
Aug 1, 2010 - *Corresponding author: [email protected]. Received April 13 ... field at the proximal location of the signal light spot, and the total light field ...
exploration in Chaos control using engineering signal detection. ... that chaotic oscillator can be used in detecting weak signal under noise[1]. Duffing oscillator ...
Mar 7, 2018 - X: 500. Y: 0.1. 0. 0.05. 0.1. 0.15. Am p litude (m. ·ï¼. â2. ) 200. 400. 600. 0. Frequency (Hz). (b). Figure 4: The time domain and spectrum of the ...
Note: On-line weak signal detection via adaptive ... - Semantic Scholar
Jun 24, 2014 - This article is copyrighted as indicated in the article. Reuse of AIP content is subject to the terms at: http://scitationnew.aip.org/termsconditions.
Note: On-line weak signal detection via adaptive stochastic resonance Siliang Lu, Qingbo He, and Fanrang Kong Citation: Review of Scientific Instruments 85, 066111 (2014); doi: 10.1063/1.4884715 View online: http://dx.doi.org/10.1063/1.4884715 View Table of Contents: http://scitation.aip.org/content/aip/journal/rsi/85/6?ver=pdfcov Published by the AIP Publishing Articles you may be interested in Agent-based station for on-line diagnostics by self-adaptive laser Doppler vibrometry Rev. Sci. Instrum. 84, 121703 (2013); 10.1063/1.4845475 A waveguide invariant adaptive matched filter for active sonar target depth classification J. Acoust. Soc. Am. 129, 1813 (2011); 10.1121/1.3557041 Direct detection and time-locked subsampling applied to pulsed electron paramagnetic resonance imaging Rev. Sci. Instrum. 76, 053709 (2005); 10.1063/1.1903163 Adaptive notch filter-based signal processing method and system for vortex flowmeters Rev. Sci. Instrum. 72, 2219 (2001); 10.1063/1.1351832 Digital signal processor-based dc superconducting quantum interference device controller Rev. Sci. Instrum. 72, 2203 (2001); 10.1063/1.1350646
This article is copyrighted as indicated in the article. Reuse of AIP content is subject to the terms at: http://scitationnew.aip.org/termsconditions. Downloaded to IP: 218.22.21.3 On: Wed, 25 Jun 2014 00:55:29
REVIEW OF SCIENTIFIC INSTRUMENTS 85, 066111 (2014)
Note: On-line weak signal detection via adaptive stochastic resonance Siliang Lu, Qingbo He,a) and Fanrang Kong Department of Precision Machinery and Precision Instrumentation, University of Science and Technology of China, Hefei, Anhui 230026, People’s Republic of China
(3) where h is the calculation step, and S[n], N[n], x[n] represent the discrete forms of S(t), N(t), and x(t), respectively. It can be noted that the SR output x[n] is dominated by the parameters a, b, γ , and h. Without loss of generality, we set a = 1, b = 1, γ = 0.5 for simplify in this study. After that, h becomes the solo parameter that affects the SR realization along with the WSD performance. Subsequently, we numerically evaluate the interaction between the parameter h and the output SNR to reveal the WSD effect. The SNR equals 10log10 (Psignal /Pnoise ) with Psignal and Pnoise being the powers of the signal and the total noise in the spectrum, respectively. The test signals are the sinusoids with A = 10 Vpp , fd = 50 Hz, 75 Hz, and 100 Hz, respectively. The −10 dB AWGNs are injected to the sinusoids separately. The calculated SNRs of the SR output signals with varying h are plotted in Fig. 2. It can be seen that the output SNR has opportunities to surpass the input SNR (denoted by the dashed line), i.e., the noise is suppressed and the weak signal is enhanced, by tuning the parameter h. Moreover, the optimal h values for different driving frequencies are different as marked by the arrows in Fig. 2. This is the basis of the proposed adaptive SR technique for on-line WSD, namely, by adjusting the calculation step h, the frequency of the SR output can be just coincided
This article is copyrighted as indicated in the article. Reuse of AIP content is subject to the terms at: http://scitationnew.aip.org/termsconditions. Downloaded to IP: 218.22.21.3 On: Wed, 25 Jun 2014 00:55:29
066111-2
Lu, He, and Kong
Rev. Sci. Instrum. 85, 066111 (2014)
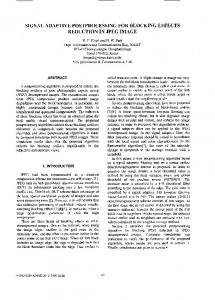
FIG. 1. Schematic model of the bistable SR system.
with that of the driving signal and hence the weak signal can be detected.10 In the following, the proposed technique is implemented in a prototype instrument. The hardware system consists of a computer, an analog-to-digital converter (ADC), a microcontroller unit (MCU), a digital-to-analog converter (DAC), and an oscilloscope, as shown in the right of Fig. 3(a). The detailed types of the instrument components and their purposes in this instrument are also provided in Fig. 3(a). The experimental setup, the instrument wiring diagram, and the pseudo-code are provided in the supplementary material.12 As indicated in Fig. 2, the WSD can be realized by tuning the parameter h; however, a metric is needed to adaptively estimate whether h has been optimized for on-line WSD. This can be achieved via a digital zero crossing detection (DZCD) system with the detailed algorithm flow chart as shown in the left of Fig. 3(a). Here, two explanations for the DZCD are presented as: (1) the “zero point” is the on-line mean of the output signal rather than the fixed “absolute zero,” as we found such a configuration is more effective in practical experiments; and (2) only the rising edge is utilized to trigger the DZCD. A crucial step in the signal processing part is to calculate the difference of the zero crossing point intervals, ∇z, as illustrated in Fig. 3(b) (4 ∇z are used in this study). If all the calculated ∇z are less than a threshold T (T = 10 sampling points in this study), we can conclude that the analyzed signal is periodic and the optimal h has been obtained, and then stop varying h. Moreover, the on-line WSD detection is performed via a running timer embedded in the MCU. Every calculated output point, x[n], can be obtained within a timer interval (100 μs in this study, corresponding to 10 kHz sampling frequency).
FIG. 2. Effect of tuning calculation step h for noisy signals with different driving frequencies.
FIG. 3. (a) Algorithm flow chart (left) and instrument system (right), and (b) illustration of the DZCD system.
Subsequently, a test is conducted to evaluate the practical performance of the prototype instrument. The test includes three parts: (1) fd jumps from 0 to 50 Hz, (2) fd jumps from 50 Hz to 100 Hz, and (3) fd jumps from 100 Hz to 50 Hz. The noise intensity is set as −10 dB in all the parts. The visual on-line WSD effect can be viewed in the multimedia, and four captures in the multimedia are shown in Figs. 4(a)–4(d), respectively. To better examine the periodicity of the output signal, a synchronous zero crossing trigger signal (both the rising edge and the falling edge are considered) corresponding to the output signal is also provided in each subfigure. The parameter h keeps varying until the output signal presents good periodicity; typically, such a process can be finished in seconds. Figs. 4(b) and 4(d) display the stable output signals (h stop varying) driven by noisy 50 Hz and 100 Hz signals, respectively. It can be seen that the output signals are almost noise-free with good periodicities, even though the original sinusoids are corrupted by the heavy injected noise. These results verify the effectiveness of the proposed adaptive SR technique in on-line WSD. Besides the above visual demonstration, the quantitative analyses based on the off-line captured signals are also conducted as follows. We use two metrics to evaluate the performance of the prototype instrument for WSD as: (1) SNR, which reflects the proportions of the periodic signal and
This article is copyrighted as indicated in the article. Reuse of AIP content is subject to the terms at: http://scitationnew.aip.org/termsconditions. Downloaded to IP: 218.22.21.3 On: Wed, 25 Jun 2014 00:55:29
066111-3
Lu, He, and Kong
FIG. 4. Effects of on-line WSD with dynamically varying h in addressing noisy signals with different frequencies (upper: input noisy signal; middle: output signal; lower: synchronously trigger signal, in each subfigure): (a) unstable output (parameter search process) in detecting noisy 50 Hz signal, (b) stable output in detecting noisy 50 Hz signal, (c) unstable output in detecting noisy 100 Hz signal, and (d) stable output in detecting noisy 100 Hz signal. (Multimedia view) [URL: http://dx.doi.org/10.1063/1.4884715.1].
the noise in spectrum; and (2) adjust R-square,13 which reflects the waveform fidelity, namely, a higher adjust R-square implies a purer sinusoid with lower distortion. The results in considering different driving frequencies and noise levels are illustrated in Fig. 5. The averaged increased SNR is calculated to be 20 dB and the averaged increased adjust R-square is 500 percent as compared to the input noisy signals. Specially, the adjust R-square of the output signal is very close to 1, which indicates that the output signal is almost a pure sinusoid (also confirmed in Figs. 4(b) and 4(d)). The results indicate that the adaptive SR algorithm has a good anti-noise capability while avoiding signal waveform distortion. SR can be regarded as a specific noise-assisted filter, but this filter is different from the traditional filters that focus on
FIG. 5. Quantitative analyses of WSD for different driving frequencies and different noise levels: (a) SNR, and (b) adjust R-square.
Rev. Sci. Instrum. 85, 066111 (2014)
noise suppression, as it utilizes the noise to enhance the weak signal. Such a distinct merit is plenty useful especially when the target signal frequency is involved in the noise bandwidth. A main contribution of this work is that we propose a novel adaptive SR technique and embed it in a prototype instrument for on-line WSD. Additionally, the proposed algorithm presents low computation complexity and low memory usage features, and hence it can be implemented in a generalpurpose MCU conveniently. Indeed, the algorithm can be more effective if more parameters are tuned jointly (e.g., a, b, γ , h), and more intelligent if the simple linear search algorithm used in this study is replaced by some optimization algorithms. In conclusion, a novel adaptive SR technique is proposed and implemented in a prototype instrument for on-line WSD in this Note. By tuning the calculation step h, the optimal matching relation among the weak signal, the noise and the potential can be obtained, and then a low-noise SR output signal can be presented on line. This work makes the SR-based WSD technique simpler and more effective in practical application. The proposed algorithm can be transplanted to other platforms easily, and the hardware system can be fabricated in a low-power portable device. The designed instrument shows potential applications on on-line signal filtering, signal detection, and waveform restoration. This work is supported by the National Natural Science Foundation of China under Grant Nos. 11274300 and 51075379, and the Program for New Century Excellent Talents in University, China, under Grant No. NCET-13-0539. 1 M.
I. Dykman and P. V. E. McClintock, Nature (London) 391, 344 (1998). Gammaitoni, P. Hanggi, P. Jung, and F. Marchesoni, Rev. Mod. Phys. 70, 223 (1998). 3 N. G. Stocks, Phys. Rev. Lett. 84, 2310 (2000). 4 S. Zozor and P. O. Amblard, Signal Process. 82, 353 (2002). 5 H. O. Chen, P. K. Varshney, S. M. Kay, and J. H. Michels, IEEE Trans. Signal Process. 55, 3172 (2007). 6 R. Almog, S. Zaitsev, O. Shtempluck, and E. Buks, Appl. Phys. Lett. 90, 013508 (2007). 7 B. Xu, H. Zhang, L. Zeng, J. Li, X. Wu, and Z.-P. Jiang, Appl. Phys. Lett. 91, 091908 (2007). 8 X. X. Wu, Z. P. Jiang, and D. W. Repperger, in Proceedings of the American Control Conference, Minneapolis, MN, USA, 14–16 June 2006 (IEEE, 2006), Vols. 1–12, p. 3118. 9 S. Mitaim and B. Kosko, Proc. IEEE 86, 2152 (1998). 10 Q. Li, T. Y. Wang, Y. G. Leng, W. Wang, and G. F. Wang, Mech. Syst. Signal Process. 21, 2267 (2007). 11 D. V. Dylov and J. W. Fleischer, Nat. Photonics 4, 323 (2010). 12 See supplementary material at http://dx.doi.org/10.1063/1.4884715 for the experimental setup, the instrument wiring diagram, and the pseudo code. 13 S. Lu, Q. He, H. Zhang, S. Zhang, and F. Kong, Rev. Sci. Instrum. 84, 026110 (2013). 2 L.
This article is copyrighted as indicated in the article. Reuse of AIP content is subject to the terms at: http://scitationnew.aip.org/termsconditions. Downloaded to IP: 218.22.21.3 On: Wed, 25 Jun 2014 00:55:29