out technical and methodological shortcomings in Johnston and Pattie's analysis ... 1 R. J. Johnston and Charles Pattie, 'Inconsistent Individual Attitudes within ...
B.J.Pol.S. 32, 691–698 Copyright 2002 Cambridge University Press DOI: 10.1017/S0007123402000285 Printed in the United Kingdom
Notes and Comments Attitudes and Measurement Error Revisited: A Reply to Johnston and Pattie PATRICK STURGIS* In a recent Note in this Journal, Johnston and Pattie1 contend that they have discovered an ecological fallacy in the behaviour of the six-item scale2 developed by Heath et al. to measure the ‘left–right’ political value dimension.3 Using data from the first six waves of the British Household Panel Study (BHPS), they show that, while there is remarkable over-time stability in the factor structure of these questions at the aggregate level, when the consistency of individual responses to each item is considered, a very different picture emerges; around 50 per cent of the sample fail to select the same response alternative on successive waves and a third of respondents select a response alternative on the opposite side of the agree/disagree scale from one time to the next. Correlations between the same items over time of around 0.4, they argue, bear out a picture of massive longitudinal instability at the individual level. They contend that these findings lead to two different, but not mutually exclusive, conclusions: that British voters do not have stable political predispositions; or that ‘the scaling instruments analysed here and employed in several of the major surveys of British attitudes are not very good tools for identifying any underlying “stable predispositions” or “values” on basic moral and political issues’.4 This short Note points out technical and methodological shortcomings in Johnston and Pattie’s analysis which lead them to draw unwarranted conclusions about both the validity and reliability of this measurement instrument and the dimensionality and stability of British political values. Technically, by failing to declare missing values in conjunction with not recoding items to correct for question direction effects, they obtain an incorrect and misleading two-factor solution to their principal components analysis. On the methodological front, by looking at each scale item in isolation, they fail to acknowledge an adequate role for measurement error as a cause of longitudinal instability. As I shall show, however, when these items are used in the appropriate manner, they emerge as valid and reliable * Department of Social Psychology, London School of Economics and Political Science. 1 R. J. Johnston and Charles Pattie, ‘Inconsistent Individual Attitudes within Consistent Attitudinal Structures: Comments on an Important Issue Raised by John Bartle’s Paper on Causal Modelling of Voting in Britain’, British Journal of Political Science, 30 (2000), 361–74. 2 Johnston and Pattie’s analysis in fact deals with two different six-item scales which were included in alternate years on the BHPS. As their conclusions applied equally to both scales, for the sake of parsimony this note refers only to the scale included in ‘odd’ years 1991, 1993, 1995, etc. 3 Anthony Heath, Geoffrey Evans and Jean Martin, ‘The Measurement of Core Beliefs and Values: The Development of Balanced Socialist/Laissez Faire and Libertarian/Authoritarian Scales’, British Journal of Political Science, 24 (1994), 115–32. 4 Johnston and Pattie, ‘Inconsistent Attitudes’, p. 361.
692
Notes and Comments
indicators of a single, stable underlying construct and the apparent ecological fallacy disappears. THE DIMENSIONALITY OF THE LEFT–RIGHT SCALE
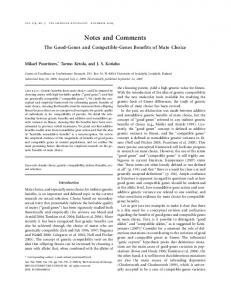
Given that this scale was specifically designed to measure a uni-dimensional ‘left–right’ value construct and that previous studies have confirmed this single-factor structure,5 it is reasonable to ask why Johnston and Pattie should obtain a two-factor solution in the BHPS data – particularly as they offer no substantive interpretation of the second factor obtained in their analysis. Table 1 shows four different factor solutions for the six items of the left–right scale from waves one and three of the BHPS (1991 and 1993, n ⫽ 6,420).6 The first four columns show the two-factor solutions obtained by Johnston and Pattie (Table 6, p. 369) when all items are not recoded to the same direction7 and non-substantive responses are not specified as missing values.8 The fifth and sixth columns show the strong one-factor solution obtained when these actions are performed.9 It seems clear then that the rather unlikely two-factor solution Johnston and Pattie obtained on these items is due to coding errors rather than the existence of a two-dimensional structure underlying responses to the six items.10 This is a non-trivial point, as the dimensionality of this widely used scale has an important bearing on both our understanding of the structure of the value systems of the British public and our ability to use it as either a dependent or an independent variable in statistical models. However, while this technical coding error in their analysis leads to an implausible interpretation concerning the dimensionality of these scale items, the main thrust of their note – that aggregate stability is underpinned by massive ‘churn’ in the measurements at the individual level – remains largely unaffected. Comparing the fifth and sixth columns of Table 1 demonstrates that the stability of the factor structure of these items is impressive whether we code the data correctly or not. ATTITUDES AND MEASUREMENT ERROR
This brings us, then, to the second major problem with Johnston and Pattie’s analysis – the failure to take sufficient account of errors in the measurement of this abstract, directly unobservable construct. The problems associated with measuring hypothetical attitudinal constructs have been recognized for some time now, although practice still 5
Heath et al. ‘Measurement of Core Beliefs’, also report obtaining a strong one factor solution for these items on an independent sample (p. 119). 6 Principal components with varimax rotation. 7 I.e. such that value ‘1’ always indicates a left-wing response and value ‘5’ always indicates a right-wing response on five-point Likert scales. Two of the six items are coded in reverse order to control for question direction effects (see Heath et al. ‘The Measurement of Core Beliefs’, p. 117). 8 Non-substantive responses were coded: ⫺ 9 (missing or wild); ⫺ 7 (proxy respondent); ⫺ 2 (refused); ⫺ 1 (can’t choose). 9 Eigenvalue of first factor ⫽ 2.4, of second factor ⫽ 0.94. Percentage of variance explained by first factor ⫽ 40 per cent. 10 Because the numeric values given to missing observations on these items are in the range ⫺ 9 to ⫺ 1 and the tendency to provide a nonsubstantive response on certain items is positively correlated with the tendency to provide a lower range substantive response on others (i.e. to agree with the proposition in the question), the ‘direction’ in which the items are coded has a non-trivial impact on the factor solution obtained.
1
⫺ 0.11 0.58 0.03 0.68 0.72 0.73
I 0.80 ⫺ 0.37 0.76 0.06 ⫺ 0.07 ⫺ 0.04
II
Missing values not declared 1991
⫺ 0.11 0.57 0.07 0.67 0.71 0.73
I 0.79 ⫺ 0.40 0.75 0.15 ⫺ 0.04 ⫺ 0.09
II
Missing values not declared 1993
Factor Solutions Obtained With and Without Declaring Missing Values
Ordinary people share nation’s wealth One law for rich and one for poor Private enterprise solves economic problems Public services ought to be state owned Govt. has obligation to provide jobs Strong trade unions protect employees
Item
TABLE
0.63 0.66 0.64 0.58 0.62 0.62
Missing values declared 1991 I
0.64 0.66 0.66 0.56 0.60 0.63
Missing values declared 1993 I
Notes and Comments 693
694
Notes and Comments
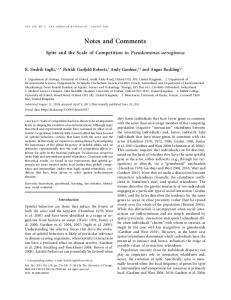
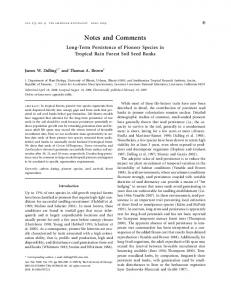
varies considerably in the extent to which explicit recognition is made of and corrective action taken to counteract its attenuating effects.11 Johnston and Pattie’s initial strategy (pp. 363–5) of collapsing the scale items from five to three points (moving from degrees of agreement to simply agree/disagree) implicitly affords a role to random variance in the individual items. However, their assumption that this strategy will eradicate rather than merely reduce the non-systematic variance seems, at best, hopeful. Indeed, there is evidence that making a scale ‘coarser’ by reducing the number of response alternatives may actually serve to increase the proportion of random variance in a scale item relative to a more ‘fine-grained’ alternative.12 A simple, efficient and increasingly common way of reducing errors in the measurement of abstract variables is to use multiple indicators of each construct. The advantages of using multiple indicators are: greater coverage of the conceptual domain; increased precision of measurement; and, most importantly, the ratio of ‘signal’ to ‘noise’ increases with more indicators of the same construct.13 Indeed, these were the explicitly stated motivations for the development of the ‘left–right’ scale in the first place.14 It seems strange then, that Johnston and Pattie should proceed to examine the individual items of the left–right scale as if each one was itself a complete and independent measure of the underlying value dimension. Their contention that the high degree of ‘switching’ on these items is evidence that they may be poor measures of our left–right leanings or that our left–right leanings might not be stable, is not borne out by the simple strategy of summing the six items to form an additive scale. In their research note describing the methodological development of the scale, for example, Heath et al. use this approach and report an over-time correlation of 0.7.15 Similar inter-wave correlations of 0.68 (wave 1 to wave 2) and 0.72 (wave 2 to wave 3) are observed on the BHPS when the same additive scale is derived. This is nearly double the average of 0.39 reported by Johnston and Pattie for each item considered in isolation.16 More sophisticated methods of coping with measurement error increase the stability of the left–right value dimension still further. Figure 1 shows the path diagram for a confirmatory factor model with the ‘left–right’ value dimension measured by the same six items (represented by rectangles in Figure 1) at each wave.17 Two factors account 11 Geoffrey Evans and Jean Martin, ‘Why Are There so Few Formal Measuring Instruments in Social and Political Research?’ CREST Working Paper (58), 1997. 12 E. P. Cox III, ‘The Optimal Number of Response Alternatives for a Scale: A Review’, Journal of Marketing Research, 17 (1980), 407–22. 13 H. Blalock, ‘Estimating Measurement Error using Multiple Indicators and Several Points in Time’, American Sociological Review, 35 (1970), 101–11; D. Wiley and E. Wiley, ‘The Estimation of Measurement Error in Panel Data’, American Sociological Review, 35 (1970), 112–17; Christopher Achen, ‘Mass Political Attitudes and the Survey Response’, American Political Science Review, 69 (1975), 1218–31. 14 G. Evans, A. Heath and M. Lalljee, ‘Measuring Left–Right and Libertarian–Authoritarian Values in the British Electorate’, British Journal of Sociology, 47 (1996), 93–112. 15 Heath et al., ‘Measuring Core Beliefs’, p. 121. 16 Johnston and Pattie, ‘Inconsistent Attitudes’, p. 366. 17 This is essentially the same model used by C. Judd and M. Milburn, ‘The Structure of Attitude Systems in the General Public: Comparisons of a Structural Equation Model’, American Sociological Review, 45 (1980), 627–43; and C.M. Judd, J. Krosnick and A. Milburn, ‘Political Involvement and Attitude Structure in the General Public’, American Sociological Review, 46 (1981), 660–9, to counter Philip Converse’s black-and-white model of attitude holding (Philip Converse, ‘The Nature
Notes and Comments
695
Fig. 1. Longitudinal factor model for the left–right scale
for the variance of each item at each time point: (a) the left–right value dimension (represented by ellipses labelled ‘left–right’ in the path diagram) which constitutes that variance which is shared in common between the items at each wave and (b) a unique factor (represented by ellipses labelled ‘unique’ in the path diagram) which constitutes the variance that is common to each item over waves but is not shared with the other items. Any non-systematic or residual variance in the items (represented by circles labelled ‘e1’ to ‘e18’ in the path diagram) is then removed from the estimation of the correlations between the left–right value dimension across waves.18 Because these residual terms are uncorrelated with any other variables in the model, so long as the model provides an adequate fit to the observed data, we can assume that this error variance is random and therefore self-cancelling in the aggregate. The inter-wave correlations between the left–right value dimension for this model are (F’note continued)
of Belief Systems in Mass Publics’, in D. Apter, ed., Ideology and Discontent (New York: Free Press, 1964)). 18 The model was estimated using Maximum Likelihood in Amos 4.0. A fuller consideration of Confirmatory Factor Analysis and Structural Equation Modelling is beyond the scope of this Note, but see Kenneth Bollen, Structural Equation Modeling with Latent Variables (London, Wiley, 1989) for an excellent in-depth treatment.
696
Notes and Comments
0.89 (w1 to w2); 0.91 (w2 to w3) and 0.87 (w1 to w3), showing near perfect stability over a four-year period during which some true change is likely to have occurred. Model fit statistics indicate that this factorial structure provides an adequate account of the observed data (CFI ⫽ 0.960; RMSEA ⫽ 0.047).19 Using this approach we are able to account for around 80 per cent of the variance in respondents’ left–right position at time two from their position at time one. This compares with the average of 22 per cent reported by Johnston and Pattie for each of the individual items.20 CONCLUSION
Johnston and Pattie’s note raises important issues about the dimensionality, validity and reliability of the ‘left–right’ scale and the stability of the core political values of the British public. However, technical and methodological shortcomings in their analysis lead them to draw incorrect conclusions on all four counts. By failing to deal appropriately with missing values they falsely conclude that this scale possesses a two-dimensional structure and by analysing each item in isolation rather than as a unitary scale they draw overly pessimistic conclusions about the stability of the ideological positions of the British public and the ability of the left–right scale to detect this. Their contention that they have discovered an ecological fallacy in the behaviour of this scale also seems, under closer scrutiny, unwarranted. An ecological fallacy can be said to exist when we observe aggregate stability in the face of individual level volatility. In the current instance, the fallacy would only be apparent if the item level instability really could be said to represent volatility in people’s ‘left–right’ leanings. On the face of it, we certainly see a great deal of volatility in the response alternatives selected on these items but the analyses presented in this note suggest that this volatility is in the measurement of the construct, not volatility in the construct itself. The reason we see aggregate stability in the presence of such a large amount of individual level ‘churn’ is because, as the longitudinal factor model demonstrates, the errors of measurement at the individual level are essentially random and, therefore, self-cancelling. Thus, only the true score variance comes through at the population level.21 If the underlying construct is so stable then should we perhaps conclude that the item level volatility reflects poor item construction and selection? No, for while there is undoubtedly room for improvement in these areas, error is an inherent property of all measurements of directly unobservable phenomena. The important thing is to acknowledge this and make explicit attempts to mitigate against its impact on our estimates of structural parameters.
19
Because Chi Square is very sensitive to sample size and distributional misspecification, alternative measures of model fit, which correct for factors such as sample size and complexity of the model, are frequently used when sample sizes are large and/or when many parameters are being estimated. L. Hu and P. Bentler, ‘Cutoff Criteria for Fit Indexes in Covariance Structure Analysis: Conventional Criteria Versus New Alternatives’, Structural Equation Modeling, 6 (1999), 1–55, advocate the use of the Comparative Fit Index (CFI) in conjunction with the Root Mean Square Error of Approximation (RMSEA). They suggest cut-off criteria of ⬎ 0.95 for CFI in conjunction with values of RMSEA ⬍ 0.06 for acceptable model fit. 20 Johnston and Pattie, ‘Inconsistent Attitudes’, p. 366. 21 Philip Converse, ‘Attitudes and Non-attitudes’, in E. Tufte, ed., The Quantitative Analysis of Social Problems (Reading, Mass.: Addison-Wesley, 1970).
Notes and Comments
697
Are Inconsistent Individual Attitudes Nothing More Than Random Error? A Response to Sturgis R. J. JOHNSTON
AND
C. J. PATTIE*
Sturgis’s Note regarding our article (which precedes this) is an intriguing paradox, since he criticizes much of our methodology and yet concludes that the ‘main thrust’ of our work ‘remains largely unaffected’ by those criticisms. In the first part, the core of Sturgis’s criticism relates to our principal components (not factor) analyses of attitudinal data from the first six waves of the British Household Panel Study (BHPS) – which began in 1991, and so predated the 1993 paper that Sturgis refers to.1 In particular, Sturgis focuses on our (1) assumed ‘failure to declare missing values’; and (2) ‘not recoding items to correct for question direction effects’. On the first, there is no basis for the assumption, as is clear from the introductory summary data in Table 1 of our article.2 On the second, we cannot see why recoding items for question direction would in any way affect the outcome of the factor analyses: all that it would do is change signs – the negative correlations and loadings would become positive, and the component structure would be otherwise unaffected.3 Sturgis claims to have identified a ‘strong one-factor solution’ in the two analyses reported in the final columns of his Table 1. But in each case the associated eigenvalue is 2.35, or 39.1 per cent of the total variance, and the largest loadings (0.66) indicate that the factor accounts for only 43.6 per cent of the variance in the relevant variable.4 What is a ‘strong’ factor solution is, of course, a matter of subjective judgement. Ours is that our two-component solutions are much stronger. The two re-reported by Sturgis account for 53.8 and 53.1 per cent of the variance respectively, and the largest loading from each variable exceeds that in Sturgis’s one-factor solution by a substantial margin in five of the six variables: 64 per cent of the variance in the first variable is accounted for by the first component, for example. We are not clear why Sturgis refers to these as ‘rather unlikely’. Is this on theoretical grounds (i.e. the different loading patterns cannot readily be interpreted substantively) or for some technical reason? 5 In the second part of his piece, Sturgis takes us to task for looking separately at each of the individual scale items, and also for our ‘initial strategy’ of collapsing the five-point to three-point scales. But this material (Tables 1–2) was there for introductory illustrative purposes, to demonstrate the degree of variability in responses over time; the * School of Geographical Sciences, University of Bristol; and Department of Geography, University of Sheffield, respectively. 1 A. Heath, G. Evans and J. Martin, ‘The Measurement of Core Beliefs and Values: The Development of Balanced Socialist/Laissez Faire and Liberal/Authoritarian Scales’, British Journal of Political Science, 24 (1993), 115–33. Clearly, Heath et al. and the BHPS work have common roots! 2 R. J. Johnston and C. J. Pattie, ‘Inconsistent Individual Attitudes within Consistent Attitude Structures: Comments on an Important Issue Raised by John Bartle’s Paper on Causal Modelling of Voting in Britain’, British Journal of Political Science, 30 (2000), 361–73. 3 If responses to two questions are coded 1 … 5 and 5 … 1 respectively, then reordering the second will not change the size of the correlation, only its direction. 4 We have to assume that Sturgis used factor analysis whereas we employed principal components analysis – which makes no assumptions about ‘unique variance’. 5 Sturgis bolsters his argument against our two-factor solutions on the grounds that we offer no substantive interpretation of our second factor. As we see it, the first factor relates to state action and the role of the trade unions (the traditional left–right attitude dimension); the second relates to ideology – with the statement on ‘one law for the rich …’ falling between the two.
698
Notes and Comments
detailed analyses indeed focus on the ‘multiple indicators’ provided by component analyses – and, interestingly, the decision to report such analyses for both five-point and three-point scales was one pressed on us by a referee of the first version of the article (we had reported analyses of the five-point scales only!). We do not understand the argument that our conclusion that either the scale items ‘may be poor measures of our left–right leanings or that our left–right leanings might not be stable, is not borne out by the simple strategy of summing the six items to form an additive scale’; our two-component solutions deny the latter point. Sturgis then reports on an alternative mode of analysis, which shows high inter-wave correlations and ‘near perfect stability over a four-year period’. So too do our component solutions – as we make very clear in our discussion of Table 6 in our article. There is no disagreement between us and Sturgis on the overall stability. Where we do differ is in the assessments of the variance in individual positions on the consistent structures – a difference whose resolution clearly calls for further research. In his conclusion, Sturgis again appears to agree with our overall conclusion that, despite high aggregate stability in the attitude structures, nevertheless there is ‘a large amount of individual “churn” ’. This ‘churn’, he argues, is produced by ‘essentially random and, therefore, self-cancelling errors of measurement’ (although he does not test whether there is the same amount of ‘churn’ on his single-factor solutions as we found using the scores on our two-component solutions). We have two problems with this: 1. If the individual-level ‘churn’ were essentially random, why should it be self-cancelling across sets of inter-correlated variables? Although random variation on one variable may be self-cancelling over time, essentially random variation across six scale items could quite feasibly produce inconsistency rather than consistency in the overall structure identified by the component solutions. The consistency identified at the ecological scale suggests that the variation in individual scores on the separate items is correlated. 2. More fundamentally, in the face of the great variability shown in the descriptive tables of our article it seems defeatist simply to decide that this is ‘random error’. Is this a satisfactory answer to the question ‘Why do so many people, at intervals of two years, give such contradictory responses to such straightforward items?’ (The data from our article cited by Sturgis in his introduction show that half of the respondents failed to select the same response on successive waves and that a third selected ‘a response alternative on the opposite side of the agree/disagree scale from one time to the next’.) The answer may be random error – which we continue to contend is more likely to occur with the five-point than the three-point scale, since with the former it is degree of agreement/disagreement whereas with the latter it is the direction of agreement/disagreement. Alternatively, the responses may be telling us either something about how we try to measure attitudes quantitatively and/or that many people do vary substantially in how they respond to the same issue at different times, and perhaps in different contexts. To dismiss such substantive possibilities as mere ‘random error’ is surely to abdicate the goal of research – to understand behaviour; we should only decide that it is random error when we have exhausted the possible substantive explanations for the behaviour. In conclusion, we fully agree with Sturgis that there ‘is room for improvement’ in analyses of the attitude–behaviour linkage, and welcome his contribution to the debate. But he has failed to convince us that we have not uncovered an important ecological fallacy, which calls for explanation rather than dismissal as ‘random error’.