vol. 160, no. 6
the american naturalist
december 2002
Notes and Comments Bergmann’s Rule in Ectotherms: A Test Using Freshwater Fishes
Mark C. Belk* and Derek D. Houston
Department of Integrative Biology, Brigham Young University, Provo, Utah 84602 Submitted August 14, 2001; Accepted May 30, 2002
Keywords: body size, latitude, temperature, Bergmann’s rule, fish.
Understanding patterns of variation in body size within and among species is a central question in evolutionary ecology (Schlichting and Pigliucci 1998). The most well known pattern of variation in body size is Bergmann’s rule (Bergmann 1847; Mayr 1956). The intraspecific version of Bergmann’s rule holds that within endothermic species, body size increases with increasing latitude (or decreasing temperature; Blackburn et al. 1999; Ashton et al. 2000). In general, mammals conform to this rule (Ashton et al. 2000). Ray (1960) proposed that ectothermic organisms also follow Bergmann’s rule, on the basis of primarily one line of argument. Specifically, ectotherms reared at relatively lower temperatures typically mature later at larger sizes when compared with conspecifics reared at higher temperatures (Atkinson 1994; Sibly and Atkinson 1994). Ray (1960) reasoned that the negative slope of the reaction norm between size at maturity and rearing temperature combined with generally lower temperatures at higher latitudes would produce a cline of increasing body size with increasing latitude. Ray (1960) summarized field data from previous studies to add generality to his claim of ectotherms following Bergmann’s rule. In regard to fishes, he states that “the rule is obeyed by a great number of fishes as shown by numerous reports in the literature” (Ray 1960, p. 93), but he provides no citations related to variation in body size across latitude. All his citations regarding fish apply to meristic counts * E-mail:
[email protected]. Am. Nat. 2002. Vol. 160, pp. 803–808. 䉷 2002 by The University of Chicago. 0003-0147/2002/16006-010286$15.00. All rights reserved.
(Allen’s rule; Allen 1877) or growth of individuals from the same population in the lab (Ray 1960). Lindsey (1966) compiled data on average size of ectotherms (many taxa) at high and low latitudes, and his article is also cited as providing support for Bergmann’s rule in ectotherms (e.g., Bodie and Semlitsch 2000). However, as noted by Lindsey (“Bergmann’s rule, which concerns a somewhat different phenomenon from that to be considered here” [1966, p. 456]), the intraspecific version of Bergmann’s rule applies to populations within species, or at best among closely related species, not to the distribution of body size without respect to taxa. Obviously, Lindsey’s analysis does not provide support for the intraspecific version of Bergmann’s rule in ectotherms. Subsequently, several authors, citing Ray (1960) and Lindsey (1966), have asserted that ectotherms conform to Bergmann’s rule and have spent a great deal of time elucidating or challenging potential mechanisms for producing Bergmann-type size clines in ectotherms (Van Voorhies 1996, 1997; Partridge and Coyne 1997; Arnett and Gotelli 1999; Bodie and Semlitsch 2000). Unfortunately, whereas there have been many assertions about whether ectotherms follow Bergmann’s rule, we have found no comprehensive reviews of patterns of intraspecific body size variation for any ectothermic group. To understand possible mechanisms of latitudinal variation in body size in ectotherms, it is important to know which taxa conform to Bergmann’s rule and which do not. Mousseau (1997) summarized studies showing that at least five species of orthopteran insects do not exhibit Bergmann-type size clines and suggested that ectotherms in general follow the converse to Bergmann’s rule. However, documentation of patterns of body size distribution for other ectothermic taxa, especially vertebrates, are rare (for exceptions, see Leggett and Carscadden 1978; Mills 1988; Power and McKinley 1997), and rigorous tests of concordance with Bergmann’s rule are nonexistent. To provide information on patterns of intraspecific body size variation among vertebrate ectotherms, and to test for compliance with Bergmann’s rule, we compiled data for several species of freshwater fishes of North America.
804
The American Naturalist
Freshwater fishes were chosen because it has been suggested that they conform to Bergmann’s rule (Ray 1960; Van Voorhies 1996). Further, data on body size are available for several species from populations at varying latitudes, which allows a comparison of body size in natural environments. Specifically, we compare size at ages 1, 3, and 5 yr and/or maximum body size (regardless of age) for populations across the species’ latitudinal range to test for patterns of increased body size at higher latitudes. Methods We compiled data on common large-bodied freshwater fishes of North America primarily from summaries of studies compiled by Carlander (1969, 1977, 1997). Total length was used as the measure of body size because it is the most often reported measure for fish populations. We used maximum observed total length as a measure of asymptotic body size (Stamps and Andrews 1992). Studies were selected on the basis of the following criteria: sample sizes were ≥50 individuals; data included estimates of total length-at-age for ages 1, 3, and 5 yr as well as maximum total length; locations were within the native range (i.e., they were native populations); and latitudinal locations were verifiable given data in the original source. Species were included if data were available for at least 16 locations and the locations spanned at least 5⬚ latitude. Thirteen species representing seven families met the above criteria. We transformed all length values using the natural logarithm. Because the above data were biased toward large-bodied predatory fishes, we compiled data on maximum standard length from five species of small-bodied fishes (representing three families) from collections at the University of Michigan’s Museum of Zoology (collection numbers furnished on request). Samples were selected on the basis of the following criteria: sample sizes were ≥50 individuals; collection locations were within the native range; and the largest individual in the sample was within the adult size range (on the basis of ranges reported in Lee et al. 1980). Collection locations for each species spanned at least 7⬚ latitude. We transformed all length values using the natural logarithm. The combined data set includes a large range of means and variances (measured as coefficient of variation of the mean, CV) in body sizes (table 1). To determine whether variance in body size among populations showed some trend with latitude (i.e., whether variance among means increased or decreased with latitude), we compared variance between northern and southern halves of the entire sample. For each species, we divided the data at the median latitude and then calculated CV for each subdivided sample. To determine whether CVs were consistently higher
in one half or the other, we calculated the difference in CV between halves and used a paired t-test to compare the differences (Ramsey and Shafer 1997). There was no difference between CVs from the two halves (age 1 yr, t p ⫺0.03, df p 12, P p .97; age 3 yr, t p 0.22, df p 12, P p .82; age 5 yr, t p 0.21, df p 12, P p .83; maximum length, t p 1.33, df p 17, P p .20). To test for compliance with Bergmann’s rule, we correlated mean total length-at-age and maximum total length or maximum standard length with latitude. We used latitude as an indicator of mean temperature. On the North American continent, mean temperature decreases by 0.5⬚–1.1⬚C per latitudinal degree (depending on the season; Robinson and Henderson-Sellers 1999). Thus, over the scale covered by the data, annual mean temperature differed by 5.6⬚–19.2⬚C. A significant positive relationship between size and latitude would constitute evidence for a Bergmann-type size cline. Additionally, for large-bodied species, to determine whether differences in maximum length could be attributed to increased longevity at higher latitudes, we correlated maximum observed age in a population with latitude. Because data from a geographic gradient are potentially spatially autocorrelated, individual data points may not be completely independent. Therefore, traditional tests for significance of correlation may not be reliable. To avoid this problem, we tested correlation coefficients against a null distribution created by randomized resampling (Simon 1999). We randomly paired latitude and length (or age) data 1,000 times to create a null distribution of correlation coefficients for each combination of species and length measure. We calculated the probability of the observed correlation coefficient compared with the null distribution generated by resampling. Because of the large number of correlations being considered, we adjusted the acceptable significance level by dividing 0.05 by the number of correlations for each category (13 correlations for size-at-age and maximum age, and 18 correlations for maximum size, resulting in a significance level of 0.004 and 0.003, respectively, for a one-tailed test) to guard against inflation of Type I error rate (Bonferroni procedure; Ramsey and Shafer 1997). In addition, to determine how confident we can be that nonsignificant correlations were not different from 0, we calculated 95% confidence intervals for all correlation coefficients (fig. 1; Rencher 2000; Hoenig and Heisey 2001). Narrow confidence intervals around 0 imply high confidence that the true correlation does not differ from 0. This approach provides information about the possibility of Type II error but does not suffer from the fallacious inferences of post hoc “observed power” tests (Hoenig and Heisey 2001).
Table 1: Species; family; number of populations included in analysis; latitudinal range of studies; mean total length for ages 1, 3, and 5 yr; mean maximum length; and mean maximum age
Age 1 yr
Age 3 yr
Age 5 yr
Mean maximum length
33⬚12⬘–46⬚10⬘N
53.9 (38.8)
128.9 (21.5)
170.2 (18.5)
180.1 (18.7)
5.5 (30.9)
28
34⬚12⬘–45⬚47⬘N
95.7 (17.0)
246.3 (18.5)
337.2 (14.3)
397.1 (15.8)
7.7 (36.2)
Centrarchidae
41
32⬚57⬘–46⬚10⬘N
133.8 (27.7)
309.7 (18.2)
409.6 (14.7)
462.2 (16.7)
6.6 (30.7)
Pomoxis annularis (white crappie)
Centrarchidae
58
32⬚04⬘–45⬚02⬘N
82.3 (25.1)
210.6 (21.4)
293.9 (16.7)
314.3 (23.3)
5.8 (29.3)
Pomoxis nigromaculatus (black crappie)
Centrarchidae
38
28⬚04⬘–45⬚02⬘N
77.6 (26.2)
210.3 (23.7)
269.9 (21.5)
280.3 (23.1)
5.7 (32.5)
Morone chrysops (white bass)
Percichthyidae
24
32⬚38⬘–43⬚59⬘N
174.0 (25.3)
345.4 (14.1)
389.9 (12.3)
410.5 (11.3)
5.6 (28.6)
Perca flavescens (yellow perch)
Percidae
65
34⬚43⬘–49⬚15⬘N
83.2 (26.9)
188.5 (17.8)
240.6 (14.3)
259.4 (16.4)
6.4 (32.3)
Stizostedion canadense (sauger)
Percidae
31
35⬚47⬘–49⬚15⬘N
149.8 (21.2)
351.9 (14.5)
458.2 (13.4)
518.7 (15.1)
6.6 (26.5)
Stizostedion vitreum (walleye)
Percidae
74
36⬚05–49⬚15⬘N
169.2 (27.7)
355.7 (20.2)
457.6 (16.1)
570.9 (19.8)
8.6 (26.3)
Ictalurus punctatus (channel catfish)
Ictaluridae
17
34⬚59⬘–42⬚07⬘N
100.7 (30.1)
263.8 (21.5)
381.1 (18.6)
554.4 (22.3)
8.4 (18.3)
Esox lucius (northern pike)
Esocidae
16
41⬚32⬘–65⬚50⬘N
217.1 (37.3)
420.3 (30.9)
552.3 (26.6)
836.9 (36.2)
10.6 (61.8)
Carpiodes carpio (river carpsucker)
Catostomidae
16
33⬚48⬘–42⬚02⬘N
93.8 (27.4)
241.4 (21.4)
313.5 (14.8)
385.1 (17.3)
7.4 (28.0)
Oncorhynchus clarki (cutthroat trout)
Salmonidae
18
38⬚39⬘–48⬚47⬘N
108.2 (33.2)
275.3 (30.6)
422.9 (25.9)
447.8 (35.1)
5.6 (23.3)
Pimephales promelas (fathead minnow)
Cyprinidae
57
36⬚54⬘–48⬚59⬘N
…
…
…
57.1 (15.2)a
…
Notemigonus crysoleucas (golden shiner)
Cyprinidae
19
39⬚49⬘–46⬚42⬘N
…
…
…
84.1 (31.7)a
…
Richardsonius balteatus (redside shiner)
Cyprinidae
29
40⬚53⬘–47⬚54⬘N
…
…
…
81.8 (13.5)a
…
Gambusia affinis (western mosquitofish)
Poeciliidae
27
24⬚40⬘–33⬚21⬘N
…
…
…
38.5 (9.3)a
…
Etheostoma caeruleum (rainbow darter)
Percidae
27
26⬚13⬘–33⬚35⬘N
…
…
…
51.0 (11.5)a
…
No. of populations
Latitudinal range
Species
Family
Lepomis macrochirus (bluegill sunfish)
Centrarchidae
55
Micropterus dolomieu (smallmouth bass)
Centrarchidae
Micropterus salmoides (largemouth bass)
Mean total length
Note: Numbers in parentheses are the coefficient of variation of the mean (CV). Ellipsis dots indicate no data available. a Standard length was used instead of total length.
Mean maximum age
806
The American Naturalist
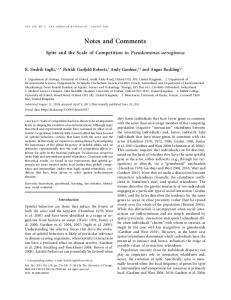
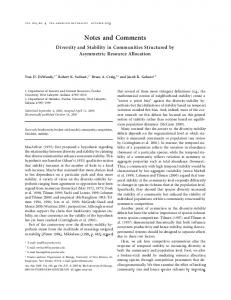
Figure 1: Correlation coefficient and 95% confidence interval for the correlation of (a) size at age 1 yr, (b) size at age 3 yr, (c) size at age 5 yr, (d) maximum length, and (e) maximum age with latitude. Species are as follows: (1) Lepomis macrochirus, (2) Micropterus dolomieu, (3) Micropterus salmoides, (4) Pomoxis annularis, (5) Pomoxis nigromaculatus, (6) Morone chrysops, (7) Perca flavescens, (8) Stizostedion canadense, (9) Stizostedion vitreum, (10) Ictalurus punctatus, (11) Esox lucius, (12) Carpiodes carpio, (13) Oncorhynchus clarki, (14) Pimephales promelas, (15) Notemigonus crysoleucas, (16) Richardsonius balteatus, (17) Gambusia affinis, (18) Etheostoma caeruleum. Filled circles indicate the coefficient is significantly different from 0.
Results
Discussion
Among the species used in this analysis, there is no evidence for increasing total length-at-age with increasing latitude. Almost all species exhibited a negative trend of body size with latitude. Accordingly, the correlation between total length-at-age and latitude was either significantly negative or did not differ significantly from 0 (fig. 1a, 1b, 1c). Five of 18 species exhibited a positive trend of maximum length with latitude. However, no species yielded correlation coefficients that differed significantly from 0 (fig. 1d ). Eleven of 13 species exhibited a positive trend of maximum age with latitude, and five species showed a significant positive correlation (fig. 1e).
Contrary to Ray’s (1960) conclusions, the pattern of distribution of body size within species of freshwater fishes of North America does not follow Bergmann’s rule. If we consider size-at-age, then many species follow the converse of Bergmann’s rule. This is consistent with the pattern of decreasing body size with increasing latitude observed in the few other studies that have quantified latitudinal patterns of body size in freshwater fishes (e.g., lake sturgeon Acipenser fulvescens, Acipenseridae [Power and McKinley 1997]; European minnow Phoxinus phoxinus, Cyprinidae [Mills 1988]). If we consider maximum length (regardless of age), none of the 18 species, including both large- and
Notes and Comments 807 small-bodied species, exhibits a significant pattern of increasing body size with increasing latitude. Two species exhibited relatively large, positive correlations (albeit nonsignificant) between maximum body size and latitude (Micropterus dolomieu and Esox lucius). Given the relatively broad confidence intervals around the correlation coefficient, some might suggest that these two species conform to Bergmann’s rule. In this case, it is interesting to note that both species also exhibit a significant positive relationship between maximum age and latitude. Thus, the relationship of increasing maximum body size with increasing latitude is merely a by-product of increased longevity at higher latitudes. As such, body size per se does not require an adaptive explanation. Rather, the question becomes, Why do organisms live longer at higher latitudes? Given the lack of comprehensive reviews of patterns of intraspecific body size variation for any ectothermic group, why is there a popular sense that ectotherms follow Bergmann’s rule? A review of the literature suggests that nearly all such assertions rest on the observation that organisms raised at lower temperatures mature at larger sizes compared with organisms raised at higher temperatures (Ray 1960; Atkinson 1994; Sibly and Atkinson 1994). Thus, lower temperatures at increasingly higher latitudes should produce a cline of increasing body size with increasing latitude. However, this argument depends on two dubious assumptions. First, it assumes all individuals and populations of the species have the same reaction norm (i.e., there are no genetic differences in the reaction norm between size at maturity and rearing temperature among populations across the geographic range of the species). Because of the potential for genetic variation among populations and variation in genotype-by-environment interactions (e.g., Schlichting and Pigliucci 1998), the pattern of variation in body size across a species’ range cannot be extrapolated from variation in body size generated among individuals from the same population in response to temperature variation in the lab. Additionally, patterns of growth and maturation observed in a laboratory setting are often not representative of patterns in wild populations (Adolph and Porter 1996 and citations therein). The second assumption is that size at maturity is a good predictor of maximum or mean body size within a population. If this assumption were true, the observation of maturation at larger size when raised at cooler temperatures would suggest a reversal in relative size-at-age between high- and low-latitude populations as organisms grow: lower-latitude populations would be larger initially, but higher-latitude populations would be larger at later ages (i.e., after maturation; e.g., Perrin 1995). Our data do not support this prediction. Fish at lower latitudes are larger at all ages (even at age 5, which represents post-
maturation ages for all species in the analysis; Lee at al. 1980). Additionally, most fishes exhibit indeterminate growth, albeit growth rates are reduced after maturation. Thus, for species that live longer than one season, size at maturity is probably a poor predictor of adult body size. A related mechanism proposed for generating increased size at maturity at higher latitudes is the effect of seasonality on the age and size at maturity (Adolph and Porter 1996). Lower growth rates at higher latitudes and the seasonal availability of conditions conducive to reproduction combine to predict delayed maturity at larger sizes at higher latitudes. Once again, size at maturity is probably a poor predictor of adult body size. However, the predictions of the model presented by Adolph and Porter (1996) for size-at-age and maximum body size are similar to the pattern observed in our data. Specifically, the model predicts smaller size-at-age at higher latitudes and relative invariant maximum body size across latitudes. It is interesting to note that although length of growing season decreases significantly as latitude increases (e.g., McCauley and Kilgour 1990), many species show no significant relationship between total length-at-age and latitude. This suggests that many of the species surveyed here exhibit some compensating mechanism to ameliorate the full effect of decreased length of growing season on growth. Conover and Schultz (1995) have suggested that countergradient variation for growth among populations along a latitudinal gradient would result in little phenotypic variation in body size among populations. Our data are consistent with this suggestion. Arnett and Gotelli (1999) have suggested that countergradient variation for growth in an ant lion (Myrmeleon immaculatus) resulted in a Bergmanntype size cline. However, there seems to be little evidence that countergradient variation for growth in freshwater fishes would result in larger body sizes at higher latitudes. In summary, our data suggest that freshwater fishes of North America do not conform to Bergmann’s rule. We suggest that variation in body size among other ectothermic taxa should be explored and that assertions about whether ectotherms do or do not follow Bergmann’s rule should rely on actual patterns of body size variation rather than on extrapolations from responses in the laboratory. Acknowledgments We thank K. Ashton, J. Knouft, S. Peck, and L. Woolstenhulme for helpful reviews of the manuscript. Literature Cited Adolph, S. C., and W. P. Porter. 1996. Growth, seasonality, and lizard life histories: age and size at maturity. Oikos 77:267–278.
808
The American Naturalist
Allen, J. A. 1877. The influence of physical conditions in the genesis of species. Radical Review 1:108–140. Arnett, A. E., and N. J. Gotelli. 1999. Geographic variation in life-history traits of the ant lion, Myrmeleon immaculatus: evolutionary implications of Bergmann’s rule. Evolution 53:1180–1188. Ashton, K. G., M. C. Tracy, and A. de Queiroz. 2000. Is Bergmann’s rule valid for mammals? American Naturalist 156:390–415. Atkinson, D. 1994. Temperature and organism size: a biological law for ectotherms. Advances in Ecological Research 25:1–58. Bergmann, C. 1847. Ueber die Verhaeltnisse der Waermeoekonomie der Thiere zu ihrer Groesse. Goettinger Studien 1:595–708. Blackburn, T. M., K. J. Gaston, and N. Loder. 1999. Geographic gradients in body size: a clarification of Bergmann’s rule. Diversity and Distributions 5:165–174. Bodie, J. R., and R. D. Semlitsch. 2000. Size-specific mortality and natural selection in freshwater turtles. Copeia 2000:732. Carlander, K. D. 1969. Life history data on freshwater fishes of the United States and Canada, exclusive of the Perciformes. Vol. 1. Handbook of freshwater fishery biology. Iowa State University Press, Ames. ———. 1977. Life history data on Centrarchid fishes of the United States and Canada. Vol. 2. Handbook of freshwater fishery biology. Iowa State University Press, Ames. ———. 1997. Life history data on Ichthyopercid and Percid fishes of the United States and Canada. Vol. 3. Handbook of freshwater fishery biology. Iowa State University Press, Ames. Conover, D. O., and E. T. Schultz. 1995. Phenotypic similarity and the evolutionary significance of countergradient variation. Trends in Ecology & Evolution 10: 248–252. Hoenig, J. M., and D. M. Heisey. 2001. The abuse of power: the pervasive fallacy of power calculations for data analysis. American Statistician 55:19–24. Lee, D. S., C. R. Gilbert, C. H. Hocutt, R. E. Jenkins, D. E. McAllister, and J. J. R. Stauffer. 1980. Atlas of North American freshwater fishes. North Carolina Biological Survey, Raleigh. Leggett, W. C., and J. E. Carscadden. 1978. Latitudinal variation in reproductive characteristics of American shad (Alosa sapidissima): evidence for population specific life history strategies in fish. Journal of the Fisheries Research Board of Canada 35:1469–1478.
Lindsey, C. C. 1966. Body sizes of poikilotherm vertebrates at different latitudes. Evolution 20:456–465. Mayr, E. 1956. Geographical character gradients and climatic adaptation. Evolution 10:105–108. McCauley, R. W., and D. M. Kilgour. 1990. Effect of air temperature on growth of largemouth bass in North America. Transactions of the American Fisheries Society 119:276–281. Mills, C. A. 1988. The effect of extreme northerly climatic conditions on the life history of the minnow, Phoxinus phoxinus (L.). Journal of Fish Biology 33:545–561. Mousseau, T. A. 1997. Ectotherms follow the converse to Bergmann’s rule. Evolution 51:630–632. Partridge, L., and J. A. Coyne. 1997. Bergmann’s rule in ectotherms: is it adaptive? Evolution 51:632–635. Perrin, N. 1995. About Berrigan and Charnov’s life history puzzle. Oikos 73:137–139. Power, M., and R. S. McKinley. 1997. Latitudinal variation in lake sturgeon size as related to thermal opportunity for growth. Transactions of the American Fisheries Society 126:549–558. Ramsey, F. L., and D. W. Shafer. 1997. The statistical sleuth: a course in methods of data analysis. Duxbury, Albany, N.Y. Ray, C. 1960. The application of Bergmann’s and Allen’s rules to poikilotherms. Journal of Morphology 106: 85–108. Rencher, A. C. 2000. Linear models in statistics. Wiley, New York. Robinson, P. J., and A. Henderson-Sellers. 1999. Contemporary climatology. 2d ed. Addison-Wesley, Singapore. Schlichting, C. D., and M. Pigliucci. 1998. Phenotypic evolution: a reaction norm perspective. Sinauer, Sunderland, Mass. Sibly, R. M., and D. Atkinson. 1994. How rearing temperature affects optimal adult size in ectotherms. Functional Ecology 8:486–493. Simon, J. L. 1999. Resampling: the new statistics. Resampling Stats, Arlington, Va. Stamps, J. A., and R. M. Andrews. 1992. Estimating asymptotic size using the largest individuals per sample. Oecologia (Berlin) 92:503–512. Van Voorhies, W. A. 1996. Bergmann size clines: a simple explanation for their occurrence in ectotherms. Evolution 50:1259–1264. ———. 1997. On the adaptive nature of Bergmann size clines: a reply to Mousseau, Partridge, Coyne. Evolution 51:635–640. Associate Editor: Joseph Travis