Nov 8, 2016 - 3Helen Diller Family Comprehensive Cancer Center, University of ... 5Human Oncology and Pathogenesis Program, Memorial Sloan Kettering Cancer Center ...... (Lincoln, NE) with the infrared dye (IR Dye 800, IR Dye ...
bioRxiv preprint first posted online Nov. 8, 2016; doi: http://dx.doi.org/10.1101/086553. The copyright holder for this preprint (which was not peer-reviewed) is the author/funder. It is made available under a CC-BY-NC-ND 4.0 International license.
Novel computational method for predicting polytherapy switching strategies to overcome tumor heterogeneity and evolution Vanessa D. Jonsson1,† , Collin M. Blakely2,3,† , Luping Lin2,3 , Saurabh Asthana2,3 , Victor Olivas2,3 , Matthew A. Gubens2,3 , Nikolai Matni1 , Boris C. Bastian3,4 , Barry S. Taylor5,6,7 , John C. Doyle8,9,10 , and Trever G. Bivona2,3,11,* 1
Department of Computing and Mathematical Sciences, California Institute of Technology, Pasadena, CA 2 Department of Medicine, University of California, San Francisco, CA 3 Helen Diller Family Comprehensive Cancer Center, University of California San Francisco, San Francisco, CA 4 Department of Pathology, University of California, San Francisco, CA 5 Human Oncology and Pathogenesis Program, Memorial Sloan Kettering Cancer Center 6 Department of Epidemiology and Biostatistics, Memorial Sloan Kettering Cancer Center 7 Marie-Josée and Henry R. Kravis Center for Molecular Oncology, Memorial Sloan Kettering Cancer Center, New York, NY 8 Department of Control and Dynamical Systems, California Institute of Technology, Pasadena, CA 9 Department of Electrical Engineering, California Institute of Technology, Pasadena, CA 10 Department of Biological Engineering, California Institute of Technology, Pasadena, CA 11 Cellular and Molecular Pharmacology, University of California, San Francisco, CA † co-first authors * corresponding author
1
bioRxiv preprint first posted online Nov. 8, 2016; doi: http://dx.doi.org/10.1101/086553. The copyright holder for this preprint (which was not peer-reviewed) is the author/funder. It is made available under a CC-BY-NC-ND 4.0 International license.
1
Abstract
1
The success of targeted cancer therapy is limited by drug resistance that can result from tumor genetic
2
heterogeneity. The current approach to address resistance typically involves initiating a new treatment after
3
clinical/radiographic disease progression, ultimately resulting in futility in most patients. Towards a poten-
4
tial alternative solution, we developed a novel computational framework that uses human cancer profiling
5
data to systematically identify dynamic, pre-emptive, and sometimes non-intuitive treatment strategies that
6
can better control tumors in real-time. By studying lung adenocarcinoma clinical specimens and preclinical
7
models, our computational analyses revealed that the best anti-cancer strategies addressed existing resistant
8
subpopulations as they emerged dynamically during treatment. In some cases, the best computed treatment
9
strategy used unconventional therapy switching while the bulk tumor was responding, a prediction we con-
10
firmed in vitro. The new framework presented here could guide the principled implementation of dynamic
11
molecular monitoring and treatment strategies to improve cancer control.
12
2
Introduction
13
Targeted cancer therapies are effective for the treatment of certain oncogene-driven solid tumors, including
14
non-small cell lung cancers (NSCLCs) with activating genetic alterations in EGFR (epidermal growth factor
15
receptor), ALK (anaplastic lymphoma kinase), BRAF, and ROS1 kinases [1, 2, 3]. However, inevitably resis-
16
tance to current targeted therapies emerges, typically within months of initiating treatment and remains an
17
obstacle to long-term patient survival [1, 2, 3, 4]. The presence and evolution of tumor genetic heterogeneity
18
potentially underlies resistance and also limits the response to successive therapeutic regimens that are used
19
clinically in an attempt to overcome resistance in the tumor after it has emerged [4, 5, 6, 7]. Indeed, while
20
a targeted therapy may be effective in suppressing one genomic subclone within the tumor, other clones
21
may be less sensitive to the effects of the drug. Thus, through selective pressures, resistant populations can
22
emerge and promote tumor progression. Moreover, the current paradigm of solid tumor treatment is largely
23
based on designing fixed (static) treatment regimens that are deployed sequentially as either initial therapy
24
or after the clear emergence of drug-resistant disease, detected by clinical and radiographic measures of
25
tumor progression. In contrast, designing dynamic treatment strategies that switch between targeted agents
2
bioRxiv preprint first posted online Nov. 8, 2016; doi: http://dx.doi.org/10.1101/086553. The copyright holder for this preprint (which was not peer-reviewed) is the author/funder. It is made available under a CC-BY-NC-ND 4.0 International license.
26
(or combinations thereof) in real time in order to suppress the outgrowth of rare or emergent drug-resistant
27
subclones may be a more effective strategy to continually suppress tumor growth and extend the duration of
28
clinical response. Thus, there is a need to identify principled approaches for the predictive design of effective
29
combination (poly)therapy strategies to pre-empt the growth of multiple tumor subclones actively during
30
treatment.
31
Mathematical modeling, analysis and computational simulations of tumor growth, heterogeneity and
32
inhibition by various therapeutic modalities has long been employed as a method to provide insight into
33
evolutionary outcomes and effective treatment strategies. Such modeling may include the use of stochastic
34
[8, 9, 10] or deterministic differential equation implementations [11, 12] to propose static or sequential
35
treatment strategies that delay resistance in various cancer models. Recent studies by Zhao et al. [13, 14]
36
incorporate the use of mathematical optimization, a fundamental subject in engineering design to predict
37
static combination therapies that effectively address heterogeneity in a lymphoma model. Complementary
38
engineering techniques from optimal control theory provide an additional theoretical framework to design
39
dynamic drug scheduling regimens in the context of dynamical systems models of cancer heterogeneity and
40
evolution. The application of optimal control theory to treatment design has a history dating back to the
41
1970s [15, 16] with more recent examples including that of scheduling angiogenic and chemotherapeutic
42
agents [17] or immuno- and chemotherapy combinations [18]. While mathematical modeling and engineering
43
methods have been used extensively to inform treatment strategy design, a significant drawback to prior work
44
in the field is that the underlying computational framework(s) have not conjointly accomplished the following
45
important aims: (1) allowing for the systematic principled design of dynamic treatment strategies using
46
experimentally identified models of tumor dynamic behaviors; and (2) developing quantitative methods that
47
allow for the exploration of the robustness of predicted treatment strategies with respect to multiple common
48
challenges in real-world patients, such as tumor heterogeneity and fluctuations in drug concentrations.
49
Here, we present a novel approach that combines a mathematical model of the evolution of tumor cell
50
populations with parameters identified from our experimental data and an engineering framework for the
51
systematic design of polytherapy scheduling directed at the following unresolved issues in the field: (1) how
52
tumor genetic composition and drug dose constraints affect the long term efficacy of combination strategies,
3
bioRxiv preprint first posted online Nov. 8, 2016; doi: http://dx.doi.org/10.1101/086553. The copyright holder for this preprint (which was not peer-reviewed) is the author/funder. It is made available under a CC-BY-NC-ND 4.0 International license.
53
(2) how optimal scheduling of combination small molecule inhibitors can help to overcome heterogeneity, ge-
54
nomic evolution and drug dose fluctuations, and (3) how serial tumor biopsy or blood-based tumor profiling
55
scheduling in patients can be timed appropriately. To tackle these questions, we developed an integrated
56
experimental and computational framework that solves for candidate combination treatment strategies and
57
their scheduling given an initial polyclonal tumor and allows the exploration of treatment design trade offs
58
such as dosage constraints and robustness to small fluctuations in drug concentrations. This methodology
59
is rooted in optimal control theory and incorporates an experimentally derived mathematical model of evo-
60
lutionary dynamics of cancer growth, mutation and small molecule inhibitor pharmacodynamics to solve
61
for optimal drug scheduling strategies that address tumor heterogeneity and constrain drug-resistant tumor
62
evolution. Our key new insights include (1) heterogeneous tumor cell populations are better controlled with
63
switching strategies; indeed, static two-drug strategies are unable to effectively control all tumor subpop-
64
ulations in our study; (2) constant combination drug strategies are less robust to perturbations in drug
65
concentrations for heterogeneous tumor cell populations, and hence more likely to lead to tumor progression;
66
(3) countering the outgrowth of subclonal tumor populations by switching polytherapies even during a bulk
67
tumor response can offer better tumor cell population control, offering a non-intuitive clinical strategy that
68
pro-actively addresses molecular progression before evidence of clinical or radiographic progression appears.
69
3
71
The presence and evolution of intratumoral genetic heterogeneity in a patient with EGFR-mutant lung adenocarcinoma
72
To explore the utility of our approach, we focused on EGFR-mutant lung adenocarcinoma. Many mechanisms
73
of resistance to EGFR-targeted therapies in lung adenocarcinoma are well characterized [19]. Furthermore,
74
tumor heterogeneity and multiple resistance mechanisms arising in a single patient can occur [2, 19]. Thus,
75
overcoming polygenic resistance is of paramount importance in this disease and will likely require a non-
76
standard approach. To illustrate this point, we investigated the molecular basis of targeted therapy resistance
77
in a 41-year old male never-smoker with advanced EGFR-mutant (L858R) lung adenocarcinoma. This pa-
78
tient responded to first-line treatment with erlotinib but progressed on this therapy within only four months
79
after initial treatment, instead of the typical 9-12 month progression free survival observed in EGFR-mutant
70
3.1
Results
4
bioRxiv preprint first posted online Nov. 8, 2016; doi: http://dx.doi.org/10.1101/086553. The copyright holder for this preprint (which was not peer-reviewed) is the author/funder. It is made available under a CC-BY-NC-ND 4.0 International license.
80
lung adenocarcinoma patients. We reasoned that genomic analysis of this patient’s outlier clinical pheno-
81
type could reveal the molecular pathogenesis of suboptimal erlotinib response. Using a custom-capture assay
82
[20, 21], we deeply sequenced the coding exons and selected introns of 389 cancer-relevant genes in both the
83
pre-treatment and the erlotinib-resistant tumor specimen and matched normal blood to identify somatic
84
alterations that could mediate resistance (Materials and Methods). Exome sequencing of the pre-treatment
85
specimen confirmed the presence of the EGFRL858R mutant allele that was identified through prior clinical
86
PCR-based sequencing of this EGFRL858R specimen (data not shown), and additionally revealed mutant
87
allele-specific focal amplification of the EGFR coding locus that resulted in a high allelic frequency (95%
88
variant frequency) (Fig. 1B-C). We discovered a rare concurrent subclone in the treatment-naïve tumor
89
with a BRAFV600E mutation (6% variant frequency; Fig. 1B). This observation is consistent with a recent
90
report of a BRAFV600E mutation in an erlotinib-resistant lung adenocarcinoma specimen [22] and recent data
91
indicating that EGFR-mutant lung adenocarcinoma cells can often develop EGFR TKI resistance through
92
RAF-MEK-ERK pathway activation [23]. The frequency of the subclonal BRAFV600E mutation increased
93
approximately 10-fold upon acquired erlotinib resistance, from 6% to 60% in the primary and recurrent
94
tumor, respectively (Figure 1C). This increase in the BRAFV600E allelic fraction was likely due to the ex-
95
pansion of the BRAFV600E subclone, given that we found no evidence that this increased frequency occurred
96
as a result of focal BRAF amplification in the resistant tumor (Figure 1C). Beyond the outgrowth of mutant
97
BRAF, we identified two additional genetic alterations in the resistant tumor that could contribute to EGFR
98
TKI resistance: focal amplification of 7q31.2 encoding MET in the resistant tumor cells, a low frequency
99
EGFRT790M mutation (14% variant frequency) (Fig. 1B-C). All candidate somatic mutations and focal
100
copy number amplifications conferring resistance to erlotinib therapy (in EGFR, BRAF, and MET) were
101
confirmed by independent, validated DNA sequencing and FISH assays (data not shown). Thus, erlotinib
102
therapy acted as a selective pressure for the evolution of multiple concurrent clonal and subclonal genetic
103
alterations that could cooperate to drive rapid drug-resistant disease progression in EGFR-mutant lung ade-
104
nocarcinoma.
105
5
bioRxiv preprint first posted online Nov. 8, 2016; doi: http://dx.doi.org/10.1101/086553. The copyright holder for this preprint (which was not peer-reviewed) is the author/funder. It is made available under a CC-BY-NC-ND 4.0 International license.
106
3.2
Analysis of clonal concurrence and resistance
107
While BRAFV600E , MET activation, and EGFRT790M can individually promote EGFR TKI resistance [22, 24,
108
25], the therapeutic impact of the concurrence of these alterations we uncovered has not been characterized.
109
Therefore, we studied the effects of BRAFV600E , MET activation, and EGFRT790M , alone or in combination,
110
on growth and therapeutic response in human EGFR-mutant lung adenocarcinoma cellular models. First,
111
we found that expression of V600E but not wild-type (WT) BRAF promoted resistance to erlotinib in 11-18
112
cells that endogenously express EGFRL858R (Fig. S1). This erlotinib resistance in BRAFV600E -expressing
113
EGFR-mutant 11-18 cells was overcome by concurrent treatment with erlotinib and selective inhibitors of
114
either BRAF or MEK (vemurafenib [26] and trametinib [27] respectively (Fig. S2, S3). We next used the
115
11-18 system to test the effects of MET activation by hepatocyte growth factor (HGF), which phenocopies
116
the effects of MET amplification in EGFR TKI resistance[25, 28] on therapeutic sensitivity. We found that
117
MET activation not only promoted erlotinib resistance in parental 11-18 cells but also enhanced the effects
118
of BRAFV600E expression on erlotinib resistance in these cells (Fig. S1). This resistance induced by MET
119
activation in 11-18 parental and BRAFV600E -expressing cells was accompanied by increased phosphorylation
120
of MEK, ERK, and AKT (Fig. S3). Treatment with the MEK inhibitor trametinib, but not the BRAF
121
inhibitor vemurafenib or the MET inhibitor crizotinib, overcame erlotinib resistance and inhibited phospho-
122
ERK in MET-activated BRAFV600E -expressing 11-18 cells (Fig. S3), providing a rationale for polytherapy
123
against EGFR and MEK in EGFR-mutant tumors with activating co-alterations in MET and BRAF.
124
Given that we found a rare EGFRT790M subclone in the polyclonal resistant tumor, we next explored
125
whether BRAFV600E expression could promote resistance to EGFR TKI treatment in H1975 human lung
126
adenocarcinoma cells that endogenously express EGFRT790M and EGFRL858R . We observed that BRAFV600E
127
modestly decreased sensitivity to afatinib, an approved irreversible EGFR kinase inhibitor effective against
128
EGFRT790M [29], and that this effect of BRAFV600E on afatinib sensitivity was blunted by vemurafenib (Fig.
129
S4). Together, our data indicate that erlotinib therapy induced the evolution of multiple concurrent events
130
that re-shaped the polyclonal tumor genetic landscape during the onset of resistance; resistance could be
131
overcome by polytherapy against both EGFR and MAPK signaling in preclinical models.
6
bioRxiv preprint first posted online Nov. 8, 2016; doi: http://dx.doi.org/10.1101/086553. The copyright holder for this preprint (which was not peer-reviewed) is the author/funder. It is made available under a CC-BY-NC-ND 4.0 International license.
133
Polytherapy Provides Temporary Response in Heterogeneous or MET Activated Tumors
134
While we conducted a finite set of experiments to test various rational drug combinations that could address
135
the heterogeneous basis of resistance in this patient’s disease, this approach is not easily scaled; further, it
136
is not readily feasible to explore all possible drug combinations and drug doses over a continuous range or
137
anticipate the effects of the myriad of possible tumor subcompositions on tumor control under treatment
138
using cell-based assays alone. Therefore, we sought to provide a more general and scalable framework for
139
understanding the impact of each genetically-informed targeted therapy strategy on the temporal evolution
140
of the multiple concurrent EGFR-mutant tumor cell subclones present in this patient, as a potentially more
141
generalizable platform. We developed an ordinary differential equation (ODE) model of tumor growth,
142
mutation and selection by small molecule inhibitors with parameters identified from experimental data (Fig.
143
2A-B and Equation S1) and interrogated it to uncover the limitations of the targeted treatments in the context
144
of tumor heterogeneity and evolution. We first confirmed that our model was able to capture the essential
145
tumor population dynamics by showing a qualitative equivalence between the patient’s clinical course and
146
our model simulation of similar tumor subpopulations consisting of 94 % EGFRL858R , 6% BRAFV600E and
147
assuming the existence of a very low initial frequency of 0.01% MET amplification of EGFRL858R , BRAFV600E
148
and EGFRT790M in the presence of 1 µM erlotinib (Fig. 3A-B).
132
3.3
149
To systematically explore the utility of many different drug combination regimens to overcome polygenic
150
resistance, we used our computational model to calculate the efficacy of clinically relevant doses of erlotinib
151
and afatinib in combination with either crizotinib, trametinib or vemurafenib on the growth of parental
152
11-18 and H1975 cells EGFR mutant cell lines. We found that most polytherapies could address only certain
153
subpopulations (Fig. 4A). For example, the afatnib/trametinib combination elicited a complete response for
154
a representative heterogeneous MET- tumor cell population comprised of (89% EGFRL858R , 10% EGFRL858R
155
BRAFV600E , 1% EGFRL858R, T790M ) compared to rapid progression for its MET activated analog (Fig. 4C).
156
Moreover, we computed the concentrations of erlotinib or afatinib in combination that could guarantee a
157
progression-free response for both MET activated or MET neutral tumor cell populations (SI, Mathematical
158
Methods) and found that in many cases, the concentrations were considerably higher than clinically feasible
7
bioRxiv preprint first posted online Nov. 8, 2016; doi: http://dx.doi.org/10.1101/086553. The copyright holder for this preprint (which was not peer-reviewed) is the author/funder. It is made available under a CC-BY-NC-ND 4.0 International license.
159
(due to either known pharmacokinetic limitations or dose limiting toxicities) (Fig. 4B).
160
To better understand the efficacy of the combination therapy over time, we sought to classify which
161
initial tumor cell subpopulations could eventually lead to therapeutic failure when treated with different
162
concentrations of EGFR TKIs in combination with crizotinib, trametinib or vemurafenib. We defined the
163
evolutionary stability of a subpopulation as the worst-case evolutionary outcome, in each case where the
164
particular subpopulation is present upon treatment initiation. More precisely, the evolutionary stability is
165
the maximum eigenvalue of each evolutionary branch downstream of the subclone (SI, Section 3.2). This
166
approach provides an assessment of which subclones present in the initial tumor cell population are likely
167
to lead to overall progression (a positive evolutionary stability) versus those that lead to response (a neg-
168
ative evolutionary stability) when treated with a particular combination therapy. Our analysis confirms
169
that progression-free response on combination therapies is sensitive to both EGFR TKI concentration and
170
dependent on whether pre-existent subpopulations are effectively targeted at these concentrations (Fig. 4D
171
and Fig. S5-S7). Overall, this analysis revealed that combinations of two signal transduction inhibitors had
172
limited effectiveness in durably controlling resistance over a longer time horizon.
173
3.4
174
We next explored how the rational design of combination drug scheduling strategies could address this issue.
175
Experimental studies have recently proposed drug pulsing [30] or drug switching [10] as a strategy to delay
176
the growth of certain cancers. To this end, we proposed a novel methodology rooted in engineering principles
177
to design drug scheduling strategies that best control the growth and evolution of tumor cell populations.
178
In particular, we apply concepts from optimal and receding horizon control theory to our experimentally
179
integrated model of lung adenocarcinoma evolution to compute treatment strategies that minimize tumor
180
cell populations over time. Our algorithm allows for the specification of treatment design constraints such as
181
maximum dose, the time horizon over which the treatment strategy is applied and the switching horizon, that
182
is the minimum time over which one particular treatment can be applied. This algorithm can be extended
183
to include other drug related characteristics and treatment design constraints. In addition, the framework
184
allows for the analysis of tradeoffs between these aspects of the design space as well as others, such as how
185
robust the predicted treatment strategies are with respect to uncertainties in the model or perturbations in
Engineering Drug Scheduling to Control Tumor Evolution
8
bioRxiv preprint first posted online Nov. 8, 2016; doi: http://dx.doi.org/10.1101/086553. The copyright holder for this preprint (which was not peer-reviewed) is the author/funder. It is made available under a CC-BY-NC-ND 4.0 International license.
186
drug dosages.
187
For a predetermined time and minimum switching horizon, we define an optimal control problem (SI,
188
Algorithm 1) and solve for the drug combination that best minimizes the existing tumor cell subpopulations
189
for every receding switching horizon. Given that any one polytherapy is unlikely to be simultaneously effective
190
against all subpopulations, the resulting optimal strategy, which maximizes the response of the tumor cells
191
present at every time horizon (SI, Mathematical Methods), is potentially one that switches between drug
192
combinations, at defined time points during the treatment course.
193
As proof-of-principle, we determined which drug scheduling regimens could maximally reduce different
194
initial tumor cell populations by solving our control problem for different allowable switching horizons over a
195
thirty day period (Fig. 5). The afatinib/trametinib combination was the optimal constant strategy for tumor
196
cell populations harboring the EGFRL858R,T790M mutation, and although this strategy invoked progression
197
free response in HGF- tumor cell populations, most L858R HGF+ tumor cell populations progressed on
198
the therapy over thirty days (Fig. 5A vs 5C and Fig. S6AB). For the HGF- tumor population comprised
199
of 89% EGFRL858R , 10% EGFRL858R BRAFV600E and 1% EGFRL858R,T790M , the optimal constant strategy
200
provided overall response leaving a dominant EGFRL858R BRAFV600E tumor subpopulation present whereas
201
the optimal ten day switching strategy provided an enhanced response over the constant strategy by alter-
202
nately targeting EGFRL858R and EGFRL858R, T790M tumor cell subpopulations (Fig. 5B). In the case of the
203
HGF treated tumor cell distribution consisting of 90% EGFRL858R and 10% EGFRL858R,T790M , a constant
204
combination of afatinib/trametinib was effective against the EGFRL858R,T790M , HGF+ subpopulation de-
205
spite overall progression due to the outgrowth of the EGFRL858R , HGF+ tumor cell population, whereas
206
a five day switching regimen between afatinib/trametinib and erlotinib/crizotinib combinations alternately
207
targeted the HGF+ EGFRL858R,T790M and the EGFRL858R subpopulations (Fig. 5B and Fig. 3A) leading
208
to overall response.
209
More generally, the optimal constant strategies determined by our algorithm are combinations that best
210
minimize existing tumor cell subpopulations at every switching horizon. In particular, a greater reduction in
211
tumor cells can be achieved by switching between therapies that alternately target different subpopulations,
212
even while there is overall response in the tumor (Fig. 5A). This finding suggests a non-intuitive approach to
9
bioRxiv preprint first posted online Nov. 8, 2016; doi: http://dx.doi.org/10.1101/086553. The copyright holder for this preprint (which was not peer-reviewed) is the author/funder. It is made available under a CC-BY-NC-ND 4.0 International license.
213
the clinical management of solid tumors that would represent a departure from the current standard clinical
214
practice. Our model suggests an advantage to switching treatments pro-actively even during a bulk tumor
215
response, while the current paradigm in the field is to switch from the initial treatment to a new drug(s)
216
only after there is clear evidence of radiographic or clinical progression on the initial treatment.
217
To understand the potential benefits of switching strategies in tumors with different initial genetic hetero-
218
geneity, we computed the optimal switching strategies for a subset of tumor cell distributions and compared
219
them to their corresponding computed optimal constant strategies. We found that the larger the number
220
of subclones present in the initial tumor, the more beneficial even a small number of switches could be
221
for overall tumor cell population control (Fig. 6A and Fig. S8A). For a highly heterogeneous tumor cell
222
population comprised of HGF treated 89% EGFRL858R , 10% EGFRL858R BRAFV600E , 1% EGFRL858R,T790M
223
mutations, the predicted fifteen day switching therapy (afatinib/trametib followed by erlotinib/crizotinib)
224
provides an immediate benefit versus the predicted constant treatment strategy (afatinib/trametinib), yield-
225
ing a 10-fold decrease in final tumor population. By contrast, for a more homogeneous tumor consisting
226
of 90% EGFRL858R , 10% EGFRL858R,T790M , the optimal predicted 30, 15 and 10 day switching strategies
227
are indistinguishable from the constant therapy strategy for population control. Our predictions indicate
228
that a similar 10-fold reduction in final population (similar to that achieved in the heterogeneous tumor
229
instance analyzed above) is achieved only with a more rapid, five day switching strategy for this more ho-
230
mogeneous tumor population (afatinib/trametinib, then alternating between erlotinib/trametinib and afa-
231
tinib/vemurafenib). These findings emphasize our results that while polytherapy may a provide response
232
in some subsets of tumor cell populations, it provides only a temporary or no response in heterogeneous or
233
MET activated tumors; in these cases, even minimal therapy switching can provide an immediate and more
234
substantial benefit for overall tumor population control.
235
3.5
236
Motivated by studies indicating that tissue to plasma ratios for certain drugs such as erlotinib can be low [31],
237
we sought to computationally explore how dose reductions of TKI combinations could affect the evolution of
238
tumor cell populations. This is a particularly relevant clinical issue, as many drugs when used in combination
239
often require a reduction in the recommended monotherapy dose due to toxicity of the dual drug therapy
Robustness Analysis of Switching Strategies
10
bioRxiv preprint first posted online Nov. 8, 2016; doi: http://dx.doi.org/10.1101/086553. The copyright holder for this preprint (which was not peer-reviewed) is the author/funder. It is made available under a CC-BY-NC-ND 4.0 International license.
240
in patients. To examine this question, we simulated the optimal switching strategies corresponding to 30,
241
15, 10, 5 and 1 day switching horizons subject to EGFR TKI dose reductions for a set of initial tumor
242
cell populations and studied the effects on the final and average tumor populations over the course of the
243
treatment (SI, Mathematical Methods).
244
For a tumor with a smaller number of initial subclones, such as one comprised of 90% EGFRL858R
245
and 10% EGFRL858R,T790M , all switching strategies induced a response for EGFR TKI dose reductions of
246
up to 50% (Fig. 6A). In contrast, with the more complex HGF treated tumor cell population comprised
247
of 89% EGFRL858R , 10% EGFRL858R BRAFV600E , 1% EGFRL858R,T790M , only combination strategies with
248
switching horizons of 10 day or shorter induced a response (Fig. 6B). Notably, we observed that the shorter
249
the switching horizon, the higher dose reduction that could be supported while still maintaining a progression
250
free response (Fig. 6B and Fig. S8B). We observed this phenomenon more generally when we simulated
251
different tumor cell initial distributions (Fig. 6C). Thus, we find that the greater number of subclones
252
present in the initial tumor, the greater the benefit there is in increasing switching frequency in terms of the
253
achieving robustness to perturbations in EGFR TKI drug concentration.
254
3.6
255
Motivated by the results of our treatment strategy algorithm, we tested drug scheduling strategies on select
256
tumor subpopulations in an in vitro model of EGFR mutant lung adenocarcinoma. Specifically, we syn-
257
thesized the optimal treatment strategy for a heterogeneous HGF treated tumor cell population consisting
258
of 89% EGFRL858R , 10% EGFRL858R BRAFV600E , 1% EGFRL858R,T790M , and imposed a constraint that at
259
most one switch could occur, as a starting point to simulate what might be most clinically feasible. The
260
resulting optimal treatment strategy predicted by our modeling, consisting of the erlotinib/crizotinib (days
261
0-5) followed by the afatinib/trametinib (days 5-30) combination, was shown to elicit the best response in
262
vitro, validating our predictive model (Fig. 7B).
Switching Strategies Control or Delay Progression in Vitro
263
To show how a delay in the switching time might affect response to therapy, we tested equivalent initial
264
tumor cell populations but changed the treatment strategy to start the afatinib/trametinib combination at
265
day 10 instead of at day 5. This resulted in worse overall response than the 5 day switching regimen (Fig.
266
7B). The corresponding model simulation highlights that although the erlotinib/crizotinib combination effec11
bioRxiv preprint first posted online Nov. 8, 2016; doi: http://dx.doi.org/10.1101/086553. The copyright holder for this preprint (which was not peer-reviewed) is the author/funder. It is made available under a CC-BY-NC-ND 4.0 International license.
267
tively targeted the HGF treated EGFRL858R mutation during the first 10 days, it allowed the HGF treated
268
EGFRL858R, T790M subclone to dominate for a longer period of time, thereby impeding overall response.
269
4
Discussion
270
One of the fundamental challenges in the principled design of combination therapies is the pre-existence
271
and temporal expansion of intratumor genetic heterogeneity that can often lead to rapid resistance with
272
first-line targeted therapies. To address this problem, we sought to develop a new modeling framework to
273
systematically design principled tumor monitoring and therapeutic strategies. We applied a receding horizon
274
optimal control approach to an evolutionary dynamics and drug response model of lung adenocarcinoma
275
that was identified from experimental and clinical data. Based on the clinical and experimental data, our
276
computational method generated optimal drug scheduling strategies for a comprehensive set of initial tumor
277
cell subpopulation distributions.
278
Our initial insight was that constant drug combination strategies that guarantee progression free response
279
for tumor cell populations with considerable heterogeneity and/or MET activation, required EGFR TKI
280
concentrations that were considerably higher than are typically clinically feasible. At clinically relevant doses,
281
these constant combination strategies were not effective against all tumor cell subpopulations and inevitably,
282
those subpopulations with even slight evolutionary advantages could undergo clonal expansion and cause
283
resistance. To overcome this issue, we used our algorithm to generate optimal drug scheduling strategies that
284
could preempt the outgrowth of these subpopulations over fixed switching periods, and showed that these
285
strategies outperformed constant combination strategies for most tumor cell subpopulation distributions.
286
Notably, our computational analysis showed there was more benefit in applying switching strategies in
287
the context of increasing pre-existing genetic heterogeneity and these switching strategies provided more
288
robustness guarantees in the presence of perturbations in drug concentrations that can occur in patients. We
289
demonstrated successful in vitro validation of our optimal control approach for selected tumor subpopulation
290
distributions. In particular, for an in vitro analog of our clinical case, a non-intuitive combination therapy
291
switching strategy offered better tumor control than constant treatment strategies.
292
We found that the most effective drug scheduling strategies were ones that addressed existing subpopu-
12
bioRxiv preprint first posted online Nov. 8, 2016; doi: http://dx.doi.org/10.1101/086553. The copyright holder for this preprint (which was not peer-reviewed) is the author/funder. It is made available under a CC-BY-NC-ND 4.0 International license.
293
lations as they emerged during the course of the treatment, even during a bulk tumor response. In contrast,
294
current standard of care clinical practice is generally to delay switching to second-line therapy until after
295
there is clear evidence of radiographic or clinical progression. Our approach suggests a paradigm shift that
296
would require regular monitoring of an individual patient’s tumor mutational status, for instance by muta-
297
tional analysis of plasma cell-free circulating tumor DNA, so-called “liquid biopsies” [32, 33, 34, 35, 36]. Our
298
modeling strategy could potentially synthesize this genetic information to yield both the design and priori-
299
tization of specific drug regimens and the optimal time for clinical deployment, informed by the molecular
300
findings in a particular patient. Such treatments may need to be applied (non-intuitively) during the initial
301
tumor response, instead of later during therapy or after drug resistance is readily apparent by standard clini-
302
cal measures in some cases. We envision that our approach could help contribute to the shift from a reactive
303
to pro-active, dynamic management paradigm in solid tumor patients in the molecular era. Drug scheduling
304
strategies synthesized by the algorithm for the initial tumor cell population could be adapted to account for
305
genetic alterations that are detected by the analysis of serial liquid (or tumor) biopsies, leading to a dynamic
306
learning model through iterative refinements; as such, the model could suggest more effective strategies with
307
time. Additional considerations such as pharmacokinetics, the tumor microenvironment and metastatic pro-
308
cesses [37, 38] could extend this model to add more clinical relevance. Finally, our approach could guide the
309
optimal timing of serial clinical specimen sampling (plasma, tumor) and radiographic analysis to streamline
310
clinical management. Overall, the combination of techniques stemming from mathematical optimization and
311
control theory combined with more clinically applicable tumor dynamics models is a promising approach
312
to aid the rational design, clinical testing, and clinical adoption of dynamic molecular monitoring and drug
313
scheduling strategies to better control complex solid cancers such as lung cancer in real-time and improve
314
clinical outcomes.
315
4.1
316
4.1.1
317
The details of mathematical models and experimental methods may be found in SI Mathematical Meth-
318
ods. The mathematical model of lung adenocarcinoma growth mutation and selection by small molecule
319
inhibitors was formulated as system of ordinary differential equations (ODEs). The treatment strategy algo-
Materials and Methods Computational Methods
13
bioRxiv preprint first posted online Nov. 8, 2016; doi: http://dx.doi.org/10.1101/086553. The copyright holder for this preprint (which was not peer-reviewed) is the author/funder. It is made available under a CC-BY-NC-ND 4.0 International license.
320
rithm was formulated as a receding horizon optimal control problem with the objective of minimizing lung
321
adenocarcinoma populations at every horizon and implemented using python version 3.4.3, scipy version
322
1.11.0.
323
4.1.2
324
Patient sample preparation and sequence capture. Formalin fixed paraffin embedded (FFPE) NSCLC
325
fine needle aspirate biopsy specimens and a normal blood sample were obtained from the patient under in-
326
stitutional informed consent both prior to erlotinib treatment and upon erlotinib resistance. Lung tumor
327
biopsy specimens contained > 75% tumor cells upon histopathological analysis by a board-certified pathol-
328
ogist. Barcoded sequence libraries were generated using genomic DNA from FFPE tumor material and
329
matched normal blood using the NuGEN Ovation ultralow library systems and according to manufacturer’s
330
instructions (NuGEN, San Carlos, CA). These libraries were among an equimolar pool of 16 barcoded li-
331
braries generated and subjected to solution-phase hybrid capture with biotinylated oligonucleotides targeting
332
the coding exons of 389 cancer-associated genes using Nimblegen SeqV.D.J.Cap EZ (Roche NimbleGen, Inc
333
, Madison, WI). Each hybrid capture pool was sequenced in a single lane of Illumina HiSeq2000 instrumen-
334
tation producing 100bp paired-end reads (UCSF Next Generation Sequencing Service). Sequencing data was
335
demultiplexed to match all high-quality barcoded reads with the corresponding samples.
Experimental Methods
336
337
Sequencing Analysis. Paired-end sequence reads from normal blood, pre-treatment tumor, and erlotinib-
338
resistant tumor samples were aligned against build hg19 of the reference genome with BWA [39]. Duplicate
339
reads were marked, alignment and hybridization metrics calculated, multiple sequence realignment around
340
candidate indels performed, and base quality scores recalibrated across all samples with the Picard suite
341
(http://picard.sourceforge.net/) and the Genome Analysis Toolkit (GATK) [40]. Somatic point mutations
342
were detected in the treatment-naïve and resistant tumors using MuTect [41], while small insertions and
343
deletions (indels) were identified with GATK. Given the depth of sequencing achieved and the presence of
344
low-frequency oncogenic mutations in the normal sample likely due to circulating tumor DNA, mutations
345
were excluded as germline if they exceeded a frequency of 10% in the normal sample. Non-synonymous muta-
346
tions were annotated for their sequence context, effect, and frequency in lung adenocarcinoma and squamous
14
bioRxiv preprint first posted online Nov. 8, 2016; doi: http://dx.doi.org/10.1101/086553. The copyright holder for this preprint (which was not peer-reviewed) is the author/funder. It is made available under a CC-BY-NC-ND 4.0 International license.
347
cell tumors from The Cancer Genome Atlas (TCGA) project and Imielinski et al. [42]. All previously
348
characterized oncogenic alleles in NSCLC or mutations previously linked to erlotinib resistance were also
349
manual inspected in both treatment-naïve and resistant tumors. This analysis revealed a single sequencing
350
read bearing the T790M mutation in the primary tumor (total coverage at this locus: 1300x). This was in-
351
sufficient evidence from sequencing data to formally call the mutation, but we cannot exclude the possibility
352
that EGFRT790M exists pre-treatment in a very rare clone (50
Decreased drug effect
11-18
EGFRL858R
11-18 EGFRL858R HGF+ 11-18 EGFRL858R BRAFV600E 11-18 EGFRL858R BRAFV600E HGF+ H1975 EGFRL858R,T790M H1975 EGFRL858R,T790M BRAFV600E
Increased drug effect
H1975 EGFRL858R,T790M HGF+ H1975 EGFRL858R,T790M BRAFV600E HGF+
C
HGF- tumor
NSCLC cells
HGF+ tumor
Days
D
AFA+TRA HGF- Tumors
ERL+CRI HGF+Tumors
AFA+TRA HGF- Tumors
ERL+CRI HGF+ Tumors
Maximum Eigenvalue
EGFRL858R,T790M BRAFV600E HGF+
EGFRL858R,T790M HGF+
BRAFV600E HGF+
EGFRL858R HGF+
EGFRL858R,T790M BRAFV600E
EGFRL858R, T790M
BRAFV600E
EGFRL858R
NSCLC cells
R
P: progression R: response
P
R
Maximum Eigenvalue
P
Days
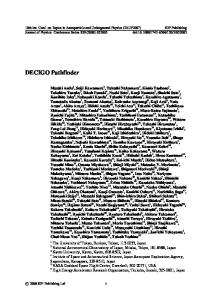
Figure 4: Modeling pharmacodyamic effects of concurrent BRAFV600E expression and MET activation in EGFRmutant lung adenocarcinoma cells and their implication on progression. (A) Drug efficacy as measured by the effect of 1.5 µM erlotinib or 0.5 µM afatinib in combination with either 0.5 µM MET inhibitor crizotinib, 0.5 µM MEK inhibitor trametinib or 5 µM BRAF inhibitor vemurafenib on cell growth (SI, Equation S1) of parental 11-18 EGFRL858R -positive lung adenocarcinoma cells or those cells engineered to express mutations listed above and treated with 0 or 50 ng/ml HGF. (B) Concentrations of EGFR TKIs afatinib and erlotinib in combination with either 0.5 µM crizotinib, 0.5 µM trametinib or 5 µM vemurafenib that guarantee progression free tumor reduction for any HGF- or HGF+ initial tumor subpopulations according to the model, measured by the minimum concentration of erlotinib or afatinib that results in exponential stability of the evolutionary dyanmics model (SI, Section 3.2). (C) Simulations of the lung adenocarcinoma model for combinations of 0.5 µM afatinib+0.5 µM trametinib and 1.5 µM erlotinib+0.5 µM crizotinib for the HGF- and HGF+ tumors specified. (D) (Left) Simulations of the evolutionary dynamics of different HGF- lung adenocarcinoma initial tumor subpopulations with a constant treatment of 0.7 µM, 0.5, 0.3 or 0.1 µM afatinib in combination with 0.5 µM of trametinib (red) and of different HGF+ lung adenocarcinoma initial tumor subpopulations with a constant treatment of 8.32 µM, 3.2 µM, 1.5 µM or 0.75 µM erlotinib in combination with 0.5 µM crizotinib (blue). (Right) Maximum eigenvalue decompositions (SI, Section 3.2) classify which subpopulationss can lead to progression at different concentrations of EGFR TKI for the afatinib+trametinib combination and the erlotinib+crizotinib combination.
4
bioRxiv preprint first posted online Nov. 8, 2016; doi: http://dx.doi.org/10.1101/086553. The copyright holder for this preprint (which was not peer-reviewed) is the author/funder. It is made available under a CC-BY-NC-ND 4.0 International license.
A
C
ALGORITHM SOLUTIONS
ALGORITHM SOLUTIONS
90% EGFRL858R 10% EGFRL858R,T790M, HGF+
89% EGFRL858R 10% EGFRL858R BRAFV600E 1% EGFRL858R,T790M AFA+TRA
AFA+TRA
ERL+VEM
ERL+CRI
Switching time
Switching time
ERL+TRA
Days
Days
B
D
TREATMENT STRATEGY SIMULATIONS
89%
EGFRL858R
CONSTANT
10%
EGFRL858R BRAFV600E
1%
TREATMENT STRATEGY SIMULATIONS
EGFRL858R,T790M
90% EGFRL858R 10% EGFRL858R,T790M, HGF+
CONSTANT
10 DAY SWITCH
5 DAY SWITCH
1010
104
10 105
Days
Days
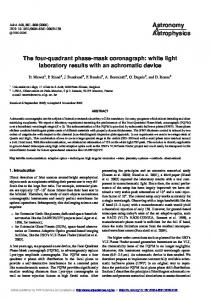
Figure 5: Optimal drug scheduling strategies solved by Algorithm 1 (SI, Section 2.2) for representative initial tumor cell distributions (A),(C), for a 30 day timeframe and 30, 15, 10, 5, 3 and 1 day minimum switching horizons, give one EGFR TKI, either 1.5 µM erlotinib (ERL) or 0.5 µM afatinib (AFA) in combination with either 5 µM vemurafenib (VEM), 0.5 µM trametinib (TRA) or 0.5 µM crizotinib (CRI) and corresponding simulations (B),(D) of the lung adenocarcinoma evolutionary dynamics for a subset of optimal drug scheduling strategies.
5
bioRxiv preprint first posted online Nov. 8, 2016; doi: http://dx.doi.org/10.1101/086553. The copyright holder for this preprint (which was not peer-reviewed) is the author/funder. It is made available under a CC-BY-NC-ND 4.0 International license.
A
89% EGFRL858R 10% EGFRL858R, BRAFV600E 1% EGFRL858R,T790M HGF+
Sum fold change final population
FC final population switch/constant strategy
90% EGFRL858R 10% EGFRL858R,T790M
Number subclones present initial tumor
B
89% EGFRL858R 10% EGFRL858R, BRAFV600E 1% EGFRL858R,T790M HGF+ progression response
response
Fold change NSCLC cells day 30/day 0
90% EGFRL858R 10% EGFRL858R,T790M
Switching time
Tumor status progression stability response
Max % EGFR TKI reduction before progression
Switching horizon
% EGFR TKI perturbation
90% EGFRL858R 10% EGFRL858R,T790M
89% EGFRL858R 10% EGFRL858R, BRAFV600E 1% EGFRL858R,T790M HGF+
Switching horizon
C Number subclones present initial tumor
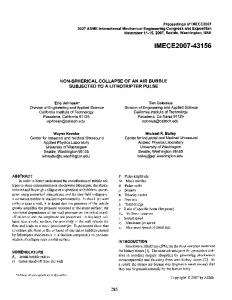
Figure 6: Exploring the robustness of treatment strategies through model simulation. (A) Switching strategies are more beneficial to tumor cell populations with more initial heterogeneity. (Left) Fold change in final lung adenocarcinoma tumor cell populations at day 30 versus day 0 over the course of the optimal 30, 15, 10, 5, 3, and 1 day treatment strategies solved by algorithm 1 (SI, Section 2.2) and normalized by fold change in final tumor cell population for the constant 30 day treatment strategy for an initial tumor cell population comprised of (90% EGFRL858R , 10% H1975 EGFRL858R,T790M ) and another comprised of (89% EGFRL858R , 10% BRAFV600E ,1% EGFRL858R,T790M ) subclones. (Right) Sum of fold change for the final lung adenocarcinoma populations (SI, Equation S5) for select initial tumor cell distributions (SI, Table 1) and their corresponding optimal 30, 15, 10, 5, 3, and 1 day treatment strategies, categorized by the number of subclones in the initial tumor cell population. Smaller fold change sums indicate that more switching is beneficial to reduce final populations, whereas larger fold changes indicate that more switching does not necessarily help in reducing the final tumor populations. (B) EGFR TKI dose perturbations. (Left) Fold change in number of lung adenocarcinoma cells between day 30 and day 0, as a function of percent EGFR TKI dose reduction for the optimal 30, 15, 10, 5 and 1 day strategies solved by algorithm 1 (SI, Section 2.2) for tumor cell populations indicated above. The shaded areas indicate the regions of the perturbation space where the treatment strategy reduces the initial tumor cell population by more than 30% (response, light blue), increases the size of the original tumor population size by more than 20% (progression, red), or maintains the original tumor population size between the two (stability, white). (Right) Bar graphs indicate the maximum reduction in EGFR TKI dose supported by the optimal strategy such that there is still reduction in tumor size at day 30 with respect to day 0 for the V600E and the pretreatment MET tumor. (C) The average maximum percent EGFR TKI dose reduction supported before progression for lung adenocarcinoma tumors with different number of initial tumor cell subpopulations and for predicted optimal 30, 15, 10, 5, and 1 day switching strategies.
6
bioRxiv preprint first posted online Nov. 8, 2016; doi: http://dx.doi.org/10.1101/086553. The copyright holder for this preprint (which was not peer-reviewed) is the author/funder. It is made available under a CC-BY-NC-ND 4.0 International license.
constant
switch
A
10 DAY ERL+CRI, AFA+TRA
5 DAY - OPTIMAL ERL+CRI, AFA+TRA
INITIAL TUMOR CELL POPULATION
ERL+CRI
AFA+TRA
~1012
89% EGFRL858R 10% EGFRL858R, BRAFV600E 1% EGFRL858R,T790M HGF+ ~103
~104
~104
SWITCHING PERIOD ONCE TREATMENT PERIOD 30 DAYS
Erl + Criz
Erl + Criz
Erl + Criz
None
Afat + Tram (day 5)
Afat + Tram (day 10)
Starting Tx
Afat + Tram
Afat + Tram
Afat + Tram
Switch Tx (day)
None
None
Switch Tx (day)
Lower Panel
Starting Tx
Upper Panel
Days
B
None
1.0
0.58
0.81
0.69
0.83
0.79
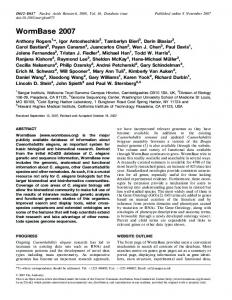
Figure 7: Engineering optimal treatment strategies for concurrent, clonal genetic alterations in EGFR-mutant lung adenocarcinoma and predicting their therapeutic impact. (A) Simulations of the optimal treatment strategy predicted by algorithm 1 (SI, Section 2.2) consisting of 1.5 µM erlotinib+0.5 µM crizotinib for days (0-5) followed by 0.5 µM afatinib+0.5 µM trametinib for days (5-30); the same strategy but with the switch occurring at day 10 and, constant strategies of 0.5 µM afatinib+0.5 µM trametinib or 1.5 µM erlotinib+0.5 µM crizotinib for 30 days, for an initial tumor cell population of 89% EGFRL858R , 10% EGFRL858R BRAFV600E , 1% EGFRL858R,T790M , HGF treated. (B) Evolution experiment shows that the predicted strategy for an initial tumor cell population of 89% EGFRL858R , 10% EGFRL858R BRAFV600E , 1% EGFRL858R,T790M , treated with 50 ng/ml HGF, is optimal. Overlaid numbers indicate the relative cell density of each well at day 30 compared to the erlotinib+crizotinib well (magenta). Computational simulations in (A) show that the predicted optimal strategy has the greatest reduction in tumor cells in vitro (B, red) compared to the same strategy with a 10 day switch (yellow). A simulation of the model predicts that a constant treatment of afatinib+trametinib produces little change in number of tumor cells (B, blue) and that a constant treatment of erlotinib+crizotinib predicts the exponential outgrowth of the initial EGFRL858R,T790M MET amplified subpopulation, experimentally validated in (B, magenta).
7
bioRxiv preprint first posted online Nov. 8, 2016; doi: http://dx.doi.org/10.1101/086553. The copyright holder for this preprint (which was not peer-reviewed) is the author/funder. It is made available under a CC-BY-NC-ND 4.0 International license.
Supplementary Information Vanessa D. Jonsson, Collin M. Blakely, et. al.
1 1.1
Mathematical Methods Evolutionary Dynamics Model of NSCLC
The quasispecies model [1] was originally developed to describe the dynamics of populations of self replicating macromolecules undergoing mutation and selection. We choose this model for its relative simplicity and its ability to capture the salient features of the evolutionary dynamics of a simplified generic disease model. The following adaptation incorporates the effects of small molecule inhibitors and describes the growth, mutation and evolution of non small cell lung adenocarcinoma populations: x˙ i = ri qii xi +
n X
ri qik xk
i (`k )xi
(S1)
k6=i
where xi 2 R+ is the concentration of a NSCLC subpopulation i, `k 2 R+ is a small molecule inhibitor concentration (assumed to remain at constant concentrations throughout), ri is the growth rate for each cell xi , and qik is the probability that cell k mutates to cell i (note that qii is the probability of no mutation occurring). Finally, the function i (`k ) represents the pharmacodynamics of individual drugs `k or of individual EGFR TKIs (erlotinib or afatinib) in combination with fixed concentrations other small molecule inhibitors used in this study (0.5 µM crizotinib, 0.5 µM trametinib or 5 µM vemurafenib) with respect to the i-th NSCLC cell type, namely: i (`k )
=
[`k ]nik ik [` ]nik +K nik k ik
(S2)
where `k 2 R+ is the drug concentration, ik 2 R+ is the saturation coefficient, Kik 2 R+ is the dissociation constant, nk 2 R+ is the Hill coefficient. When `k = 0, 8k 2 {1, ..., m}, the dynamics are unstable.
2
A control theoretic algorithm for designing treatment strategies
To design treatment strategies that best minimize tumor size and control its evolution over time, we combine both a greedy algorithm and receding horizon control approach. We introduce some notation, cost function definitions and specify our algorithm.
2.1
Cost functions
To measure the effectiveness of a given treatment strategy over time, we define the average cost function. For a given treatment strategy `k applied to Equation (S1), we rewrite the dynamics of the entire system (i.e., for all cells) as x˙ = A(`k )x,
(S3)
where A 2 R is a matrix that represents the growth, mutation and drug dynamics for treatment strategy `k , for n cell subpopulations. n⇥n
1
bioRxiv preprint first posted online Nov. 8, 2016; doi: http://dx.doi.org/10.1101/086553. The copyright holder for this preprint (which was not peer-reviewed) is the author/funder. It is made available under a CC-BY-NC-ND 4.0 International license.
The average cost Cr for a time horizon N , allowable switching period ⌧ and time intervals of the form [k⌧, (k + 1)⌧ ] for k = {0, .., N/⌧ 1} is given by X1Z
N/⌧
Cr =
k=0
(k+1)⌧
1T x(t)dt
(S4)
k⌧
where 1T is the n ⇥ 1-dimensional vector of ones and x(t) is the solution to Equation (S3). Equation (S4) simplifies to N/⌧
Cr =
X1
1T A
1
(eA`k ((k+1)⌧
k⌧ )
(S5)
I)x(k⌧ ).
k=0
N/⌧
The final cost Cf for an inital tumor population x(0) and a sequence of drugs {`(k)}k=1 switching therapy over a time horizon N is defined as N/⌧
Cf = eA({`(k)}k=1
2.2
1
)
x(0).
1
that define a (S6)
Algorithm
Our algorithm is defined as follows. Given an initial tumor population, denoted by x0 , a time horizon N and an allowable switching period ⌧ , we perform the following computations to determine a candidate treatment strategy: Algorithm 1 Treatment strategy synthesis 1. Initialization: Set k = 0 and x(0) = x0 . 2. Greedy approach: For time interval [k⌧, (k + 1)⌧ ], compute y((k + 1)⌧ ) = eA(`k )⌧ y(k⌧ ) for each possible treatment strategy `k . 3. Update: Set `(k) = arg min`k sum(y(k + 1)⌧ ), and set x((k + 1)⌧ ) = min`k sum(y(k + 1)⌧ ). Increment k: if k = N , proceed to step 4, otherwise return to step 2. N/⌧
4. Output: A sequence of drugs {`(k)}k=1
1
that define a switching therapy.
The resulting switching therapy {`(k)} is then applied until the next biopsy can be taken, giving a new tumor cell population measurement, at which point the algorithm is repeated. In particular, it is important that the horizon N be chosen to be longer than expected periods between biopsies.
3 3.1
Model Implementation and Simulations Derivation of dynamical system parameters
Growth and Mutation Rates. We model the growth of NSCLC cell population xi by the following ordinary differential equation (ODE): (S7) x˙ i = ri xi , where ri is the growth rate per day, and x˙ i denotes the derivative with respect to time of the tumor cell population xi . Note that we assume that no mutations occur over the time-frame considered, allowing us to set qii = 1 and qij = 0 in the dynamic model (S1), resulting in (S7). Given an initial population xi (0), the population xi (t) on day t can be obtained by solving ODE (S7), and is specified by the following expression xi (t) = xi (0)eri t . 2
(S8)
bioRxiv preprint first posted online Nov. 8, 2016; doi: http://dx.doi.org/10.1101/086553. The copyright holder for this preprint (which was not peer-reviewed) is the author/funder. It is made available under a CC-BY-NC-ND 4.0 International license.
Given a set of N experimental data points ei (0), ei (t1 ), . . . , ei (tN ), we fit these points to an exponential function of the form (S8), with xi (0) = ei (0) to obtain an experimentally derived value for the growth rate ri of tumor cell population xi . We take the DNA mutation rate to be 1e 9 mutation/base pair/cell division []. We assume that mutations occur unidirectionally from EGFRL858R parental cells to EGFRL858R,T790M , EGFRL858R , BRAFV600E or EGFRL858R,T790M BRAFV600E , HGF-/+. Drug Effect Rates and Hill Functions. We model the change in a tumor cell population xi under a treatment j of concentration ` with the following ordinary differential equation (ODE): fij (`)xi ,
x˙ i = ri xi
(S9)
where ri is the growth rate per day derived in the previous section and fij (`) is a function mapping the treatment j at concentration ` to a drug effect rate per day. We again assume that no mutation occurs over the time-frame considered, allowing us to set the mutation rates qii = 1 and qij = 0 in the model (S1), resulting in (S9). Similar to the previous section, given an initial population xi (0), the population xi (t) on day t can be obtained by solving ODE (S9), and is specified by the following expression xi (t) = xi (0)e(ri
fij (`)t
(S10)
.
We model the map fij (`) as a modified function of the form fij (`) =
j,i n ` j,i
`nj,i n , + Kj,ij,i
(S11)
where j,i nj,i and Kj,i are the saturation parameter, Hill function coefficient and binding reaction dissociation constant for drug j applied to cell xi . Our goal is to obtain values for these three parameters using experimental data measuring cell viability under varying concentrations ` of drug j. In particular, given experimentally obtained data pairs of the form `, yi,j,` (1), where yi,j,` (1) is the ratio of the tumor cell population xi treated with concentration ` of drug j at day 1 to the tumor cell population xi treated with no drug at day 1. Letting x`i denote the treated tumor population and x`ctrl denote the untreated control tumor population, it follows that yi,j,` can be written as j
x`i (1) xi (0)e(ri fi (`)) =e = yi,j,` (1) = ctrl xi (0)eri xi (1)
fij (`)
,
(S12)
where the first equality follows from the definition of yi,j,` (1), the second from applying equations (S10) and (S8) to x`i (1) and xctrl i (1) respectively, and the third from canceling like terms. It follows that the experimentally derived values of fij (`) are given by fij (`) =
ln(yi,j,` ).
(S13)
Solving this equation for each experimentally tested concentration `, we obtain a set of points {`, fij (`)} that can be used to derive the parameters j,i nj,i and Kj,i via curve fitting. In order to avoid overfitting, we set j,i = max` fij (`), i.e., we force the modified Hill function to saturate at the maximal experimentally observed rate. Although this approach can be conservative in modeling the drug effect rate of high concentrations of drugs, we note that the the maximal dose tested is chosen to be significantly higher than the maximum tolerated doses, and hence we do not expect this saturation to affect the accuracy of our model at clinically relevant doses.
3.2
Evolutionary stability measured by maximum eigenvalues
Figures (S7) and ( main text) depict maximum eigenvalue decompositions of HGF- and HGF+ tumors and describe the set of initial NSCLC populations, if present can lead to tumor progression upon initiation of constant (non-switching) combination treatments. For the evolutionary dynamics: 3
bioRxiv preprint first posted online Nov. 8, 2016; doi: http://dx.doi.org/10.1101/086553. The copyright holder for this preprint (which was not peer-reviewed) is the author/funder. It is made available under a CC-BY-NC-ND 4.0 International license.
x˙ = (A
(S14)
D` )x
where x 2 Rn is a vector of concentrations of n NSCLC subpopulations, x˙ 2 Rn is their rate of change over time, A 2 Rn⇥n is a matrix that represents the growth and mutation dynamics and D` 2 Rn⇥n is a diagonal matrix that represents the corresponding drug effect of one constant drug treatment on the rate of change of NSCLC cells. If all eigenvalues are negative then Equation (S14) is said to be stable. In the case of NSCLC evolutionary dynamics corresponding to Equation (1), stability refers to tumor reduction, and instability refers to tumor progression. In section 3.1, we made the assumption that mutation rates are one directional, hence the A matrix in Equation (1) is lower triangular and the eigenvalues of A D` are exactly equal to its diagonal entries. For each NSCLC subpopulation, we take the maximum eigenvalue for each evolutionary branch downstream of the population and define this as evolutionary stability. This maximum eigenvalue represents the worst case stability if the particular population is present upon treatment initiation - a positive maximum eigenvalue indicates that the presence of the cell subpopulation in the tumor upon initiation of treatment is likely to cause therapeutic failure. A negative maximum eigenvalue indicates that the presence of the particular subpopulation will not outgrow or evolve in the presence of therapy.
3.3
Robustness analysis
Sensitivity to drug perturbations. To analyze the effect of dose reductions on the robustness of constant and switching treatment strategies, we perturbed the drug concentrations and calculated the ratio of final cost and initial cost (Figures (S8)) . We rewrite Equation (S1) for one cell xi and one drug `j to illustrate how a drug perturbation 2 R[0,1] is modeled: x˙ i = ri qii xi +
n X
ri qik xk
k6=i
j,i
(
( `)nj,i n xi + Kj,ij,i
`)nj,i
(S15) N/⌧
1
The fold change F Cf in total population from day 0 to day N for a sequence of drugs {`(k)}k=1 defining a switching strategy over a time horizon N , and initial tumor population x0 = x(0) is calculated by N/⌧
Cf eA({`(k)}k=1 P = F Cf = P x0 x0 N/⌧
1
)
x0
.
(S16)
1
If F Cf < 1, the treatment strategy {`(k)}k=1 is effective for NSCLC populations for the duration of the time horizon N , F Cf > 1 indicates progression.
3.4
Implementation
The evolutionary dynamics model and simulations were implemented using python, scipy and numpy (versions 3.5.1, 0.17.0, 1.9.3) and pandas version 0.17.0 was used for data parsing. Data fitting for experimentally derived cell growth and drug dose response data was performed with Matlab version 8.3.0.532 using the non linear least squares method.
4
bioRxiv preprint first posted online Nov. 8, 2016; doi: http://dx.doi.org/10.1101/086553. The copyright holder for this preprint (which was not peer-reviewed) is the author/funder. It is made available under a CC-BY-NC-ND 4.0 International license.
H1975 EGFRL858R,T790M
11-18 EGFRL858R BRAFV600E
11-18 EGFRL858R HGF+
H1975 EGFRL858R,T790M HGF+
11-18 EGFRL858R BRAFV600E HGF+
H1975 EGFRL858R,T790M BRAFV600E
H1975 EGFRL858R,T790M BRAFV600E HGF+
Cell viability
11-18 EGFRL858R
µM drug
Figure S1: Experimentally derived erlotinib, afatinib, vemurafenib, trametinib and crizotinib dose response curves for EGFRL858R,T790M BRAFV600E 11-18 EGFRL858R , 11-18 EGFRL858R BRAFV600E , H1975 EGFRL858R,T790M H1975 [`]n cell lines, and either 0 or 50 ng/ml human growth factor (HGF) and fit with [`]n +K n where is the maximum inhibition, [`] is the EGFR TKI concentration, n is the Hill coefficient and K is the half maximal inhibitory concentration (IC50).
H1975 EGFRL858R,T790M
11-18 EGFRL858R BRAFV600E
H1975 EGFRL858R,T790M BRAFV600E
11-18 EGFRL858R HGF+
H1975 EGFRL858R,T790M HGF+
11-18 EGFRL858R BRAFV600E HGF+
H1975 EGFRL858R,T790M BRAFV600E HGF+
Cell viability
11-18 EGFRL858R
µM erlotinib
Figure S2: Experimentally derived dose response curves for erlotinib in combination with 5 µM vemurafenib, 0.5 µM trametinib and 0.5 µM crizotinib for 11-18 EGFRL858R , 11-18 EGFRL858R BRAFV600E , H1975 EGFRL858R,T790M H1975 EGFRL858R,T790M BRAFV600E cell lines, and either 0 or 50 ng/ml human growth factor (HGF) and fit with [`]n where is the maximum inhibition, [`] is the EGFR TKI concentration, n is the Hill coefficient and K is [`]n +K n the half maximal inhibitory concentration (IC50).
5
bioRxiv preprint first posted online Nov. 8, 2016; doi: http://dx.doi.org/10.1101/086553. The copyright holder for this preprint (which was not peer-reviewed) is the author/funder. It is made available under a CC-BY-NC-ND 4.0 International license.
11-18 (EV) erlotinib: trametinib: HGF:
- + - + + - - + + - - - - +
11-18 (BRAF + + +
)
wt
- + - + + - - + + - - - - +
+ + +
11-18 (BRAF
V600E
- + - + + - - + + - - - - +
11-18 (EV)
) erlotinib:
+ + +
crizotinib: HGF:
p-EGFR
p-EGFR
total-EGFR
total-EGFR
BRAF + mCherry
+ +
)
wt
- + - + - + - - + + - - + - - - - + + +
+ + +
11-18 (BRAF
V600E
- + - + - + - - + + - - + - - - - + + +
) + + +
total-MET
BRAFV600E p-AKT
BRAF + mCherry BRAF wt
total AKT
BRAFV600E p-AKT
p-MEK
total AKT
total MEK
p-MEK
p-ERK
total MEK
total ERK
p-ERK
Actin
total-ERK Actin
11-18 (EV) vemurafenib: HGF:
11-18 (BRAF +
p-MET
BRAFwt
erlotinib:
- + - + - + - - + + - - + - - - - + + +
- + - + + - - + + - - - - +
11-18 (BRAF + + +
- + - + + - - + + - - - - +
) 11-18 (BRAF
wt
+ + +
V600E
- + - + + - - + + - - - - +
)
+ + +
p-EGFR total-EGFR BRAF + mCherry BRAFwt BRAFV600E p-AKT total AKT p-MEK total MEK p-ERK total ERK Actin
Figure S3: Western blot analysis of cell lysates obtained from 11-18 cell line, treated with drugs and/or HGF as indicated, and probed for the indicated proteins.
6
bioRxiv preprint first posted online Nov. 8, 2016; doi: http://dx.doi.org/10.1101/086553. The copyright holder for this preprint (which was not peer-reviewed) is the author/funder. It is made available under a CC-BY-NC-ND 4.0 International license.
A H1975 EGFRL858R,T790M
11-18 EGFRL858R BRAFV600E
H1975 EGFRL858R,T790M BRAFV600E
11-18 EGFRL858R HGF+
H1975 EGFRL858R,T790M HGF+
11-18 EGFRL858R BRAFV600E HGF+
H1975 EGFRL858R,T790M BRAFV600E HGF+
Cell viability
11-18 EGFRL858R
µM afatinib
B
Figure S4: A) Experimentally derived dose response curves for afatinib in combination with 5 µM vemurafenib, 0.5 µM trametinib and 0.5 µM crizotinib for 11-18 EGFRL858R , 11-18 EGFRL858R BRAFV600E , H1975 EGFRL858R,T790M H1975 EGFRL858R,T790M BRAFV600E cell lines, and either 0 or 50 ng/ml human growth factor (HGF) and fit with [`]n where is the maximum inhibition, [`] is the EGFR TKI concentration, n is the Hill coefficient and K is [`]n +K n the half maximal inhibitory concentration (IC50). (B) Western blot analysis of cell lysates obtained from H1975 cell lines, treated with drugs and/or HGF as indicated, and probed for the indicated proteins.
7
bioRxiv preprint first posted online Nov. 8, 2016; doi: http://dx.doi.org/10.1101/086553. The copyright holder for this preprint (which was not peer-reviewed) is the author/funder. It is made available under a CC-BY-NC-ND 4.0 International license.
A
EGFR
L858R,T790M
V600E
BRAF
EGFR
L858R
10% 1%
B
L858R,T790M
EGFR
V600E
BRAF
EGFR
L858R
10% 1%
Figure S5: Simulations of the NSCLC model for constant combinations of 0.5 µM afatinib or 1.5 µM erlotinib with either 0.5 µM trametinib, 0.5 µM crizotinib or 5 µM vemurafenib for a tumor comprised of 89% 11-18 EGFRL858R , 10% 11-18 EGFRL858R , BRAFV600E and 1% H1975 EGFRL858R T790M , and treated with HGF (B) or without HGF (A).
8
bioRxiv preprint first posted online Nov. 8, 2016; doi: http://dx.doi.org/10.1101/086553. The copyright holder for this preprint (which was not peer-reviewed) is the author/funder. It is made available under a CC-BY-NC-ND 4.0 International license.
100%
A
EGFRL858R
89% EGFRL858R 10% BRAFV600E 1 % EGFRL858R,T790M
90% EGFRL858R 10 % BRAFV600E
90% EGFRL858R 10 % EGFRL858R,T790M HGF+
90% EGFRL858R 10 % BRAFV600E HGF+
89% EGFRL858R 10% BRAFV600E 1 % EGFRL858R,T790M HGF+
NSCLC cells
100% EGFRL858R HGF+
90% EGFRL858R 10 % EGFRL858R,T790M
Days
HGF+
HGF+
HGF+
L858R,T790M
BRAFV600E EGFR
BRAFV600E
EGFRL858R
EGFR
L858R,T790M
BRAFV600E
EGFRL858R
EGFRL858R
BRAFV600E
EGFR
L858R,T790M
V600E
L858R
BRAF
EGFR
L858R,T790M
V600E
EGFR
BRAF
EGFR
L858R
.01%
NSCLC cells
Initial tumor composition
B
Days
Figure S6: Simulations of the NSCLC model for the optimal 30 day constant combinations found by Algorithm (4) with 0.5 µM afatinib or 1.5 µM erlotinib with either 0.5 µM trametinib, 0.5 µM crizotinib or 5 µM vemurafenib for the relatively low (A) initial tumor heterogeneity or with (B) high initial tumor heterogeneity.
9
bioRxiv preprint first posted online Nov. 8, 2016; doi: http://dx.doi.org/10.1101/086553. The copyright holder for this preprint (which was not peer-reviewed) is the author/funder. It is made available under a CC-BY-NC-ND 4.0 International license.
BRAFV600E
EGFR
L858R,T790M
EGFR
L858R,T790M
V600E
BRAF
L858R
EGFR
L858R,T790M
BRAFV600E
EGFR
EGFR
V600E
BRAF
L858R
EGFR
L858R,T790M
progression stability
progression stability
ERL+TRA, HGF-
ERL+VEM, HGF-
ERL+TRA, HGF+
ERL+VEM, HGF+
progression
BRAFV600E
EGFR
L858R,T790M
EGFR
L858R,T790M
V600E
BRAF
L858R
L858R,T790M
EGFR
BRAFV600E
EGFR
EGFR
V600E
BRAF
L858R
EGFR
L858R,T790M
progression
AFA+TRA, HGF+
ERL+CRI, HGF-
BRAFV600E
EGFR
L858R,T790M
EGFR
L858R,T790M
V600E
BRAF
L858R
EGFR
BRAFV600E
EGFR
L858R,T790M
L858R,T790M
EGFR
V600E
BRAF
L858R
EGFR
stability
progression stability
AFA+CRI, HGF-
AFA+VEM, HGF-
BRAFV600E
EGFR
L858R,T790M
EGFR
L858R,T790M
V600E
BRAF
L858R
EGFR
L858R,T790M
BRAFV600E
EGFR
L858R,T790M
EGFR
V600E
BRAF
L858R
EGFR
stability
stability
AFA+CRI, HGF+
AFA+VEM, HGF+ progression
BRAFV600E
EGFR
L858R,T790M
EGFR
L858R,T790M
V600E
BRAF
L858R
EGFR
BRAFV600E
L858R,T790M
EGFR
L858R,T790M
EGFR
V600E
BRAF
EGFR
L858R
stability
Figure S7: Classification of initial tumor compositions via eigenvalue decompositions describe the initial tumor populations that can destabilize of the evolutionary dynamics in the presence of either erlotinib or afatinib and either 0.5 µM trametinib, 0.5 µM crizotinib or 5 µM vemurafenib.
10
bioRxiv preprint first posted online Nov. 8, 2016; doi: http://dx.doi.org/10.1101/086553. The copyright holder for this preprint (which was not peer-reviewed) is the author/funder. It is made available under a CC-BY-NC-ND 4.0 International license.
A
Increasing number of subclones in initial tumor
100% EGFRL858R
89% EGFRL858R 10% BRAFV600E 1% EGFRT790M
90% EGFRL858R 10% BRAFV600E
89% EGFRL858R 10% BRAFV600E 1% EGFRT790M HGF+
25% EGFRL858R 60% BRAFV600E 15% EGFRT790M HGF+
B Increasing number of subclones in initial tumor
EGFRL858R
90% 10% EGFRT790M
90% 10% BRAFV600E HGF+
FC NSCLC cells day 30/day 0c
100% EGFRL858R
EGFRL858R
25% EGFRL858R 60% BRAFV600E HGF+ 25% EGFRL858R 60% BRAFV600E 10% EGFRT790M 15% EGFRT790M HGF+ 5% BRAFV600E HGF-
Switching time
progression stability response
Max % EGFR TKI reduction before progression
% EGFR TKI dose reduction
Figure S8: A) Fold change in NSCLC population at day 30 versus day 0, over the course of the optimal 30, 15, 10, 5, 3, and 1 day treatment strategies solved by algorithm 1 (SI), for indicated tumor compositions, normalized by fold change in NSCLC population for the constant 30 day treatment strategy (Red). (Blue) Sum of fold change in the average cost for indicated tumor compositions and corresponding optimal 30, 15, 10, 5, 3, and 1 day treatment strategies. B) (Above) Fold change in number of NSCLC cells between day 0 and day 30, as a function of percent EGFR TKI dose reduction for the optimal 30, 15, 10, 5 and 1 day strategies solved by algorithm 1 (SI) for indicated tumor compositions. Shaded blue areas indicate the region of the perturbation space where the treatment strategy reduces the size of the initial tumor (stable). The shaded red area indicates the region of the perturbation space where the treatment strategy increases the size of the original tumor at day 30 (unstable). (Below) The maximum percent EGFR TKI dose reduction sustainable before the treatment is no longer effective (the tumor progresses).
11
bioRxiv preprint first posted online Nov. 8, 2016; doi: http://dx.doi.org/10.1101/086553. The copyright holder for this preprint (which was not peer-reviewed) is the author/funder. It is made available under a CC-BY-NC-ND 4.0 International license.
MUTATION MODEL
EGFRL858 BRAFV600E (HGF+)
EGFRL858R,T790M BRAFV600E (HGF+)
EGFRL858R (HGF+)
EGFRL858R,T790M (HGF+)
Figure S9: The EGFR-mutant lung adenocarcinoma mutation model used in this study.
12
bioRxiv preprint first posted online Nov. 8, 2016; doi: http://dx.doi.org/10.1101/086553. The copyright holder for this preprint (which was not peer-reviewed) is the author/funder. It is made available under a CC-BY-NC-ND 4.0 International license.
Switching time
A ERL+CRI ERL+VEM
Days
B
CONSTANT
5 DAY SWITCH
Days
Switching time
C
AFA+TRA ERL+CRI ERL+VEM
Days
D
CONSTANT
5 DAY SWITCH
Days
Figure S10: Optimal drug scheduling strategies solved by Algorithm 1 (SI, Section 2.2) for representative initial tumor cell distributions (A),(C), for a 30 day timeframe and 30, 15, 10, 5, 3 and 1 day minimum switching horizons, give one EGFR TKI, either 1.5 µM erlotinib (ERL) or 0.5 µM afatinib (AFA) in combination with either 5 µM vemurafenib (VEM), 0.5 µM trametinib (TRA) or 0.5 µM crizotinib (CRI) and corresponding simulations (B),(D) of the lung adenocarcinoma evolutionary dynamics for a subset of optimal drug scheduling strategies.
13
bioRxiv preprint first posted online Nov. 8, 2016; doi: http://dx.doi.org/10.1101/086553. The copyright holder for this preprint (which was not peer-reviewed) is the author/funder. It is made available under a CC-BY-NC-ND 4.0 International license.
Growth rate, day-1
Cell name 11-18 EGFRL858R
0.58
11-18 EGFRL858R HGF+
0.67
11-18 EGFRL858R BRAFV600E
0.60
11-18 EGFRL858R BRAFV600E HGF+
0.70
H1975 EGFRL858R,T790M
0.63
H1975 EGFRL858R,T790M BRAFV600E
0.59
H1975 EGFRL858R,T790M HGF+
0.77
H1975 EGFRL858R,T790M BRAFV600E HGF+
0.64
Table 1: Experimentally derived growth rates in parental and engineered 11-18 EGFRL858R -positive lung adenocarcinoma cells and treated with or without HGF, fit with Equation (S8).
IC50 in µM Erlotinib Afatinib Crizotinib Trametinib
Cellname 11-18 EGFRL858R 11-18 EGFRL858R HGF+ 11-18 EGFRL858R BRAFV600E 11-18 EGFRL858R BRAFV600E HGF+ H1975 EGFRL858R,T790M H1975 EGFRL858R,T790M BRAFV600E H1975 EGFRL858R,T790M HGF+ H1975 EGFRL858R,T790M BRAFV600E HGF+
0.19 7.93 0.91 8.74 7.54 9.32 7.04 7.97
0.20 1.33 0.49 1.49 0.08 0.18 0.60 0.82
2.72 6.81 3.25 10.54 9.33 8.18 25.59 31.83
12.69 1.59 15.59 1.49 0.76 0.82 0.12 0.06
Vemurafenib 16.38 50.18 10.60 12.64 48.31 18.64 53.89 54.48
Table 2: Drug sensitivity as measured by the IC50 of erlotinib, afatinib, vemurafenib, trametinib and crizotinib in parental and engineered 11-18 EGFRL858R -positive lung adenocarcinoma cells.
IC50 Erlotinib in µM +0.5 µM Crizotinib +0.5 µM Trametinib +5 µM Vemurafenib
Cell name 11-18 EGFRL858R
0.30
0.19
0.30
11-18 EGFRL858R HGF+
0.18
0.47
1.34
11-18 EGFRL858R BRAFV600E
1.64
0.08
0.09
11-18 EGFRL858R BRAFV600E HGF+
3.58
7.95
0.86
H1975 EGFRL858R,T790M
3.51
7.83
15.39
H1975 EGFRL858R,T790M BRAFV600E
3.71
7.68
9.86
H1975 EGFRL858R,T790M HGF+
7.78
8.20
31.01
H1975 EGFRL858R,T790M BRAFV600E HGF+
6.70
5.50
103.67
Table 3: Drug sensitivity as measured by the IC50 of erlotinib in combination with 5 µM vemurafenib, 0.5 µM trametinib and 0.5 µM crizotinib in parental and engineered 11-18 EGFRL858R -positive lung adenocarcinoma cells.
IC50 Afatinib in µM +0.5 µM Crizotinib +0.5 µM Trametinib +5 µM Vemurafenib
Cell name 11-18 EGFRL858R
0.42
0.17
0.11
EGFRL858R
1.96
0.79
1.27
11-18 EGFRL858R BRAFV600E
1.10
0.32
0.37
11-18 EGFRL858R BRAFV600E HGF+
2.60
0.48
2.54
H1975 EGFRL858R,T790M
0.06
0.01
0.04
H1975 EGFRL858R,T790M BRAFV600E
0.07
0.03
0.04
H1975
EGFRL858R,T790M HGF+
0.19
0.00
0.11
H1975
EGFRL858R,T790M BRAFV600E HGF+
0.41
0.00
0.61
11-18
HGF+
Table 4: Drug sensitivity as measured by the IC50 of afatinib in combination with 5 µM vemurafenib, 0.5 µM trametinib and 0.5 µM crizotinib in parental and engineered 11-18 EGFRL858R -positive lung adenocarcinoma cells.
14
bioRxiv preprint first posted online Nov. 8, 2016; doi: http://dx.doi.org/10.1101/086553. The copyright holder for this preprint (which was not peer-reviewed) is the author/funder. It is made available under a CC-BY-NC-ND 4.0 International license.
Erlotinib Cell name
γ
n
Afatinib K
γ
n
2.59
0.54 1.22
11-18 EGFRL858R HGF+
0.61
3.81 7.93 1885.80 0.70 106610.00
11-18 EGFRL858R BRAFV600E
1.72
0.53 1.90 297.20
0.46 269500.00
11-18 EGFRL858R BRAFV600E HGF+
0.39
3.48 8.74 590.76
0.72
18112.00 0.22
H1975
EGFRL858R,T790M
73.45
K
11-18 EGFRL858R
0.32 424540.00
1.87
2.23 9.54
3.77
1.49
H1975 EGFRL858R,T790M BRAFV600E
1.50
3.86 9.70
5.14
0.62
3.67
H1975 EGFRL858R,T790M HGF+
0.52
3.67 7.04 250.96
0.56
21189.00
H1975 EGFRL858R,T790M BRAFV600E HGF+
0.31
3.50 7.97
1.26
3.57
5.14
Table 5: Differential equation parameters derived using Equation (S11), corresponding to experimentally derived dose response curves of erlotinib and afatinib for parental and engineered 11-18 EGFRL858R -positive lung adenocarcinoma cells.
Crizotinib Cell name
Trametinib
Vemurafenib
γ
n
K
gamma
n
K
γ
n
K
8.80
1.84
10.36
207.05
0.94
5504.20
825.97
0.95
27377.00
11-18 EGFRL858R HGF+
6.14
3.89
11.57
3.47
1.29
4.67
9.81
4.42
89.86
11-18 EGFRL858R BRAFV600E
74.60
1.59
61.34
1135.50
0.88
67225.00
672.41
0.69 236280.00
11-18 EGFRL858R BRAFV600E HGF+
235.65 0.57 270080.00
4.17
229.34
0.64 104240.00
11-18 EGFRL858R
3.51
1.36
H1975 EGFRL858R,T790M
6.98
1.68
34.62
28.40
0.26 1064100.00
1.56
5.88
50.20
H1975 EGFRL858R,T790M BRAFV600E
6.52
1.99
23.88
35.42
0.28 1223700.00
6.92
2.35
47.51
H1975 EGFRL858R,T790M HGF+
4.66
2.51
51.31
47.17
0.27
900880.00
9.35
4.95
89.74
H1975 EGFRL858R,T790M BRAFV600E HGF+
1.69
2.79
36.20
38.13
0.25
595280.00
8.62
4.92
89.37
Table 6: Differential equation parameters derived using Equation (S11), corresponding to experimentally derived dose response curves of crizotinib, trametinib and vemurafenib for parental and engineered 11-18 EGFRL858R -positive lung adenocarcinoma cells.
Erlotinib+0.5 µM Crizotinib Erlotinib+0.5 µM Trametinib Erlotinib+5 µM Vemurafenib Cell name
γ
n
K
γ
n
K
γ
n
K
11-18 EGFRL858R
49.60
0.32
215970.00
23.91
0.38
2057.10
1.87
0.45
0.96
11-18 EGFRL858R HGF+
13.87
0.31
2167.30
197.39
0.44
180410.00
4.03
0.44
46.41
11-18 EGFRL858R BRAFV600E
5.02
0.38
204.43
3.10
0.77
0.41
1.11
0.85
0.05
11-18
EGFRL858R
BRAFV600E HGF+
3.79
0.75
26.45
1.28
0.95
6.69
1.97
0.95
1.63
990.17
0.74
65062.00
6.43
0.80
110.13
3.01
0.97
53.62
H1975 EGFRL858R,T790M BRAFV600E
3.40
1.22
11.30
2.29
4.29
9.33
2.20
1.54
16.34
H1975 EGFRL858R,T790M HGF+
3.37
2.08
14.90
2.34
4.05
10.15
1.07
2.12
23.25
H1975 EGFRL858R,T790M BRAFV600E HGF+
3.65
1.22
21.97
2.06
1.76
8.08
3.04
1.27
271.56
H1975 EGFRL858R,T790M
Table 7: Differential equation parameters as derived using Equation (S11), corresponding to experimentally derived dose response curves of erlotinib in combination with either 0.5 µM crizotinib, 0.5 µM trametinib or 5 µM vemurafenib for parental and engineered 11-18 EGFRL858R -positive lung adenocarcinoma cells.
15
bioRxiv preprint first posted online Nov. 8, 2016; doi: http://dx.doi.org/10.1101/086553. The copyright holder for this preprint (which was not peer-reviewed) is the author/funder. It is made available under a CC-BY-NC-ND 4.0 International license.
Afatinib+0.5 µM Crizotinib Afatinib+0.5 µM Trametinib Afatinib+5 µM Vemurafenib
γ
n
K
γ
n
K
γ
n
K
11-18 EGFRL858R
Cell name
102.02
0.36
363520.00
190.37
0.42
116910.00
41.09
0.27
314410.00
11-18 EGFRL858R HGF+
212.01
0.49
209360.00
42.67
0.29
977910.00
66.90
0.36
344940.00
11-18 EGFRL858R BRAFV600E
310.67
0.52
132530.00
141.93
0.60
2315.40
101.84
0.35
673450.00
11-18 EGFRL858R BRAFV600E HGF+
1440.80 0.69
161180.00
54.46
0.31
621930.00
311.18
0.61
57467.00
0.19
19.69
0.18
572790.00
3.87
0.77
0.26
H1975 EGFRL858R,T790M H1975
EGFRL858R,T790M BRAFV600E
H1975 EGFRL858R,T790M HGF+ H1975 EGFRL858R,T790M BRAFV600E HGF+
3.75
1.25
3.68
1.44
1549.80 0.77 4.59
1.88
0.18
26.30
0.22
451080.00
3.70
1.07
0.17
4033.50
14.89
0.24
285.48
110.87
0.36
171470.00
1.02
35.76
0.23
34108.00
411.18
0.52
140300.00
Table 8: Differential equation parameters derived using Equation (S11), corresponding to experimentally derived dose response curves of afatinib in combination with either 0.5 µM crizotinib, 0.5 µM trametinib or 5 µM vemurafenib for parental and engineered 11-18 EGFRL858R -positive lung adenocarcinoma cells.
16
bioRxiv preprint first posted online Nov. 8, 2016; doi: http://dx.doi.org/10.1101/086553. The copyright holder for this preprint (which was not peer-reviewed) is the author/funder. It is made available under a CC-BY-NC-ND 4.0 International license.
References [1] Eigen M, McCaskill J, Schuster P (1989) The molecular quasi-species. Adv. Chem. Phys 75:149–263.
17