Windows Server 2003, Microsoft builds both kernel and user mode Windows ..... Utilizing a dedicated and lock-free buffering scheme, the trace file is written ...
NTrace: Function Boundary Tracing for Windows on IA-32 Johannes Passing, Alexander Schmidt, Martin von L¨owis, Andreas Polze Hasso Plattner Institute at University of Potsdam Potsdam, Germany {johannes.passing, alexander.schmidt, martin.vonloewis, andreas.polze}@hpi.uni-potsdam.de
Abstract—For a long time, dynamic tracing has been an enabling technique for reverse engineering tools. Tracing can not only be used to record the control flow of a particular component such as a piece of malware itself, it is also a way to analyze the interactions of a component and their impact on the rest of the system. Unlike Unix-based systems, for which several dynamic tracing tools are available, Windows has been lacking appropriate tools. From a reverse engineering perspective, however, Windows may be considered the most relevant OS, particularly with respect to malware analysis. In this paper, we present NTrace, a dynamic tracing tool for the Windows kernel, drivers, system libraries, and applications that supports function boundary tracing. NTrace incorporates 2 novel approaches: (1) a way to integrate with Windows Structured Exception Handling and (2) a technique to instrument binary code on IA-32 architectures that is both safe and more efficient than DTrace. Keywords-Reverse engineering; Software debugging; Operating system kernels
I. M OTIVATION AND I NTRODUCTION Computer systems are inherently complex. An ever growing set of interfaces and functionality can be identified at every single system layer. Residing at the border between software and hardware, the operating system itself is no exception to this rule. Coming along with this complexity, the potential interactions and impacts caused by application software is diverse and their analysis requires specialized tools. On Windows, where source code of the kernel, device drivers, and libraries is usually not available, dynamic tracing can be a powerful technique enabling such analysis. Although the focus of dynamic tracing has traditionally lain on development and debugging of production systems, we find that reverse engineering tools pose remarkably similar requirements on dynamic tracing techniques. Within this paper we are presenting a novel solution for instrumenting the Windows kernel, device drivers, and libraries for dynamic tracing. We consider the techniques used by NTrace to be equally suitable for building reverse engineering tools as well as for creating debugging tools for production systems. There are various approaches towards dynamic tracing. Besides relying on hardware-generated events, tracing can be based on modifications to the execution environment (i.e., interpreter, just-in-time compiler), or modifications to the
binary code itself. Typically, these approaches assume the general model of a von-Neumann computer with support for sequential program execution. In contrast to most Unix systems, the Windows model for program execution assumes existence of the structured exception handling mechanism (SEH), which is comparable to the exception concept present in Ada, Java, or C++. However, SEH is not implemented as part of a specific language runtime but rather integrated with the operating systems mechanisms for process and thread creation and program execution. SEH significantly impacts the execution model for programs in Windows. Our solution for instrumenting Windows takes SEH into account and extends the program-rewriting approach to dynamic tracing with support for synchronous exception handling. A. Function Boundary Tracing While dynamic tracing can be performed at various levels of detail, this paper focusses on Function Boundary Tracing, which for many applications, we consider to be the most versatile and generic approach. First, it can be used to trace control flow of arbitrary applications in order to better understand system behavior. Second, by measuring occurrences of pairing function entry and function exit/exception events, it is easily possible to derive a timing profile of a given application. Last but not least, monitoring applications is possible by instrumenting certain functions that may indicate resource shortage or suspicious behavior. Over the past decades, a variety of approaches for implementing dynamic tracing in general and function boundary tracing in particular have evolved. To allow assessing these approaches, we have identified three aspects to be of particular interest: •
•
Runtime Overhead. The runtime overhead of tracing, i.e. the degree to which the traced system is slowed down, clearly is of paramount importance for the applicability of a tracing system: Not only may the overhead impact the timing behavior of the system, being frugal in terms of overhead also is a requirement for the system to be applicable on production systems. Coverage, i.e. the percentage of functions (in relation to all functions the individual traced system comprises) the tracing system is capable of instrumenting.
•
Risk. Adding instrumentation to a system changes the system and therefore entails a certain intrusiveness. More precisely, the activity of adding instrumentation and tracing execution flow can potentially cause faults and therefore invariably introduces a certain risk.
•
Taking these three aspects into account, and focussing on the IA-32 architecture, a number of conclusions may be drawn from regarding existing dynamic tracing facilities: •
•
•
•
•
•
Using hardware features such as last branch recording and branch trace storage [1] tends to yield information too fine-grained to be of significant use for function boundary tracing. For many systems, and the NT kernel in particular, relying on environment modifications, such as patching function pointers and Vtables to redirect execution flow into instrumentation routines falls short w.r.t. coverage and is therefore not universally applicable. Systems relying on dynamic compilation [2] or dynamic binary translation [3] feature high coverage and low overhead. However, their intense reliance on flow analysis and disassembly introduces a non-negligibe risk: Disassembly algorithms have known shortcomings regarding the disassembly of arbitrary IA-32 code and their usage therefore involves the danger of silently yielding false results[4] – which in turn can jeopardize system stability. Relying on the injection of trap-generating instructions avoids several of the challenges concerning runtime code modification and allows high coverage to be achieved, yet, the overhead of trap handling is significant and invariably leads to a relatively high runtime overhead. Performing in-place modifications on the code to incorporate branch instructions so that execution flow is redirected to instrumentation routines is advantagous regarding runtime overhead and, depending on the individual approach, may also allow high coverage to be achieved. However, due to its variable-length instruction set, approaches implementing this technique face significant challenges on the IA-32 architecture. Systems such as KernInst [5] and DTrace [6], for example, while using this technique on SPARC, therefore revert to the injection of trap-generating instructions on IA-32. The ramifications and challenges regarding Structured Exception Handling have not been sufficiently covered by any of the existing tracing solutions.
Based on these observations, a universal, low-overhead, high-coverage and low-risk function boundary tracing solution for the IA-32 architecture is not in sight. Nonetheless, we see significant room for improvement. The main contributions of this paper in this regard are: •
Integrating with the Windows NT Structured Exception
•
Handling facilty. Being able to to trace exception unwinds is an important requirement for allowing reliable reconstruction of the control flow of a system – this is particulary the case when analyzing error cases. Leveraging the Hotpatching features of recent Windows NT kernel editions, we present an implementation of the technique of using in-place code modification and injection of branch instructions. The technique features low runtime overhead and is able to sidestep the disassembly-related challenges imposed by the IA-32 architecture. Although sacrificing a certain degree of coverage, the technique is therefore particularly wellsuited for analysis of production systems where risk is of utter concern. Furthermore, the technique is equally applicable to kernel mode components, including device drivers, as to user mode libraries and executables such as kernel32, ole32, and Windows Explorer. II. C HALLENGES FOR T RACING W INDOWS
Implementing a dynamic tracing system requires a number of challenges to be addressed, including, but not limited to the following: • Re-entrance of the Tracing Facility Sharing the address space and further resources with the traced operating system kernel/process, the tracing facility must be careful to properly share and coordinate access to these resources. In particular, the tracing system must avoid calling routines which have themselves been instrumented for tracing in order to avoid hazardous forms of re-entrance and endless recursion. • Memory Protection Certain instrumentation activity, in particular performing runtime code modification, commonly entails having to modify memory pages which have been marked write-protected. Such restrictions can be temporarily disabled or circumvented, yet stability and integrity of the system have to be maintained. • Life Cycle Management of Dynamically Allocated Code Dynamically detaching from the system, i.e. revoking instrumentation and releasing resources may involve freeing memory containing code. Due to concurrently running as well as preempted threads, however, deciding on the safety of such operation is non-trivial and requires careful checks or tracking of the usage of these resources. • Runtime Code Modification Whenever code is to be modified at runtime, in particular on systems comprising multiple processors, any modification on code has to be performed in a safe manner. That is, the instrumentation technique has to guarantee that a routine is either run in its unmodified version or run in its modified version and that the behavior of the modified routine is equivalent to its non-instrumented counterpart. In this context, we consider the behaviors
III. NT RACE In order to address the issues described in the previous section, and Structure Exception Handling (SEH) in particular, we present our tracing approach called NTrace. NTrace is a tracing suite comprising a management application resembling a command line debugger as well as two agents. One agent, implemented as a loadable device driver, implements kernel mode tracing and allows the Windows kernel itself as well as kernel mode device drivers and DLLs to be instrumented and traced. The second agent implements tracing of user mode applications and libraries. In order to allow arbitrary processes to be analyzed, it is implemented as a DLL which is injected into the respective process on demand. Both agents use the same tracing technique, albeit with minor adaptions to account for the different operation environments. The tracing technique leveraged by NTrace is based on inplace code modification and injection of branch instructions. In order to conduct such code modifications in a safe manner, NTrace utilizes certain properties introduced by the Microsoft Hotpatching infrastructure [7]. Starting with Windows Server 2003, Microsoft builds both kernel and user mode Windows components as hotpatchable images. Those image have two fundamental properties: (1) There is a certain padding area between functions and (2) hotpatchable functions have a certain noop-prologue, which we utilize to address safety issues.
CallProxy:
(3)
...
(2)
Foo:
(1)
(7) (6)
(5)
Figure 1.
(4) EntryThunk:
...
An additional challenge posed by Windows NT, both for kernel and user mode tracing, is dealing and integrating with the built-in Structured Exception Handling (SEH) facility: SEH exceptions are not only used for handling software exceptions, i.e. exception explicitly raised via RtlRaiseException. It is also used for handling certain hardware-defined faults or traps such as Integer divide by zero conditions. Handling an exception often involves unwinding, which means that one or more routines are left prematurely. Such premature exit, however, implies that the routine will not return in the classical sense. As such, besides function entry and exit events, exception unwinds have to be regarded as a third kind of event. In order to be able to capture the event of an exception being raised, and, in particular, recognize the fact that a traced routine is about to be left prematurely due to an exception unwind, however, requires appropriate integration with the Structured Exception Handling infrastructure.
Foo‐5:
...
equivalent if during execution, all non-noop instructions of the modified routine are executed in the same order as in the unmodified routine. Still, the modified version may contain additional jump or branch instructions as long as they do not violate the constrains defined above.
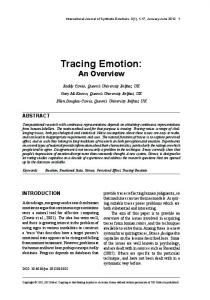
Schematic execution flow for tracing function Foo
A. Operation In order to capture function entry and exit events, NTrace performs the modifications, illustrated in Figure 1, to our sample function Foo. Hotpatchable functions, by definition, start with a mov edi, edi instruction, which is semantically a two-byte noop. NTrace replaces this instruction with a two-byte jump instruction. Due to the space constraints, the jump cannot direct control into our instrumentation routine. As shown in figure 1, it rather redirects to the padding area preceding the function (2). We use this padding area as a trampoline into the CallProxy routine (3). It is worth noting that due to the fact that the padding area can be considered as dead code, the runtime code modification is effectively limited to a single instruction, replacing the mov edi, edi. Moreover, no true disassembly is required by this approach – only the presence of the padding area and the mov edi, edi instruction have to be verified. Both can be implemented by a simple memory comparison. We guard the process of replacing the noop instruction with compliance to the Intel algorithm defined for crossmodifying code [1]. We disable interrupts and issue deferred procedure calls (DPCs) on all processors, if necessary, except for the one performing the replacement in order to stall execution until the modification has been completed. Finally, a serializing instruction, cpuid, is performed on all CPUs to take the modification into effect. Having entered Foo (1) and taken the short jump, execution reaches the padding area (2). We use it as a trampoline as it is usually 5 bytes in size which allows for jump distances large enough to reach our pre-processing routine CallProxy (3). As CallProxy, and EntryThunk as well, are generic pre- and post-processing routines shared by all instrumented functions, we provide information where to redirect control after capturing the events. For that reason, we replace the padding area by a near call instruction resulting in pushing Foo’s address onto the stack. Following this call instruction (3), execution reaches
CallProxy, which first performs a call to EntryThunk (4). This series of call instructions leaves us a stack containing the following information (in pop-order): (a) The address of the CallProxy instruction following the call instruction. We will use this code to perform exit-event tracing. (b) Foo’s address, which is necessary to return control after entry-event tracing has been performed into the traced function and (c) the return address after leaving function Foo. Based on this setup, EntryThunk performs the following steps: • Raise the entry event. • Update the stack in such a way that any return instruction within Foo will end up in CallProxy+5. • Restore the stack in order to allow Foo to use its parameters, if necessary. • Resume execution at Foo+2. The original return address has to be stored in order to return to the caller of Foo after exit-event tracing has been performed. We maintain a thread-local auxiliary stack where we store the return addresses and further bookkeeping information. Foo will eventually return in one of two ways. Either it returns normally or it is aborted prematurely by an exception. Exception handling will be discussed in more detail in the following section. In the normal case, Foo will return normally and execution will resume at CallProxy+5 (6), where the postprocessing takes place. Having obtained the necessary information from the auxiliary stack, the exit event can be raised by invoking the appropriate callback routine. After this has been accomplished, the scratch data has to be removed from the stack and register contents have to be restored so that stack and registers are in the same state as they were after return from Foo. Finally, execution can be transferred to the caller by pushing the original return address and performing a simple ret instruction. After the return, execution resumes at the caller as normal. Facilitating the auxiliary stack allows nesting, i.e., traced functions may call other traced functions. If, however, the execution of CallProxy or EntryThunk is interrupted by an interrupt service routine (ISR) which itself is instrumented for tracing, a situation can arise where CallProxy or EntryThunk are re-entered. While CallProxy and EntryThunk are partialy re-entrant, they both contain a window of instructions (dealing with allocation and maintenance of the auxiliary stack) that is not safe w.r.t re-entrance. Whenever such re-entrance is detected, NTrace degrades gracefully and will cause the affected routine to be run untraced. Although leading to an event effectively being lost, this approach ensures that the consistency of internal data structures is maintained. It is worth pointing out that the auxiliary stack also allows us to solve the problem of dealing with life-cycle
Module!Routine5 Module!Routine4 Module!Routine3 Module!Routine2 Module!Routine1
handled by
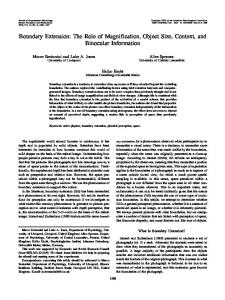
Figure 2. An example callstack when an exception is raised. Gray boxes denote stack frames of traced routines.
management of dynamically allocated code: We only allow the NTrace agent to unload when all instrumentation has been removed and all auxiliary stacks have been verified to be empty. Not before these conditions are met, the NTrace code is guaranteed to be not used any more and is safe to be unloaded. Finally, we overcome memory protection by leveraging Memory Descriptor Lists to create secondary virtual address mappings, a technique that has been described by Hoglund and Butler [8]. B. Structured Exception Handling The Windows kernel supports three types of function boundary events: entry, normal exit, and abnormal exit. The last type of event is caused by exceptions using the structured exception handling infrastructure (SEH) of the Windows NT kernel. Such prematurely leaving a traced routine means that post-processing is skipped. Yet, skipping post-processing of a routine results in the corresponding auxiliary stack frame to not be popped. As a consequence, exception unwinds endanger the coherence between call stack and auxiliary stack. Such incoherence entails two basic issues. The minor issue is a resource leak: The un-popped frames on the auxiliary stack will remain on the stack and new frames will be pushed atop of these frames. Preventing the auxiliary stack from ever becoming empty again, these frames effectively denote a resource leak. Diminishing the effective size of the stack, they also raise the probability of stack depletion. While NTrace is able to deal with depletion, we attempt to avoid such situations for that they cause events to be missed. The second issue, however, is of major concern. An example is illustrated by Figure 2: Depicting a call stack, the stack is drawn growing bottom-up. Each box denotes a call frame, gray boxes denote call frames of traced routines. Routine5 raises an exception, which is handled by Routine3 and leads to an unwind. If NTrace does not anticipate correctly, one frame will now be leaked on the auxiliary stack. If Routine3 and Routine2 later return, post-processing for the latter routine has to take place. That is, the topmost frame is popped from the auxiliary stack and is used to obtain and reconstruct the original return address. However, as the top frame denotes the leaked frame and is thus not the frame corresponding to the call frame of Routine2, this address
is wrong – rather than pointing into Routine1, it will point into Routine3. Needless to say, continuing execution at the wrong return address will lead to behavior that may be considered arbitrary. In order to both be able to capture the event of an exception unwind taking place, and maintain coherence between call stack and auxiliary stack, appropriate integration with the exception dispatching process is required. Kernel mode SEH, however, does not provide any notification or hooking mechanisms that would readily support such integration. Aiming to be compatible with the retail kernel, on the other hand, prohibits extending the implementation of SEH to provide for such means. When an exception is raised, the kernel invokes RtlDispatchException, which walks the list of registration records, calling each handler routine until it finds a handler agreeing to handle the exception. If handling the exception entails continuing execution at a different code location, it is among an exception handler’s responsibilities to initiate the second phase of exception handling – the unwinding phase – by calling RtlUnwind. During unwinding, the list of exception registration records is walked once more, giving each of the handlers previously having declined to handle the exception the opportunity to perform certain cleanup work. Further details on SEH can be found in [9]. Given this algorithm and being restricted to using existing SEH mechanisms, the route chosen by NTrace is as follows: Each traced routine is effectively surrounded by a try/finally construct. That is, during pre-processing, an SEH registration record is set up and maintained until post-processing, which in turn tears down the registration record. In case the routine returns normally, the existence of the registration record is ignored. In case of an exception unwind, however, the exception handler is given the opportunity to deliver an appropriate event and adjust the auxiliary stack. While this approach is conceptually trivial, there are two problems: first, creating an SEH registration record on IA-32 architectures requires an EXCEPTION_REGISTRATION_RECORD structure to be set up on the stack and be maintained during the lifetime of a call. However, we cannot create such a record on the stack as this would change the stack frame in a way that is likely to hinder proper execution of the traced routine. Second, we cannot create an exception record on our auxiliary stack and enqueue it properly into the exception chain: For security reasons, the SEH implementation requires exception records to be allocated on the stack of the thread causing the exception. To circumvent these restrictions, we perform the following actions. During the pre-processing phase of an entry event, we locate the closest exception registration record on the stack. We replace the exception handler address of this record with the address of our exception handler proxy, called ExceptionProxy, and store the original
handler address in the current auxiliary stack frame. If the traced function terminates normally, we restore the original state of the exception record. If, however, an exception occurs, the exception dispatch function of the Windows kernel, RtlDispatchException sooner or later calls ExceptionProxy. In order to preserve semantics, ExceptionProxy will in this case merely delegate the call to the original exception handler routine. Two situations may occur: (1) The original handler declines to handle the exception and instead, a handler of one of the underlying registration records takes over the responsibility of handling the exception. If this includes unwinding, ExceptionProxy will be called again, being given the opportunity to perform cleanup work, which, in this case, entails tracing the event and adjusting the auxiliary stack. (2) If, however, the original handler agrees to handle the exception, the situation is more intricate: When unwinding is performed in this case, neither will the original handler return to ExceptionProxy (it will perform a continuation), nor will ExceptionProxy be called again to allow cleanup work. To mitigate this situation, we therefore set up another, temporary exception registration record before delegating a call to the original handler. Using a separate handler routine, UnwindHandler, allows us to be notified about an unwind taking place, and hence to properly trace the event and adjust the auxiliary stack in either situation. It is possible that more than one stack frame of a traced routine maps onto a single exception record. In such cases, the handler is not exchanged once again – instead, the logic implemented to adjust the auxiliary stack is capable of detecting the number of auxiliary stack frames to be removed (and hence, the number of exception events to be raised) by inspecting the respective exception record and its correlation to a frame in the auxiliary stack. 1) Empty SEH Chain: Another situation that has been ignored so far is the possibility that no SEH record has yet been installed when a traced routine is called. That is, the respective pointer in the PCR contains the special value EXCEPTION_CHAIN_END. In such situations, the scheme as discussed so far is not applicable. It is, however, also not necessary to install an additional exception handler in this case: If no SEH record has been installed and one of the functions indirectly called by the traced routine raises an exception while still no SEH frame has been set up, this exception will necessarily be left unhandled and lead to a bugcheck (Windows blue screen). The fact that an auxiliary stack frame has been leaked is in this case of no real concern as the system is about to stop. As a consequence, if the PCR is found to not have a single exception registration record registered, the entire process of installing an additional exception handler can safely be skipped.
Finally, it is worth mentioning that the entire implementation is SafeSEH-conforming. C. Using NTrace for Creating Trace Files The core implementation of NTrace focuses on the act of capturing function entry, exit and unwind events, leaving the consumption of these events to external components. Although by far not being the the only conceivable use case, one application that has been implemented on top of NTrace is capturing the event data and writing it to a trace file. Once such a trace file has been created, it can be browsed using appropriate tools to observe call-relationships of functions. Utilizing a dedicated and lock-free buffering scheme, the trace file is written asynchronously by a system thread. IV. R ELATED W ORK Specialized tools such as the COM Universal Delegator [10] and IRPTracker [11] are able to trace the execution of selected functions by modifying appropriate function pointers and Vtables. Although comparatively straightforward to implement, the inability to instrument function calls which are not dispatched through a function pointer severely limits the generic applicability of this technique. In sharp contract to this, tools relying on interpretation, dynamic compilation, or dynamic binary translation to weave in instrumentation code are widely applicable and allow tracing on a very fine-grained level. One of the first tools to implement this technique was Shade [2]; later implementations include Valgrind [12] and DynamoRio [13]. Pin [14] uses a similar approach, yet has introduced the capability of attaching to a running process. While the former tools are all limited to user mode tracing, Olszewski et al. [15] have shown that the technique is also suitable for instrumenting a running operating system kernel. However, despite their remarkable capabilities, the intense relicance of disassembly, as indicated before, can potentially undermine system stability and therefore incurs a nonnegligible risk. Another potentially less relevant, yet still important drawback of these solutions turns out to be the bootstrapping: To successfully interpose code execution, the tracing facility must either be present from the start of the respective program on or it must be injected and be provided some form of jump aid. Requiring the tracing facility to be present during program startup has to be considered a contradiction to the tracing solution being truly dynamic. In the second case, the tracing solution can only be as good as its jump start facility is – the more limited the number of potential entry points is, the more limited will the applicability of such a solution be. Detours [16] as well as the SPARC implementations of DTrace [6] and KernInst [5] perform in-place modifications on the code to incorporate branch instructions that redirect execution to instrumentation code. On IA-32, which, unlike SPARC, uses a variable length instruction set, such in-place
modifications require significantly more attention in order to be conduced in a safe manner. In fact, we were able to create situations in which Detours failed to properly handle speific issues of runtime code modification and led to crashes. Presumably due to this added complexity, both DTrace and KernInst revert to relying on traps rather than on jumps on IA-32. Injecting and handling traps is a technique that modifies the binary code by inserting trap instructions, like int 3, and providing appropriate trap handlers. As dealing with traps is at the core of hardware and an operating system’s capabilities, this approach can be expected to be feasible on a very wide range of operating systems and hardware architectures. Although avoiding several of the potential runtime code modification-related hazards, an inherent drawback of this approach, is the non-negligible overhead associated with the handling of traps as was shown by Hiramatsu [17]. Noteworthy tools applying this technique include Paradyn [18] and GILK [19]. While the tracing technique implemented by NTrace resembles the approach taken by DTrace on SPARC, it stands out by the fact that it fully integrates with the Windowsspecific Structures Exception Handling. Moreover, NTrace demonstrates that by leveraging the Microsoft Hotpaching infrastructure, it is possible to implement tracing based on in-place code modifications in a safe manner, even on multiprocessor IA-32 machines. V. E VALUATION One of the aims of NTrace being to minimize the overhead induced by tracing activity, we chose to evaluate the performance of NTrace for kernel mode tracing and conducted a comparison to the Function Boundary Tracing (FBT) provider of DTrace. To put the results into relation, we also included the DTrace Syscall Provider into our measurements, which we consider to have near-optimal performance. DTrace is being recognized as a mature and widely used tracing solution and can therefore be regarded a natural choice to compare the performance of NTrace to. Moreover, due the fact that the DTrace FBT provider uses differing implementations on IA-32 and SPARC, including DTrace in the evaluation allowed us to assess the following hypotheses: 1) As the IA-32 implementation of DTrace, unlike the SPARC implementation, uses traps to trace execution, we expect the runtime overhead of DTrace on IA-32 to be significantly higher than on SPARC. 2) We expect NTrace, which runs on IA-32, yet does not rely on the usage of traps, to perform significantly better than DTrace on IA-32. DTrace being part of Sun Solaris and running on both IA-32 and SPARC, different operating system builds and hardware had to be used to conduct the evaulation. In order to avoid the choice of operating system, hardware, and different compilers having significant impact on the results,
we chose to perform a micro-benchmark and avoid direct comparison of timing results. The benchmark itself consists of repeatedly performing a simple, nonblocking system call and measuring the overall time elapsed. We chose the getpid system call and performed 500,000,000 calls per test run. Each test run was conducted two times – first, without any instrumentation present, and second, with entry and exit of the system call being traced. To avoid script execution and tracing output to impact the results, we used an empty D probe for DTrace and suppressed output generation by using the -q command line switch. Similarly, we configured NTrace to use empty event handlers for function entry, exit, and exception events. The SPARC benchmarks were conduced on a 4 CPU Sun Fire V440 with 16 GB of RAM running Solaris 10 (SunOS 5.10, 64 bit). The IA-32 benchmarks were performed on a machine with an Intel Core 2 Quad Q6600 2.4 GHz QuadCore Processor and 2 GB of RAM, running OpenSolaris 10 (SunOS 5.11, 32 bit). We assume that the Solaris implementation of getpid is sufficiently similar on both architectures. Based on this assumption, it is possible to compare the performance of DTrace on both systems by measuring the relative overhead caused by the instrumentation. Table I lists the results of our measurements and the relative slowdown figures for each configuration. While the performance differences between the Syscall providers on IA-32 and SPARC are modest, the DTrace FBT provider performs significantly worse on IA-32 than on SPARC (284% vs. 107%). We expect this to be due to the implementation differences and consider it to be a proof of our first hypothesis, namely, that the usage of traps to implement tracing incurs a siginificant performance penalty. To compare the performance of NTrace with DTrace, we used the same IA-32 machine to perform another test run using NTrace on Windows 2003 Server Enterprise Edition (SP2, 32 bit). Again, we performed 500,000,000 system calls and used NtIsProcessInJob as a non-blocking, reasonably simple service to call. Although running on the same hardware and being of similar nature, the execution times of getpid and NtIsProcessInJob are clearly not comparable. It is, however, reasonable to assume that both for DTrace and NTrace, the overhead caused by tracing the invokation of a routine is independent of the length (and thus, execution time) of the individual routine. Based on this assumption, it is legitimate to compare the total overhead induced by tracing. With 87423 ms overhead on IA-32 (compared to 399166 ms), NTrace outperforms DTrace by a factor of roughly 4.5. We attribute this to the more advanced instrumentation technique used by NTrace and see this as a proof of our second hypothesis.
Although a direct comparison of NTrace and DTrace/SPARC is hardly possible, the fact that DTrace/IA32 adds about 4.1 times more overhead than DTrace/SPARC and about 4.5 times more overhead than NTrace is a strong indicator for NTrace achieving similar, if not better, performance than DTrace/SPARC. It is worth noting that with trace file creation enabled – which involved capturing the data and writing a total of 7.3 GB of trace data to disk – the overhead of NTrace was 130891 ms, which is still three times lower than DTrace. Another aspect closely related to runtime overhead is scalability, i.e., the question of how the performance and overhead evolves when the number of instrumented routines rises. To address this aspect of performance, a second benchmark has been developed and performed. Instrumented to various degrees, a Windows Server 2003 SP2 system (retail kernel) has been analyzed while performing a build of the entire Windows Research Kernel [20] source tree on the IA32 machine mentioned previously. Besides measuring the elapsed time taken for a build, performance counters were used to capture further performance-related data. The specific workload has been chosen for generating a significant amount of I/O operations – and therefore system calls – as well as involving frequent process startups and tear downs. For each configuration, ten such builds were performed. To analyze how the degree of instrumentation influences the overhead, ten runs have been performed, each using a different configuration. The configurations differ in the set of instrumented routines. The initial set, S100 , contains all routines of the kernel image itself (ntoskrnl.exe). This image consists of 6012 function out which we could instrument 5131 functions. Some of the non-instrumentable functions were written in assembly and are therefore not hotpatchable. Others are preceeded by padding, yet do not begin with a mov edi, edi instruction. We are currently working on a slightly adapted instrumentation scheme for the latter fraction of functions that, by the use of an additional trampoline, allows us to raise the percentage of instrumentable functions further. Based on the number of events captured for a run using this configuration (S100 ), nine further routine sets have been created. Each set has been manually chosen based on the anticipated number of events a run using such a configuration would yield. For example, the configuration S20 has been select to yield a fraction of approximately 20 percent of the initial set. Table III gives an overview on the selected configurations. The partition of functions is based on the Windows NT naming conventions. Functions belonging to one component usually share the same two letters abbreviating the respective module. For example, the Io prefix is used in all functions that implement the I/O system, the Ex prefix precedes all
Table I DT RACE IA-32 VS . SPARC ISA/Provider
DTrace DTrace DTrace DTrace
SPARC Syscall IA-32 Syscall SPARC FBT IA-32 FBT
Total time w/o instr. [ms] 63124 290850 59332 539092
Total time w/ instr. [ms] 33550 139926 33550 139926
Relative slowdown 88% 108% 77% 285%
Table II NT RACE VS . DT RACE ON IA-32 ISA/Provider
DTrace IA-32 FBT NTrace IA-32 FBT
Total time w/o instr. [ms] 539092 174595
Total time w/ instr. [ms] 139926 87000
Total overhead [ms] 399166 87595
Table III ROUTINE S ETS Name
Set (Prefixes)
S0 S10 S20 S30 S40 S50 S60 S70 S80 S90 S100
(none) Se Io Io, Ob Ex, Mi Ex, Mi, Ex, Mi, Ex, Mi, Ex, Mi, Ex, Mi, *
Ob Io Io, Se Io, Se, Ob Io, Se, Ob, Fs, Cc
function names of functions that implement the Executive component, and so on. More details on the components of the Windows kernel can be found in [21]. It is worth pointing out that the aim of this benchmark is to measure the overhead imposed by capturing function entry, exit, and exception unwind events only. As such, no further processing is performed using the events – once captured, they are dropped immediately. We created a third benchmark to give an impression on how system performance is affected when our instrumentation facility is used for an application. Our sample application is to construct dynamic call graphs that help understand the otherwise opaque Windows kernel better. Starting with a system service call, the call graph then shows the control flow throughout the kernel and its modules until completion of the service call. We create the call graph in a post-mortem manner, i.e., we first persistently log all function entry, function exit, and function exception events, disable the instrumentation, and create afterwards the call graph. How to log log entries persistently has been discussed in Section III-C. Although logging events asynchronously, writing events back to a secondary storage incurs additional I/O operations, which
Estimated output (relative to S100 ) 0% 10% 20% 30% 40% 50% 60% 70% 80% 90% 100%
Number of routines 0 182 685 813 681 809 1365 1546 1674 1995 5131
Table IV M EASUREMENTS : C OST PER CAPTURE
S10 S20 S30 S40 S50 S60 S70 S80 S90 S100
Relative Cost per Cost/100M Overhead per single captures [ms] 100M catures capture [ns] 1,078 1.38% 10.78 1,075 1.37% 10.75 1,067 1.36% 10.67 1,023 1.31% 10.23 1,041 1.33% 10.41 1,019 1.30% 10.19 1,030 1.32% 10.30 1,106 1.41% 11.06 1,178 1.50% 11.78 1,075 1.37% 10.75
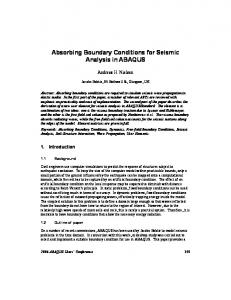
increases the impact on the performance of the system. The results of these two benchmarks are shown in figure 3. While the total overhead is as low as 11% (capturing only) and 23% (example use case) for S10 , the overhead increaes up to a maximum of 124% and 361%, respectively, for S100 . At this level, NTrace handled up to 3.2 million events per second. Based on these values, the average cost of handling a single event can be calculated. Ideally, the cost per event
400000 Kernel, example use case Kernel, capturing only 350000
run time (ms)
300000
250000
200000
150000
100000
50000 S0
S10
S20
S30
S40
S50
S60
S70
S80
S90
S100
routine sets
Figure 3.
Total run time
2% 1.8%
overhead
1.6%
Our approach minimizes the impact on system operation, thus making it possible to use the NTrace tool for debugging or reverse engineering purposes, even in production environments. Indeed, our experiments indicate that the instrumentation of select parts of the kernel (or select drivers) will induce execution time overheads in the order of 5 percent or less. Structured exception handling (SEH) lies at the heart of the Windows thread execution model. SEH is used throughout the Windows kernel and presents a fundamental difference in system behavior in contrast to the UNIX execution model. Integrating exception handling with the NTrace framework presented an additional challenge, however, we have developed (and described) a solution that meets all constraints of the system, and smoothly integrates with the rest of the framework. At Hasso-Plattner-Institut, we have already received positive feedback from students actively using NTrace in conjunction with the Windows Reseach Kernel to explore and learn about the inner workings of the Windows kernel. Future work will extend the current NTrace implementation with frontend tools comparable to those found in other frameworks, such as the Solaris DTrace.
1.4%
R EFERENCES 1.2%
[1] Intel Corporation, Intel 64 and IA-32 Architectures Software Developer’s Manual, 2007, vol. 3B: System Programming Guide, Part 2.
1% 0.8% 0.6% S10
S20
Figure 4.
S30
S40
S50 S60 routine sets
S70
S80
S90
S100
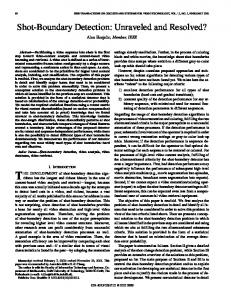
Overhead caused by each 100 million captures
would be constant across all configurations. In a poorly scaling implementation, in contrast, the cost would increase proportionally to the degree of instrumentation. Table V and Figure 4 show the results of this calculation. Although not constant, the cost per 100 million captures varies only slightly. VI. C ONCLUSION NTrace is a novel approach towards dynamic tracing of user- and kernel- mode thread execution in context of the Windows operating system. Initially developed on the Windows Research Kernel, NTrace is applicable to the current retail versions of Windows (Vista, Server 2003, Server 2008). NTrace relies on dynamic instrumentation of the Windows kernel and allows for analyzing control flows in the Windows kernel (and device drivers) as well as in compatible userspace applications (with respect to function entry and exit).
[2] R. Cmelik and D. Keppel, “Shade: A fast instructionset simulator for execution profiling,” ACM SIGMETRICS Performance Evaluation Review, vol. 22, no. 1, pp. 128–137, May 1994. [Online]. Available: citeseer.comp.nus.edu.sg/ 175806.html [3] C. Cifuentes and V. Malhotra, “Binary translation: Static, dynamic, retargetable?” [Online]. Available: citeseer.ist.psu. edu/cifuentes96binary.html [4] B. Schwarz, S. Debray, and G. Andrews, “Disassembly of executable code revisited,” 2002. [Online]. Available: citeseer.ist.psu.edu/schwarz02disassembly.html [5] A. Tamches and B. P. Miller, “Fine-grained dynamic instrumentation of commodity operating system kernels,” in Operating Systems Design and Implementation, 1999, pp. 117–130. [Online]. Available: citeseer.ist.psu.edu/article/ tamches99finegrained.html [6] B. Cantrill, M. W. Shapiro, and A. H. Leventhal, “Dynamic instrumentation of production systems.” in USENIX Annual Technical Conference, General Track, 2004, pp. 15–28. [7] Microsoft Corporation, “Using hotpatching technology to reduce servicing reboots,” URL http://technet.microsoft.com/ en-us/library/cc787843.aspx, 2008. [8] G. Hoglund and J. Butler, Rootkits: Subverting the Windows Kernel. Addison Wesley, 2005.
[9] M. Pietrek, “A crash course on the depths of win32 structured exception handling,” Microsoft Systems Journal, vol. 12, no. 1, January 1997. [Online]. Available: http: //www.microsoft.com/msj/0197/Exception/Exception.aspx [10] K. Brown, “Building a Lightweight COM Interception Framework, Part I: The Universal Delegator,” Microsoft Systems Journal, Vol 14 No 1, 1999, uRL http://www.microsoft.com/ msj/0199/intercept/intercept.aspx, retrieved 10.04.2008. [11] O. O. S. Resources, “OSR’s IRPTracker – Tracking the Life of an IRP in Detail,” pp. 10–11, 2003. [12] N. Nethercote, “Dynamic binary analysis and instrumentation,” Ph.D. dissertation, Trinity College, University of Cambridge, 2004. [13] D. L. Bruening, “Efficient, transparent, and comprehensive runtime code manipulation,” Ph.D. dissertation, Massachusetts Institute of Technology, 2004. [14] C.-K. Luk, R. Cohn, R. Muth, H. Patil, A. Klauser, G. Lowney, S. Wallace, V. J. Reddi, and K. Hazelwood, “Pin: building customized program analysis tools with dynamic instrumentation,” in PLDI ’05: Proceedings of the 2005 ACM SIGPLAN conference on Programming language design and implementation. New York, NY, USA: ACM, 2005, pp. 190– 200. [15] M. Olszewski, K. Mierle, A. Czajkowski, and A. D. Brown, “Jit instrumentation: a novel approach to dynamically instrument operating systems,” in EuroSys ’07: Proceedings of the ACM SIGOPS/EuroSys European Conference on Computer Systems 2007. New York, NY, USA: ACM, 2007, pp. 3–16.
[16] G. Hunt and D. Brubacher, “Detours: Binary Interception of Win32 Functions,” Proceedings of the 3rd USENIX Windows NT Symposium, pp. 135–143, 1999. [17] M. Hiramatsu, “Overhead Evaluation about Kprobes and Djprobe (Direct Jump Probe),” 2005, uRL http://lkst.sourceforge.net/docs/probes-eval-report.pdf, retrieved 17.09.2008. [18] J. K. Hollingsworth, B. P. Miller, and J. Cargille, “Dynamic program instrumentation for scalable performance tools,” Tech. Rep. CS-TR-1994-1207, 1994. [Online]. Available: citeseer.ist.psu.edu/75570.html [19] D. J. Pearce, P. H. Kelly, T. Field, and U. Harder, “GILK: A dynamic instrumentation tool for the Linux Kernel,” in Proceedings of the 12th International Conference on Computer Performance Evalution, 2002. [20] A. Polze and D. Probert, “Teaching operating systems: the Windows case,” in SIGCSE ’06: Proceedings of the 37th SIGCSE technical symposium on Computer science education. New York, NY, USA: ACM Press, 2006, pp. 298–302. [21] M. E. Russinovich and D. A. Solomon, Microsoft Windows Internals, 4th ed. One Microsoft Way, Redmond, Washington 98052-6399: Microsoft Press, 2005.