C. G. White, W. R. Luebke, D. M. Kaplan, and H. A. Rubin are with the. Physics ... Y. C. Chen and K. C. Cheng are with the Institute of Physics, Academia. Sinica ...
568
IEEE TRANSACTIONS ON NUCLEAR SCIENCE, VOL. 49, NO. 2, APRIL 2002
Tripling the Data Set for the HyperCP Experiment Christopher G. White, T. D. Jones, W. R. Luebke, Y. C. Chen, K. C. Cheng, W. S. Choong, D. M. Kaplan, K. Nelson, H. A. Rubin, B. Turko, and P. Zyla
Abstract—FNAL E871 (HyperCP) collected over 38 terabytes of data during the 1997 fixed-target run at Fermilab. The dataacquisition (DAQ) system wrote data to tape with a typical rate of 13 MB/s. A second data collection period in 1999 allowed for the collection of a further 82 terabytes of data. However, changes in the spill structure and an increase in primary beam intensity necessitated an upgrade of the 1997 DAQ system. The 1999 run of HyperCP featured a DAQ system which recorded data on 20,421 8 mm tapes at a sustainable rate of 27 MB/s. The rationale and methods for this upgrade are detailed within. Index Terms—Acquisition, data-acquisition (DAQ), E871, HyperCP, hyperon.
I. INTRODUCTION
T
HE alpha parameter ( ) for a given decay specifies the degree to which parity is violated and is observed in the angular distribution of the daughter particles. Differences in the measured values of between a particle and its antiparticle is evidence for direct CP violation. The HyperCP experiment (FNAL E871) is searching for CP violation in the decays of cas) and lambda ( ) hyperons [1]. The goal is cade ( [2] to a precia measurement of the asymmetry parameter sion of order 10 , which is two orders of magnitude beyond the most sensitive current limit [3]. A precision measurement at this level requires over two billion fully reconstructed decays. Accounting for trigger efficiencies, this translates into more than 100 billion events digitized and recorded onto magnetic tape. In order to achieve this goal within the allotted running time, a high-rate, high-bandwidth data-acquisition (DAQ) system was built and operated by the HyperCP collaboration. The first run of HyperCP took place between March–September 1997. This run accumulated 38 terabytes of data on 8980 data tapes, corresponding to 0.8 billion reconstructed cascade decays. The DAQ system for the 1997 fixed target run (Run I) is detailed elsewhere [4]. A second fixed target run in 1999 (Run II) was approved by Fermilab; however, the running conditions were changed from 19 s Manuscript received October 25, 2001; revised December 28, 2001 and January 17, 2002. This work was supported in part by the U.S. Department of Energy and the National Science Council of the Republic of China. C. G. White, W. R. Luebke, D. M. Kaplan, and H. A. Rubin are with the Physics Division, Department of Biological, Chemical, and Physical Sciences, Illinois Institute of Technology, Chicago, IL 60616 USA. T. D. Jones, B. Turko, and P. Zyla are with the Physics Division, Lawrence Berkeley National Laboratory, Berkeley, CA 94720 USA. W. S. Choong is with the Department of Physics, University of California, Berkeley, CA 94720 USA. Y. C. Chen and K. C. Cheng are with the Institute of Physics, Academia Sinica, Nankang, Taipei, Taiwan. K. Nelson is with the Department of Physics, University of Virginia, Charlottesville, VA 22901 USA. Publisher Item Identifier S 0018-9499(02)03897-2.
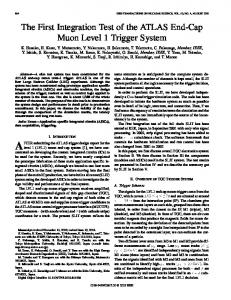
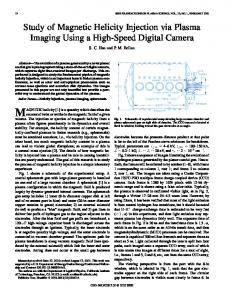
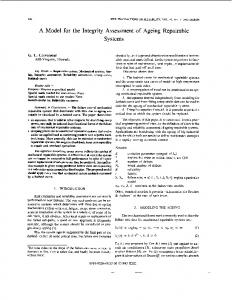
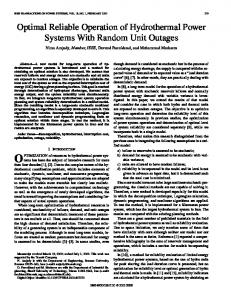
of spill every 61 s to 40 s of spill every 81 s. This change necessitated an upgrade of the DAQ system. By incorporating a handful of custom modules into an existing 21 000 channel readout system we were able to double the data rate at minimal cost. This paper rationalizes the upgrade, provides an overview of the upgrade and gives a road map from the original DAQ to the final DAQ. The technical details of individual electronic modules (including schematics and logic diagrams) as well as other specific operating principles are listed elsewhere [5]. The HyperCP spectrometer is shown schematically in Fig. 1. An intense unpolarized beam of charged hyperons was produced at 0 degrees by 800 GeV protons striking a metal target, with the secondaries momentum-selected by means of a curved magnetic channel (the collimator) set to 160 GeV/c with a 25% FWHM momentum bite. Following a 13-m evacuated decay pipe, the hyperon decay products were detected in a high-rate magnetic spectrometer using multiwire proportional chambers (MWPCs). To switch between hyperon and antihyperon running, the polarities of the hyperon channel and analyzing magnets were reversed, selecting either positive or negative secondary beam. To maintain equal rates in the detectors, different target lengths were used for the two modes. This approach also resulted in nearly identical trigger rates between positive and negative running. A simple trigger was employed to minimize potential systematic effects that might mimic a CP asymmetry. Our primary physics trigger (“cascade trigger”) required a coincidence of at least one particle on the right of the spectrometer with at least one on the left. This was done using the “same-sign” (pion) and “opposite-sign” (proton) hodoscopes, which were located sufficiently far downstream of the analyzing magnets that the proton and pions from the hyperon decay were all separated from the secondary beam. To suppress muon and low-energy backgrounds, the cascade trigger also required a minimum energy deposit in the hadron calorimeter. Nevertheless, the trigger rate was dominated by background due to interactions of secondary beam particles with the spectrometer material. The muon detection system consisted of proportional-tube planes interspersed with iron absorber. Muon triggers were formed with signals from four planes of scintillation hodoscopes located between and behind the absorbers. These data provided sensitivity to rare decays with muons in the final state. II. RUN I DAQ LIMITATIONS During Run I, data were collected for 19 s out of every 61 s, resulting in a duty factor of 0.31. The maximum instantaneous data rate that the DAQ could handle was given by the rate at which data was written to tape (data-to-tape rate) divided by the duty factor.
0018-9499/02$17.00 © 2002 IEEE
WHITE et al.: TRIPLING THE DATA SET FOR THE HYPERCP EXPERIMENT
569
Fig. 1. The HyperCP spectrometer as implemented during Run II. The plan view includes an overlay of a 4 decay. Note the difference between the horizontal and vertical scales.
The Run I data-to-tape rate was typically no more than 13 MB/s, limiting the instantaneous rate of data collection to 42 MB/s. The data collected during the spill were stored in a buffer (called the event-buffer or spill-buffer) and written to tape on a continuous basis (independent of the spill cycle). Given these rates, the minimum required spill-buffer was 500 MB in size (the actual size of the spill-buffer was 960 MB). The average event size was 600 bytes. The maximum allowed inhibited trigger rate was thus 70 kHz. Sustained average data rates greater than 13 MB/s resulted in the accumulation of data in the spill-buffer across spill cycles. To prevent corruption of the data, triggers were inhibited whenever the spill-buffer reached 98% of capacity, causing a reduction in the front-end live fraction and effectively limiting the average rate of data collection to 13 MB/s. While digitizing spectrometer data, the front-end latch system inhibited future triggers and was thus dead to new events. The
Run I readout time (deadtime) was proportional to the number of hits recorded per event, which was proportional to the primary beam intensity and spill quality. The distribution of event by event readout times was asymmetric, typically ranging from 1.5 s to 10 s or more. The average readout time per event was 3.5 s. The live fraction (defined as the ratio of events written to tape to the total number of triggers formed) for Run I was typical about 70%. The requested primary beam intensity during Run I was typically 7.5 10 protons on target per second of beam extraction (the average beam intensity delivered was about 6 10 protons per second). This rate resulted in an instantaneous data rate near 42 MB/s, equal to the maximum capability of the DAQ. The DAQ wrote tape continuously and the event buffers were rarely empty. An increase in the number of events written to tape required either an increase in throughput or a decrease in
570
IEEE TRANSACTIONS ON NUCLEAR SCIENCE, VOL. 49, NO. 2, APRIL 2002
the average event size. It should be noted that a decrease in the deadtime alone would not have significantly increased the number of events written to tape since the throughput bandwidth was already fully occupied. We ran during Run I with all available bandwidth and would have used more had it been available.
TABLE I PROJECTED MINIMUM DATA-TO-TAPE RATE AND SPILL-BUFFER SIZE FOR THE GIVEN TRIGGER RATE AND EVENT SIZE, ASSUMING A DUTY FACTOR OF 0.5. THE LISTED TRIGGER RATE REFERS TO LIVE TRIGGERS. THE EVENT SIZE WAS AN ESTIMATE BASED ON RUN I DATA AND INCREASED DUE TO THE HIGHER MWPC MULTIPLICITY ASSOCIATED WITH INCREASED SECONDARY BEAM RATES ( INDICATES DATA COMPRESSION)
III. UPGRADE DESIGN GOALS The purpose of the HyperCP spectrometer and DAQ system was to digitize and record as many charged cascade and anticascade decays as possible. The number of produced hyperons increased with the primary beam intensity; however, the event size, trigger rate and deadtime also increased. Furthermore, the yield of useful, reconstructable cascade decays per cascade trigger was found to drop with increasing primary beam intensity. In general, optimum running conditions (determined from offline analysis of data collected under various running conditions) called for a primary beam intensity near 9 10 protons on target per second, which was a rate beyond the capabilities of the original HyperCP DAQ system. Furthermore, following the 1997 fixed target run, the Beams Division at Fermilab announced that the duty factor for the 1999 fixed target run would change from 19 s of spill every 61 s to 40 s of spill every 80 s. A duty factor of 0.5 implied a reduction in the maximum instantaneous data rate to no more than 26 MB/s (corresponding to a primary beam intensity of about 5 10 protons on target per second of extracted beam), assuming no changes to the HyperCP spectrometer and DAQ system. An upgrade of the DAQ system was necessary to maximize the number of useful physics events written to tape during the 1999 fixed target run. Our first goal was to double the data-to-tape rate to accommodate a doubling of the primary beam intensity (over what would have been possible without any upgrades). Assuming our first goal was meet, we also resolved to decreased deadtime as much as possible, leading to a corresponding increase in the number of triggers written to tape. Additional goals included a decrease in the average event size and an increase in the spill-buffer size. The minimum required data-to-tape rates and spill-buffer sizes are shown in Table I as a function of the total trigger rate and average event size. Notice that a spill-buffer upgrade was necessary only for high trigger rates and the minimum required data-to-tape rate decreased with decreasing event size. IV. SPECTROMETER CHANGES The spectrometer remained relatively unchanged between the 1997 and 1999 runs. Chamber C9 (a chamber originally intended to be used as a spare) was installed and partially instrumented for the 1999 run, resulting in 988 additional MWPC channels. The proton hodoscope was modified and a new beamhodoscope was added downstream of the muon station. In addition, a 32-bit time-stamp and a 16-bit flag module were added to the readout stream. In total, the 1999 run encoded data from 19 684 MWPC channels, 832 muon station channels, ten 14-bit ADCs (stored as 16-bit data words) and 288 bits of fixed-format data. The muon and MWPC hits were encoded as 16-bit data words.
Among various other minor improvements was the change to a fast gas mixture (CF4-isobutane) in all but one MWPC. In 1997, only the four upstream chambers used the fast gas. This change enabled us to tighten the latch-gate timing thus reducing the number of out-of-time hits. The most significant change to the spectrometer, however, was the movement of the target with respect to the collimator entrance. Detailed studies of the Run I data indicated that the target was not correctly positioned along the central orbit of the collimator. The target was therefore moved both horizontally and vertically with respect to the collimator entrance. As such, correlations between the primary beam intensity, event size and trigger rates changed between Runs I and II. V. FRONT-END UPGRADE A. Reorganization and Additional Channels Two distinct latch systems were employed during the 1997 run. The FEM system [4] was used to latch and digitize the muon station data, while the Nevis latch system1 was used for everything else. Data from these systems were sent along five parallel data paths linking the front-end with the spill-buffer (situated with the VME event-building and tape-writing system). The FEM and Nevis systems were incompatible resulting in unbalanced data paths. The collaboration decided to standardize the front-end latch system by expanding the Nevis system to include the muon station. Furthermore, as discussed above, an additional 988 MWPC channels were instrumented and needed to be read out. Consequently, four additional Nevis system latch crates were installed and instrumented for the 1999 run. There was insufficient time and money to produce new crates, so old and less reliable units were used to instrument the additional channels. Finally, the entire Nevis system was reorganized to increase path balance, thereby increasing overall readout efficiency. A detailed description of the Nevis system as employed 1Original design by F. W. Sippach, Columbia University Nevis Laboratories, Irvington, NY 10533, circa 1970. Updated for fast readout by F. W. Sippach and H. Cunitz, Columbia University Nevis Laboratories, in 1981. The Latch Crad Design was updated from ECL I to ECL 10 000 by J. A. Crittenden and D. N. Kaplan in 1984.
WHITE et al.: TRIPLING THE DATA SET FOR THE HYPERCP EXPERIMENT
571
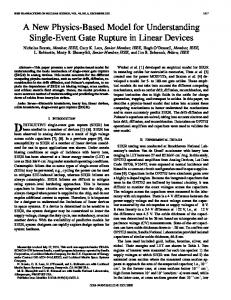
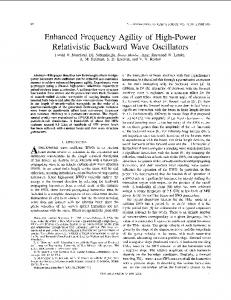
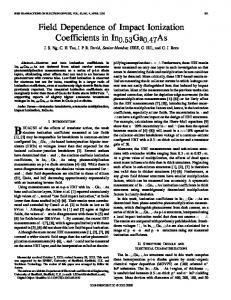
Fig. 2. An overview of the readout configuration used during Run II.
during Run II can be found elsewhere [5]. An overview of the readout configuration is shown in Fig. 2.
B. Deadtime Reduction The emphasis of the front-end hardware upgrade was to reduce deadtime and event size and to re-package the raw data for more efficient event building. The chief method for deadtime reduction was the implementation of new encoders with internal buffering. The old encoders required one readout-clock cycle per latched hit. The new buffered-encoder (BE) read an entire latch card per clock cycle, storing the 32-bit hit pattern in 256-deep, 7-ns CMOS FIFOs. Readout clock cycles were saved whenever a card had more than one hit. The number of clock cycles required to read out the latch system was reduced on average by a factor of 2.7. During Run I, front-end buffering occurred after the encoding of latch hits. Furthermore, encoding and buffering had previously been done via two separate modules. The BE replaced these with a single unit, thereby simplifying the system. Triggers were inhibited during readout by a “Trigger-Hold” signal. Due to variations in signal-cable lengths, detector positions within the spectrometer and differing setup requirements
(in particular, the conversion time required by the ADCs), the various readout crates functioned asynchronously (i.e., readout of data into the BEs did not occur simultaneously throughout the system). During the 1997 run, the Trigger-Hold signal was generated through a logic OR of the encoder Busy lines. Due to the asynchronous nature of the readout, a 300 ns delay was added to the trailing edge of Trigger-Hold to prevent holes. Furthermore, during Run I, data from different events mixed whenever an encoder missed or received an extra Start pulse (due to a glitch). The Trigger Release Module (TRM), a new design for Run II, streamlined Trigger-Hold, reduced overhead associated with releasing the trigger inhibit, provided error trapping to prevent mixing of data between events and increased diagnostic capabilities with regards to the latch readout. The TRM saved about 400 ns in deadtime per event and successfully prevented data mixing between unrelated events. We had hoped to reduce deadtime further through a reduction in the latch-clock period; however, we had to increase the clock period from 75 ns to 85 ns instead. Although newly manufactured crates can function reliably with a 50-ns clock period, the HyperCP latch system relied upon an assortment of crates manufactured at different times for various experiments. Therefore, a clock period of 85 ns was chosen based on the reliable performance of the slowest crate.
572
The BEs and TRM met all expectations for reliability and performance. During the 1997 run, the average deadtime per event was about 3.5 s with significant variation from event to event. Despite the increased channel count and the increase in the readout clock period, the observed deadtime per event during the 1999 run was roughly constant at about 1.7 s (the ADC readout time was fixed at 1.7 s per event), resulting in a factor of 1.33 more events to tape than would otherwise have been possible (assuming no changes to the Run I front-end). Further significant reduction in the observed deadtime required either a reduction in the clock period (a 50-ns clock period would have reduced the deadtime by 280 ns) or faster ADC chips.
C. Increasing Data Capacity Encoding hits saved data space since the average hit density throughout the latching system was less than 1 hit per 100 channels. Active (i.e., nonzero) bits were encoded into 16-bit words with five bits used for the channel number, five bits for the slot number, and four bits for the crate number. Two bits per word went unused during Run I; however, these bits were used during Run II to differentiate standard 16-bit latch words from compressed eight-bit offsets (see below). The compressor module (CM) was designed to reduce the event size by compressing consecutive encoded hits with an arithmetic difference less than 192 into 8-bit offsets with respect to the previous data word or offset (offsets between 192 and 255 were disallowed in order to differentiate compressed data words from standard data words). There was no limit, other than crate boundaries, to the number of consecutive compressed hits. Compression reduced the encoded data size by 40%. The overall event compression was 30% including header words, ADC data and other nonsparse data (which were not compressible). Compression (i.e., smaller average event size) was pursued in anticipation of higher trigger rates and as a hedge with regard to the final data-to-tape rate; however, for the trigger and data-to-tape rates observed during the run, compression of the raw data would not have appreciably increased the total number of events collected. Consequently, to avoid unnecessary complexity, the compression feature of the CM was not used during the bulk of HyperCP data collection. A version of this compression algorithm was implemented in the off-line analysis code repacking raw data for storage on data summary tapes. A second feature of the compressor module was event aggregation. The compressor aggregated events into “super-events.” The number of events per super-event (aggregation count) was set to ten, although a switch on the compressor permitted any number between 1 and 127. Event aggregation allowed for more efficient use of VME-back-plane bandwidth during event building (large data transfers are more efficient than small ones). The compressor boards were capable of operating in four modes: no compression and no aggregation, compression without aggregation, aggregation without compression, or compression with aggregation. Event aggregation played a significant role in the increase in the data-to-tape rate observed between the 1997 and 1999 runs.
IEEE TRANSACTIONS ON NUCLEAR SCIENCE, VOL. 49, NO. 2, APRIL 2002
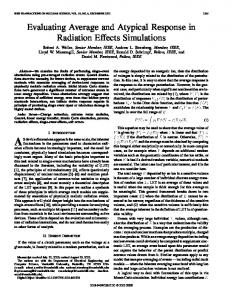
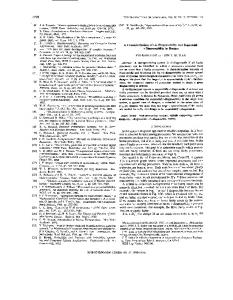
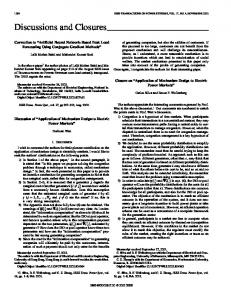
D. Data Format As previously mentioned, data were split between five parallel paths, thus a complete event consisted of five separate event fragments. Event fragments consisted of a variable number of 32-bit data words, the first of which was always a 32-bit path header (identified as a header by the first four bits). The header contains a four-bit flag indicating the data type (Run I versus Run II, compression or no compression, FEM or Nevis), the four-bit Event Synchronization Number (ESN) for the fragment, the data path number and a 16-bit byte count for the entire fragment. Following the header would be the fixed-format data (see Section IV) (within one path only for Run I and within two paths for Run II). The complete list of encoded hits followed the fixed-format data (see Fig. 3). Aggregation was also conducted path-by-path resulting in super-event fragments. An example of a super-event fragment is shown in Fig. 3. E. Event-Buffer Upgrade In order to allow for a larger spill-buffer, a set of five auxiliary VDAS Crates [6] were recommissioned from other experiments and installed in the DAQ area. Each of the new crates was paired with one of the existing crates to produce an increase in memory capacity. The VDAS input–output (I/O) module in the existing crate required modification. A daughter board was produced that plugged into existing IC sockets. With the daughter board installed, the revised I/O board linked the two crates effectively into a single unit. The presence of data within the upstream crate above a minimum threshold triggered the downstream VDAS to siphon data. This allowed for a seamless upgrade. Additional memory modules were required to fill the new crates. Older VDAS memory modules were found and upgraded to 16 MB per board by replacing the old 256 KB SIMMs with 1 MB SIMMs. As with the compression feature discussed above, the additional memory was not required during Run II and thus the event-buffer upgrade was never fully implemented. VI. VME HARDWARE UPGRADE Event building and tape writing were conducted within a VME based system [4], [5] using MVME 167 processors. Data were read from the VDAS by the Event Buffer Interface (EBI) and then passed across the VME backplane to the processors. During Run I, assembled events were written to tape using Ciprico RF 3573 SCSI interface modules.2 The VME processors and Cipricos communicated via the VME backplane; consequently, event building and tape writing competed for use of the backplane. Backplane contention was eliminated during Run II by writing to tape directly from the MVME167 processors, thus freeing the VME backplane to be used exclusively for event building. Increased data-to-tape rate was also achieved by upgrading the EBIs. A. Fast EBI The EBI was a custom VME design providing VME access to the data stored within the VDAS. Each VDAS crate was bused to one EBI in each of the event-building VME crates. The bus 2Ciprico,
Incorporated, Chanhassen, MN 55317 USA.
WHITE et al.: TRIPLING THE DATA SET FOR THE HYPERCP EXPERIMENT
573
Fig. 3. Examples of the Run I and Run II data formats expressed in 32-bit data words. Note that compression was not universal throughout Run II.
protocol was RS-485. Bus access was restricted to one EBI at a time through the use of an electronic token passed from one EBI to the next using front-panel lemo connectors. The EBI sent a strobe pulse to the VDAS requesting data if in control of the bus and addressed by a CPU for a data transfer. Data on the bus were latched after a fixed delay time. The EBI converted the data to VME protocol and output the data along the VME backplane to be stored by the CPU within the event-building buffer. This cycle continued until the data request was satisfied. The DMA setup time was approximately 10 s; consequently, small data transfers were inefficient. Event aggregation improved overall efficiency by increasing the effective size of the average event fragment (by a factor equal to the aggregation count). Aggregation also decreased the relative variation between super-event fragments, contributing to increased efficiency during multi-crate operations. The fast EBIs increased event-building speed by reducing the time between the VDAS
strobe pulse and the latching of the input cable. The upgraded EBI (fast EBI) had a delay length of 192 ns, which was 120 ns less than the delay implemented during Run I. The distance between the VME and VDAS crates was reduced along with the cable length in order to accommodate this increase in speed. B. Direct Tape Writing Direct SCSI tape writing from an MVME167 processor required the installation of MVME712 communication modules mounted along the VME backplane (one for each CPU). The SCSI port on the MVME712 was used to connect each CPU to three Exabyte 8705 tape drives.3 The pre-existing Exabyte 8505 tape drives (a bank of 40 drives was used during Run I) were obsolescent, worn, and too slow for our needs. We replaced them with new 8705 tape drives rated at 1 MB/s each. A bank 3Exabyte
Corporation, Boulder, CO 80301 USA.
574
Fig. 4.
IEEE TRANSACTIONS ON NUCLEAR SCIENCE, VOL. 49, NO. 2, APRIL 2002
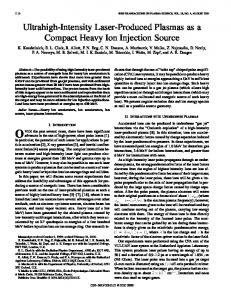
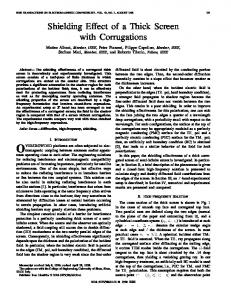
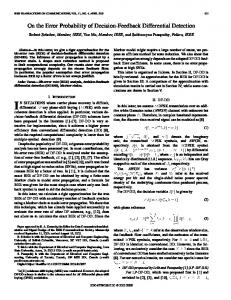
VME hardware configuration during Run II.
of 27 drives was used during the 1999 run, for a maximum tape rate of 27 MB/s. The Run II VME hardware configuration is shown in Fig. 4. VII. VME SOFTWARE UPGRADE A. VxWorks Direct SCSI tape writing necessitated upgrading the MVME167 operating system to VxWorks version 5.3.1.4 This version of VxWorks was not supported for SGI host computers. Unfortunately, the HyperCP DAQ software was based on the Fermilab DART [7] standard, only supported for an SGI host. The VxWorks 5.3.1 kernel was built on a SUN workstation and copied to a directory on the SGI host computer. Fortunately, VxWorks version 5.3.1 was backward compatible so the DART and HyperCP DAQ software did not require porting to the SUN. B. Software Architecture Direct comparisons between the Run I and Run II software are difficult since the event building, tape writing and error handling routines were all completely rewritten for Run II. The general architecture, however, remained the same. The Data Handler routines accessed the raw data through the EBI. Event fragments from each data path were assembled into complete events within a buffer and then written to tape. The overall process was managed by the DART Run Control (DRC) program running on the host SGI Indigo computer. C. Event Building and Tape Writing The event-building software structure was designed around modular VME crates, allowing the system to work with from 4Wind
River Systems, Alameda, CA 94501 USA.
one to five crates. Fig. 5 shows the processes running on the VME CPUs. The Data Handler and Tape Spinner processes were run on each CPU, with one Tape Spinner process for each tape drive. The Data Handlers and Tape Spinners were loaded and started during the CPU boot sequence, along with various DART objects used to facilitate communication with the run control process running on the host SGI computer. The Listener processes, one per Data Handler, were spawned during execution of the DRC Start command. The Listener processes managed event building within the crate and facilitated communication with the DRC program. Communication between the Listener and Data Handler was conducted through a direct socket connection, while the Listener communicated with DRC via a socket connection managed by DART processes running on CPU 1. The Data Handler and Tape Spinners communicated through global variables. The Sampler process provided packets of raw data to the DART Hoist program for use by online monitoring programs. Each Data Handler assembled events using three circular buffers. Each circular buffer consisted of twenty-five 64-KB blocks. The block size was stipulated by offline software, while the number of blocks per ring was set by the available memory on the CPU module. A block was tagged as full if, at the end of a complete super-event, it contained more than 52 KB. Should an unusually large super-event attempt to exceed the 64-KB block size, the block was discarded, along with the current super-event. Events were never written across block boundaries. Blocks were filled sequentially; however, the Data Handler would switch among circular buffers depending upon which buffer had the greatest number of free blocks. Each circular buffer had an associated Tape Spinner process which ran in parallel with the Data Handler. Each Tape Spinner
WHITE et al.: TRIPLING THE DATA SET FOR THE HYPERCP EXPERIMENT
worked sequentially around its circular buffer, writing data to a single tape drive. If the current block was full, the Tape Spinner wrote that block to tape and marked the block as empty. It then proceeded to the next block. If the current block was not full, the Tape Writer waited until the block was full. If a tape drive or Tape Spinner failed, the associated buffer simply filled and was thereafter ignored. Tape Spinners maintained a counter of the number of bytes written to tape, setting a global variable should the counter exceed 4.3 GB (i.e., near the capacity of the 8-mm tape media used). During event processing, the Data Handler checked the value of this variable, reporting to the Listener when a tape was full. The Listener in turn reported to DRC, which initiated a DRC Stop command. Much of the software was automated. The Tape Spinner and Sampler processes were restarted (if necessary) as a part of the DRC Init command. Most data errors trapped by the online monitoring programs were cleared by executing the DRC Pause command followed by the DRC Resume command. CAMAC function calls tied to DRC commands were used to hold triggers, reset critical hardware and release triggers. Buffers were automatically cleared at every DRC Initialize or Resume. The software was designed to require a CPU reboot only if a Data Handler or the DRC crashed. Additional details of the upgraded software system can be found elsewhere [5].
575
Fig. 5. Configuration of the processes running on each VME CPU during Run II.
VIII. OVERALL UPGRADE PERFORMANCE The requested primary beam intensity during Run II was typically 9 10 protons/s (the average beam intensity delivered was about 8 10 protons per second). The most probable rate of cascade triggers was 50 kHz during positive mode and 60 kHz during negative mode. The most probable total trigger rate, including all calibration and secondary physics triggers, was 90 kHz during positive running and 95 kHz for negative running. The typical event size was smaller than in 1997 (500 bytes versus 600 bytes) due primarily to improved gate timing. The typical instantaneous data rate generated by the HyperCP spectrometer was 36 MB/s (maximum sustainable instantaneous data rate was 54 MB/s). The observed deadtime was 1.7 s per event which translated into an 80% live fraction. The sustainable data-to-tape rate was 27 MB/s, limited by the number of tape drives employed. Between August 1999 and January 2000, HyperCP wrote 82 terabytes of data to 20 421 8-mm tapes. This represents twice as much data as could have been collected without the front-end and DAQ upgrades (see Fig. 6) and effectively tripled the total HyperCP data set. We estimate that these data contain 2.5 10 fully reconstructable cascade-hyperon decays, twenty million of omega-hyperon decays and several hundred million charged -meson to three charged -meson decays. The limiting factor in collecting these data was deadtime as additional data-to-tape headroom remained at the chosen operating conditions. Without deadtime, the number of events written to tape would have increased by 25%. No further increase was possible as increased beam intensity would have reduced the yield of useful events. Although a zero deadtime system was
Fig. 6. This plot shows the average event-to-tape rate for negative polarity data for both Run I and Run II (one entry per spill). The width of each distribution is due to variability in the primary beam intensity, spill by spill.
desirable, such a system would have required redesigning the entire 21 000 channel latching system. In conclusion, we were able to upgrade a high rate data-acquisition system at minimal cost by incorporating a handful of custom modules into an existing 21 000 channel system. A novel application of front-end buffering (requiring a production run of only 45 Buffered-Encoder modules) decreased the deadtime sufficiently to allow 33% more triggers to be written to tape. Implementation of event aggregation was achieved through the installation of five Compressor modules. The subsequent increase in effective event size (about eight times as large as in the 1997 run) increased by 40% the average rate at which data were transferred from the Spill Buffer to the VME processors. Installation of 15 fast EBIs increased the data transfer rate by an additional factor of 1.6. Writing tape directly from the CPU doubled the backplane bandwidth available for event-building. The event-building and tape-writing code were simplified to facilitate data flow. The net data-to-tape rate increased by a factor of two even though the VME system was reduced from five crates to three. The implementation of additional tape drives would have increased the bandwidth even further. In brief, to achieve high rates, one should streamline and accelerate data flow, simplify code and use parallel structures wherever possible.
576
IEEE TRANSACTIONS ON NUCLEAR SCIENCE, VOL. 49, NO. 2, APRIL 2002
ACKNOWLEDGMENT The authors would like to thank A. Baumbaugh, T. Carter, S. Hansen, C. James, K. Knickerbocker, J. Meadows, D. Northacker, and M. Vittone for their help and useful advice. They would also like to thank A. Chakravorty, C. Durandet, D. Rajaram, and S. White for their assistance. REFERENCES [1] A. Chan, Y. C. Chen, J. Sheng, P. K. Teng, C. Yu, Z. Yu, W. S. Choong, G. Gidal, K. B. Luk, P. Zyla, M. Crisler, C. James, J. Volk, J. Felix, G. Lopez, R. A. Burnstein, A. Chakravorty, D. M. Kaplan, L. M. Lederman, W. Luebke, D. Rajaram, H. A. Rubin, C. G. White, S. L. White, N. Leros, J. P. Perroud, H. R. Gustafson, M. J. Longo, F. Lopez, V. Papavassiliou, M. Jenkins, K. Clark, M. Carmack, E. C. Dukes, C. Durandet, T. Holmstrom, M. Huang, Z. Kou, and K. S. Nelson, “Proposal to Continue the Study of Hyperon CP Violation in FY99,” FERMILAB, FERMILAB-P-0871, 1997. [2] C. G. White, R. A. Burnstein, M. Carmack, A. Chakravorty, A. Chan, Y. C. Chen, W. S. Choong, K. Clark, M. Crisler, J. Drapala, E. C. Dukes, C. Durandet, J. Felix, G. Gidal, H. R. Gustafson, C. Ho, T. Holmstrom, M. Huang, C. James, M. Jenkins, D. M. Kaplan, Z. Kou, L. M. Lederman, N. Leros, M. J. Longo, F. Lopez, G. Lopez, W. Luebke, K. B. Luk, K. Nelson, V. Papavassiliou, J. P. Perroud, D. Rajaram, H. A. Rubin, N. Saleh, J. Sheng, M. Sosa, P. K. Teng, B. Turko, J. Volk, S. L. White, C. Yu, Z. Yu, and P. Zyla, “Search for direct CP violation in 3 and 4 hyperon decays,” in Nucl. Phys. Proc. Suppl, vol. 71, 1999, pp. 451–456.
[3] K. B. Luk, H. T. Diehl, J. Duryea, G. Guglielmo, K. Heller, P. M. Ho, C. James, K. Johns, M. J. Longo, R. Rameika, S. Teige, G. B. Thomson, and Y. Zou, “Search for direct CP violation in nonleptonic decays of charged 4 and 3 hyperons,” Phys. Rev. Lett., vol. 85, pp. 4860–4863, 2000. [4] Y. C. Chen, K. C. Cheng, W. S. Choong, E. C. Dukes, P. Gu, C. Ho, C. James, D. M. Kaplan, W. R. Luebke, K. B. Luk, K. Nelson, H. A. Rubin, J. P. Sheng, C. G. White, and C. S. Yu, “A high-throughput data acquisition system for the HyperCP experiment,” Nucl. Instr. Meth., vol. A455, pp. 424–432, 2000. [5] C. G. White, T. D. Jones, W. R. Luebke, Y. C. Chen, K. C. Cheng, W. S. Choong, D. M. Kaplan, K. Nelson, H. A. Rubin, B. Turko, and P. Zyla, “Upgraded DAQ system for the HyperCP experiment,” Nucl. Instrum. Meth., vol. A474, pp. 67–85, 2001. [6] A. E. Baumbaugh, K. L. Knickerbocker, C. R. Wegner, B. W. Baumbaugh, and R. Ruchti, “A real time data compactor (sparsifier) and 8 megabyte high speed FIFO for HEP,” IEEE Trans. Nucl. Sci., vol. 33, pp. 903–906, 1986. [7] R. Pordes, J. Anderson, D. Berg, D. Black, R. Forster, J. Franzen, S. Kent, R. Kwarciany, J. Meadows, C. Moore, G. Oleynik, V. O’Dell, D. Slimmer, J. Streets, O. Trevizo, L. Udumula, M. Vittone, M. Votava, N. Wilcer, V. White, J. Engelfried, T. Yamanaka, C. Guss, E. Stern, J. Kim, G. Zioulas, A. Majewska, and A. Kreymer, “Fermilab’s DART DA system,” in Computing in High Energy Physics (CHEP 94), San Francisco, CA, April 21–27, 1994, FERMILAB-CONF-94-103.