factor affecting the reliability of electronic equipment. Today, because of ... when asked about Sony's perspective on reliability prediction methods during a US ...
IEEE TRANSACTIONS ON RELIABILITY. VOL. 45, NO. 1. 1996 MARCH
Tutorial: Temperature As an Input to Microelectronics-Reliability Models Pradeep Lall, Member IEEE Motorola Inc, Plantation
For example, some microelectronic devices become less reliable as temperature is lowered, or the eooling system might be less reliable than the electronic components.
Key Words - Activation energy, Failure rate, Mean time to failure, Reliability modeling, Temperature Summary & Conclusions - This tutorial discusses various modeling methodologies for temperature acceleration of microelectronic-devicefailures; there are situationsin which some methodologiesgive misleadingresults. The aim is to raise the level of understanding of the impact of temperature on reliability and to define the objectives of physics-based temperature modeling. There are alternatives to both the Arrhenius relation and the MilHdbk-217 approach to reliability. In Japan, Taiwan, Singapore, and Malaysia, a physics-of-failureapproach is used by most companies. Philips in the Netherlandsand the CADMP Alliance in the USA have developed methods & softwareto conduct physics-based reliability assessments.
Acronyms3 ESD EOS IC MTTF RH VLSI Notation
t
E
x TT
r
1. INTRODUCTION
(“We have a headache with Arrhenius”2)
electrostatic discharge electrical overstress integrated circuit mean time to failure relative humidity very large-scale integration (circuits).
dev
ref chr
time. activation energy failure rate temperature acceleration factor reaction rate implies: device implies: reference implies: the chemical reaction steady-state absolute temperature Boltzmann’s constant (8.617. eV/K).
This is the 15thin a tutorial series on failure mechanisms T and their role in physics-based damage models to use in k design-for-reliability. In the 1940s, temperature was a main factor in the reliabili- Other, standard notation is given in “Information for Readers ty of electronic equipment - largely because of the vacuum & Authors” at the rear of each issue. tube. In the 1960s, many (but not all) reliability engineers and system designers still considered temperature to be the major factor affecting the reliability of electronic equipment. Today, 2 . RELIABILITY & PERFORMANCE because of extensive improvements & changes in technology, device design-rules, materials, and manufacturing-processes, Reliability (the ability of a device to fulfill its intended functhe influence of temperature on microelectronic-devicereliability tion under a specified set of application conditions) is often exis again being scrutinized. A designer, in an effort to improve reliability, must not lower the temperature without fully pressed in terms of the calendar time of useful life. Failure renders the device non-operational due to damage caused by understanding: a failure mechanism, actuated generally by external and/or inthe impact (on cooling-system & component reliability) in ternal stresses4 [I]. money, weight, and size, A device can fail when its local environment (including the extent of actual component & system reliability its operating conditions) lies outside the device specification improvement. limits. Performance malfunctions in microelectronic devices include threshold voltage drift, a large leakage current, or large propagation delay or noise margins, although usual operation ‘This tutorial was adapted from the 1996 book, Influence of is often resumed once the local environmental conditions return Temperature on Microelectronics and System Reliability, A Physics within specifications.
of Failure Approach, by P. Lall, M. Pecht, E. Hakim, with permis-
sion from the publisher, CRC Press (Boca Raton, FL). 2Takehisa Okada, Senior General Manager of Sony Corporation, when asked about Sony’s perspective on reliability prediction methods during a US - Japanese Technology Evaluation Center visit [Kelly, et al, 19931.
’The singular & plural of an acronym are always spelled the same. 4The term, stress, is used in a general sense, eg, temperature, mechanical stress, voltage, or salt spray.
0018-9629/96/$5.00 01996 IEEE
4
IEEE TRANSACTIONS ON RELIABILITY, VOL. 45, NO. 1, 1996 MARCH
Local environmental excesses generally indicate the need for a system design change and/or the unsuitability of the device technology for that application. Increased temperature can cause system performance problems, which can appear to be device-related reliability problems. These problems often arise when the designers do not account for worst-case performance limits.
-55
-Jo
6
29
70
45
53
120
Free Air Temperature ( "C)
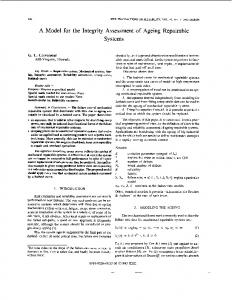
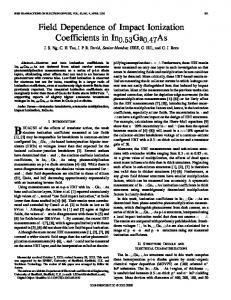
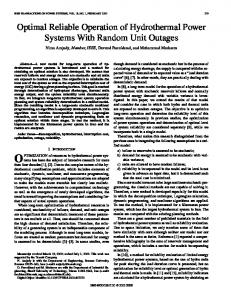
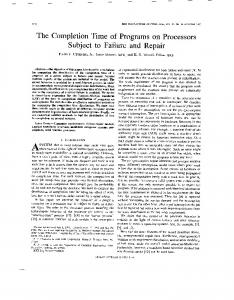
Figure 1. Valley High-Level Output Voltage vs Free-Air Temperature [74AC11373 compared to end-pin product - from TI Databook] 15
T
-9
a 0 U M 73 100
-1s
Free Air Temperulurc (
,-* I25
1s
0'
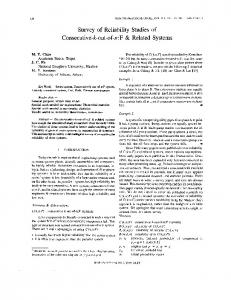
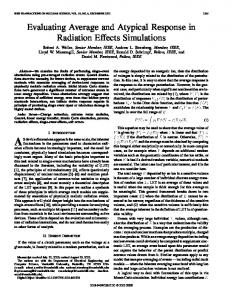
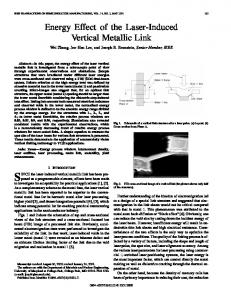
Figure 2. Peak Low-Level Output Voltage vs Free-Air Temperature [from TI Databook]
Consider figures 1 & 2. Figure 1 shows how the minimum output voltage for an output high (1) changes with respect to temperature. The lower the temperature, the smaller the margin for safe operation. At temperatures below specification, the device-noise margins can be small enough that system does not work, even though the device works. Figure 2 shows the results are similar for the maximum output voltage for an output low ( 0 ) . Other electrical device technologies can work the other way, with noise margins becoming worse at high temperature. Product engineers must understand the effect of temperature on system performance requirements (as specified in
the device catalog). The remainder of this tutorial focuses on the influence of temperature on reliability.
3. ACTIVATION-ENERGY BASED MODELS
Assumption 1. The failure rate of a device is independent of time. (This is the usual, but often very inappropriate, assumption 4 in conventional reliability-prediction methods. ) 5 Steady-state temperature, temperature cycles, temperature gradients, and time-dependent temperature changes all can affect the reliability of electronic devices & equipment. However, because of the often-required use of reliability p r d c tion methods such as Mil-Hdbk-217 [2] and Progeny [3 51, steady-state temperature has often been considered the only stress parameter affecting reliability. These methods use the work of Savante Arrhenius, a Nobel prize winner in chemistry in 1889. In his experimental study on inversion of sucrose, the steady-statetemperature dependence of a single chemical-rate reaction was fit to the equation:
Eq (I), now called the Arrhenius equation, has been used to assess the temperature dependence of a wide variety of reaction rates and diffusion coefficients [6 - 1016. The Arrhenius-based models have also been reformulated to predict the influence of steady-state temperature on electronic-device failure rate (or its inverse, MTTF):
An Arrhenius plot of failure-time vs reciprocal-absolutetemperature, using appropriate statistical methods, can be used to estimate the activation energy and its uncertainty; the measure of uncertainty generally presumes that the model is correct. Activation energies of the individual failure mechanisms in the device can be combined into a weighted activation energy for the device [16, 171. The use of an activation energy to model a device failure rate is common, but often misleading [18 - 201. The weighted
5A consequence of constant h is that: M T T F = 1/h. When l/h > 50 years, it is misleading to use MTTF because it is inappropriate (at best) to presume that the model of constant h for a device will still be true 50 years from now. In figures 3, 7, 8, the vertical axis was originally labeled MTBF (wrong for non-repairable devices). It was changed to l / h to be clear & correct, and to conform to this footnote. %heoretical work in kinetic theory, thermodynamics, and statistical mechanics has developed forms that contain exponentials similar to the Arrhenius form [ll - 131. At their core is the assumption that a steady-state exists between the reactants and the products of a reaction, which are separated by a finite energy difference [14].
5
MI.&:TEMPERATURE AS AN INPUT TO M T C R O E L E C T R O N I ~ - R E L ~ A BMODELS ~~~T~
activation energy is highly sensitive to the relative dominance of the failure mechanism (viz, the assigned weight). There can be no general set of weighting factors, especially considering the wide variabilities in the dominant failure mechanism. Table 1 demonstrates the extreme variability of the dominant device failure mechanisms for manufacturers of VLSI devices. Considering that activation energies for failure mechanisms can range from 0.06 eV (for hot electrons) to 2 eV (for intermetallic growth), this approach is highly sensitive to the failure mechanisms induced during manufacture, and thus to the weighting factors. Many people now recommend against this method. Table 1 shows that no single activation energy can be assigned to the device because the failure mechanism depends on manufacturing processes. Few failure mechanisms remain dominant, or even important, for very long [8] - because corrective action is taken to eliminate them and the size of the device shrinks, thus changing the failure mechanisms (even resurrecting old ones). TABLE 1 Dominant VLSI Failure Mechanisms Based on Survey Response ~ 5 1 [an 'x' implies an important, but unknown, fraction] Survey response Failure mode/mechanism Electromigration Dielectric breakdown Soft errors Parametric drift Hot electrons Latch-up Electrical overstress Package related Other
1
x
2
50%
3
4
< 0.1%
5
98%
1%
X
10% 20 % 20%
0.1%
Failure Mechanisms
Activation Energy (eV) Die-Metallization
0.3 - 0.6 0.77 - 0.81
Metal corrosion Electromigration large-grain glassivated A1 small-grain AI
1.o 0.5
AI
0.43 0.35 - 0.85 0.24 - 0.57 0.7
Al- 1%Si
1.67 - 2.56 0.58 0.96
Metallization migration
1 2.3
Stress-driven diffusive voiding
0.4 1.0 - 1.4
13% 2%
Device and Device Oxide Ionic contamination (surface, bulk) 0.6 - 1.4 1.4
38%
Hot carrier
-0.06
Slow trapping
1.3 - 1.4
X
2%
< 0.1%
TABLE 2 Activation Energies for Common Failure-Mechanisms [19]
6
X
x
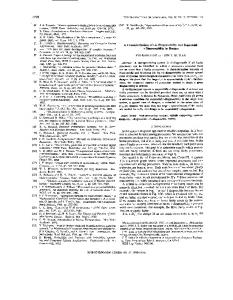
change in the relative dominance of a failure mechanism dramatically skews the predictions. Figure 3 shows the sensitivity of 1/X to a change in the activation energy [46].
x x x
28% 19%
Moreover, activation energy for each failure mechanism varies over a wide range, as shown in table 2 [19] and depends on the materials, geometries, manufacturing processes, and quality-control methods 1451. This variatiorduncertainty negates the usefulness of the Arrhenius model, because the effect of even a '0.05 eV variation in the activation energy' on the failure rate predicted by the Arrhenius model at a temperature of 70 "C ( T = 343K) is:
This means that a variation of 0.05 eV at 70 "C results in a 'factor of 5' error in failure rate; this error is larger at lower temperatures. Because variationhncertainty in activation energy is often greater than 0.05 eV, even for the same failure mechanism, a predicted reliability has little meaning, and a
Gate-oxide breakdown ESD
-
0.3 - 0.4 0.3
TDDB
1 0.3 2.1 0.3 - 1.0
EOS
2
Surface-charge spreading
1.0 0.5 - 1.0
First-Level Interconnection Au-AI intermetallic growth 0.5 1.o 1.1 2.0
The effect of temperature on electronic devices is often estimated by extrapolating from accelerated tests at extremely high temperatures. For example, electromigration tests are generally conducted at temperatures above 250 "C and at current densities 10 times those in actual operation. The test results are then extrapolated to operating conditions to obtain a value for the thermal acceleration of device failures. Implicit in the test strategy are the assumptions (usually unstated):
IEEE TRANSACTIONS ON RELIABILITY, VOL. 45, NO. 1, 1996 MARCH
6
e
e
the failure mechanisms active at higher temperatures are also active in the equipment operating range; no other failure mechanisms become important in the operating range, the Arrhenius relationship holds.
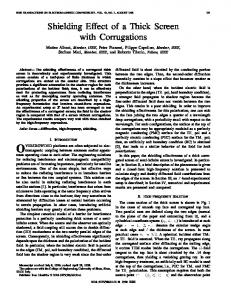
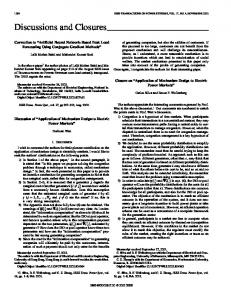
McGarvey [47] has suggested that the dominance of a particular failure ,mechanism strongly depends on a) the type of the test, and b) stress conditions - as shown in figure 4.
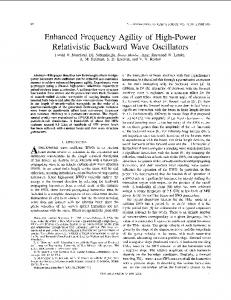
For example, a NIST study [48] noted: “There is ample evidence that a straight forward application of the Arrhenius equation, with activation energies determined from high temperature accelerated stress testing, is not strictly valid for predicting real device lifetime. Many failure mechanisms have temperature thresholds below which failure does not occur. In other cases, high temperature can inhibit or decelerate a failure mechanism that occurs at a lower temperature. Often, threshold information provides a more effective way to design & test a device and to manage stress. Moreover, failure precipitation is not o d y a function of the steady-state temperature but strongly depends on the cyclic temperature, duty cycle, and onloff ratio [49]; figure 5 shows an example of this. ”
-
8YC, 85%RH 1 Cycle : 4 hours
n 0
0 PC = 0.6W
I
.
0.9w
. 100
1000
10000
MTF (hours)
400350300250200150
50
100
Figure 5.
25
Mean-Time-To-Failure vs Duty-Cycle [49] [for temperature, humidity, bias test]
Temperature ( C) Figure 3.
Failure Rate vs Temperature and Activation-Energy’
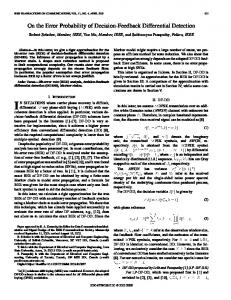
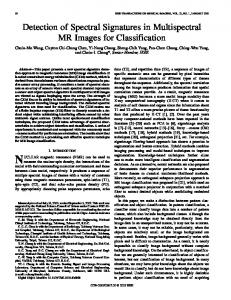
The problem with the use of an activation energy is illustrated by studies of failure rate vs steady-statejunction temperature for semiconductordevices, eg, as shown in figure 6. For many devices there is no statistical correlation between steady-statejunctiontemperature and observed device-failure-rate.
so
X
i-
X X
Po ; 10
10
100
1WO
Ioooo
Time (hours)
Figure 4. Autoclave (121 oC/lOOO/oRH) and 85 “C/85%RH Comparison 1471
O5 0.2
01
I I
X X
I 30
Problems arise when the failure mechanisms at accelerated stress levels are not those in the equipment operating range.
Figure 6.
Ivy
I
I
I
I
40 so 60 Junction temperalure f C)
70
80
Scatter Diagram for Bipolar Logic IC [50]
7
LALL TEMPERATURE AS AN INPUT T O MICROELECTRONICS-RELIABILITY MODELS
aygenerally has the form of an Arrhenius equation (see table 4).Steady-state temperature is the only temperature facArrhenius-based models have been incorporated into some tor or, more generally, the only stress parameter; temperature reliability prediction methods, This section reviews these cycling, vibration, moisture, voltage, and current are not exmethods and the impact of temperature-dependent models on plicitly incorporated into the models. Thus system designers often use temperature reduction as the primary means to imsystem effectiveness. Modern semiconductordesigns, manufacturing processes, prove reliability, often without understanding the actual reliabiliand process controls have improved so that the infant-mortality ty or the hidden costs associated with temperature reduction. and useful-life regions of semiconductor devices have failure rates so low that the bathtub curve "no longer holds water" TABLE 4 [6, 511. For a device operating within specification limits, the Temperature-Acceleration Factors, r T[64] wear-out portion of the curve is delayed well beyond the useful life of most products [18, 52, 531. Table 3 shows that the ma- Ref [4]: T T = jority of electronic hardware failures over the past decade were (1, for Tjunc 5 70°C not component failures, but were attributable to interconnects & connectors, system design, excessive environments, and improper user handling. 2 . 6 - l O 4 e x p [ - ~ ) + 1.8.10'3exp --.)":I
4. RELIABILITY PREDICTION METHODS
1
TABLE 3 History of Dominant Failures in Microelectronic Devices [54]
(
1 otherwise. Ref [3]: r T =
Data Source
Failure analysis for failure rate prediction methodology [55]
Year
Dominant Causes of Failure
1983
Metallization (53%) Oxide/dielectric (17 %)
Westinghouse failure-analysis memos [56]
1984-1987
EOS (40%)
Failure analysis based on failures experienced by end-user [57]
1984-198'8
EOS & ESD (59%) Wirebonds (15%)
Failure analysis based on Delco data [58]
1988
Wirebonds (41 %)
Ref [2]: r T =
Failure analysis by power products division [59]
1988-1989
EOS damage (30%)
Failure analysis on CMOS 1601
1990
Package defects (22%)
Failure in vendor parts screened per Mil-Std-883
1990
Wire bonds (28%) Test errors (19%)
SOW
EOS & ESD (20%)
zzso --
Pareto ranking of failure causes (Texas Instruments study) [61]
1991
11600K
3500K
U
zoVo--
Less-basic attempts to predict the failure rate of devices [2 - 51 are being used, even though they are inaccurate, misleading, and damaging to cost-effective and reliable design, manufacture, testing, and support [62, 631. An overview of these reliability prediction models is in [20, 641. The models typically have the form:
(4)
Abase = base failure rate dimensionless functional factors for device technology, complexity, package type quality, temperature, voltage. ai
Figure 8 is an example from the US Joint InterAgency Working Group (JIAWG) which developed reliability requirements for such new military systems as the F-22 and Comanche
IEEE TRANSACTIONS ON RELIABILITY, VOL. 45, NO. 1, 1996 MARCH
8
(light helicopter). To meet system reliabhty requirements, the maximum componentjunction temperature was determined to be 65 ‘C. For the Comanche, this dictated the development of a supercooling system pumping air at -60°C in order to lower the temperature outside the sealed electronic boxes enough to get component temperatures to 65 “C. Initially there was no consideration of the reliability impact. In particular, on a hot day with 43 “C outside ambient, cooling is started first; the electronic box cools to around -40 “C, then rises to = 60 “C when the electronics is turned on. This extreme temperature cycling would occur every time the helicopter is started & stopped. The lower temperatures are very harmful to solder interconnects during such cycling because they reduce the creeprate of solder and thus inhibit stress relaxation [69]. In addition to fatigue damage, Boeing engineers estimated appreciable standby water in the bottom of the electronic assemblies due to condensation. When further reviewed by the Army, junction temperatures were raised and the use of ‘MdHdbk-217 and its temperaturereliability’ was dropped. The final statement from Boeing was: “. . . the validity of the steady-state temperature relationship to reliability is constantly in question and under attack as it lacks solid foundational data.”
2. Develop an understanding of the material properties and architecturesused in the design. This involves tailoring the product design to requirements by modifying materials geometry, and allowable manufacturing non-conformities . 3. Learn how products fail under various forms of degradation. This involves assessing the potential failure mechanisms and determining the role of stresses, including steady-state temperature, temperature cycling, temperature gradients, and time-dependent temperaturechanges, on the failure mechanisms. 4. Carefully examine field failure data to get informationon how failures occur. Beware of confusing statistical correlation with cause & effect. 5. Control manufacturing to reduce the variations that cause failure. 6. Design the product to account for temperature-relatedperformance degradation. Steady-state temperature has an influence on many electrical functional parameters, including propagation delays and noise margins.
REFERENCES A. Dasgupta, M. Pecht, “Material failure mechanisms and damage models”,
Teiiipernkm (“C)
Figure 8. Guidance for Reliability Allocations in a System’
5. ENGINEERS WORKING TOGETHER How should engineers (design, thermal management, reliability) work together? To address the actual impact of temperature, design, thermal management, and reliability the engineers should work together, using the following physics-of-failure 6-step method:
1. Develop a thorough knowledge & understanding of the environment in which the equipment will operate. Usually, the customer specifies the external operating environment in terms of absolute physical parameters, such as temperature ranges, or quotes the relevant chapter in some handbook or specification. While this may be a useful starting point for the designer, it rarely identifies the actual range of environments experienced by the equipment. It is usually better, and from the customer’s point of view, more contractually sound, to state where and how the equipment will be used. Consumer-goodsmanufacturers, such as the automobile industry, have never had the “benefit” of a detailed environmental specification supplied by their customers (the public), but have been able themselves to ascertain effectively the environment.
IEEE Trans. Reliability, vol40, 1991 Dec, pp 531-536. Mil-Hdbk-217F, Reliability Prediction of Electronic Equipment, 1991; US D q ’ t of Defense. CNETRecueil de Donnees de Fiabilitee du CNET (Collectionof Reliability -from CNET),1983; Centre National $Etudes des Telecommunications. HRD5, Reliability Prediction British Book, 1995 Mar; British Telecom. SN29500, Reliability and Quality Specijication Failure Rates of Components, 1986; Siemens Standard. K. Wong, “What is wrong with the existing reliability prediction methods?”, Quality & Reliability Eng’g Int’l, vol 6, 1990, pp 251-257. H. Blanks, “Arrhenius and the temperature dependence of non-constant failure rate”, Quality & Reliability Eng’g Int’l, vol6, 1990, pp 259-265. S. Witzmann, Y . Giroux, “Mechanical integrity of the IC device package: A key factor in achieving failure free product performance”, Trans. First Int’l High Temperature Electronics Con5 1991 Jun, pp 137-142. R. Berry, S. Rice, J. Ross, Physical Chemistry, 1980; John Wiley & Sons. I. Clark, L. Harrison, V. Kondratiev, et al, The Theory of Kinetics (C. Bamford & C. Tipper, Eds), 1979; Elsevier Scientific. H. Eyring, S. Lin, S. Lin, Basic Chemical Kinetics, 1980; John Wiley & Sons. E. Wigner, “The transition state method % Effects of the electron interaction on the energy levels of electrons in metals”, Faraday Society (London) Trans, vol 34, 1938, pp 29-41. M. Evans, M. Polanyi, “Inertia and driving force of chemical reaction”, Faraday Society (London) Trans, vol 34, 1938, pp 11-29. F. Reif, Fundamentals of Statistical and Thermal Physics, 1965; McGraw HiU. IITRI, 1988 January 15, RADC. LSI Logic, Reliability Manual and Data Summary, 1990, pp 12-18. J. Setliff, “A review of commercial microcircuit qualification and reliability methixlology”, Proc. Adv. Microelectronics Tech, Qualification, Reliability and Logistics Workshop, 1991 Aug 13-15, pp 325-335. P. O’Connor, “Reliability prediction: Help or hoax?”, Solid State Technology, 1990 Aug, pp 59-61. P. Lall, M. Pecht, E. Hakim, “Characterization of functional relationship between temperature and microelectronic reliability”, Microelectronics & Reliability, vol 35, num 3, 1995, pp 377-402. N. Kelkar, A. Fowler, M. Pecht, M. Cooper, “Phenomenological reliability modeling of plastic encapsulated microcircuits”, ISHM Int ’1 J . Microcircuits and Electronic Packaging, vol 19, num 1, 1996.
9
LALL TEMPERATURE AS AN -INPUT T O MICROELECTRONICS-RELIABILITY MODELS
F. Jensen, N. Peterson, Bum-in: An Engineering Approach to the Design and Analysis of Burn-in Procedures, 1982; John Wiley & Sons. E. Amerasekera, D. Campbell, Failure Mechanisms in Semiconductor Devices, 1987, pp 12-96; John Wiley & Sons. E. Hakim, Microelectronic Reliability, Reliability Test & Diagnostics - I, 1989; Artech House. J. Black, “Current limitations of thin film conductors”, Proc. Znt’l Reliability Physics Symp, 1982, pp 300-306. D. Peck, “Comprehensive model for humidity testing correlation”, Proc. Int’l Reliability Physics Symp, 1986, pp 44-50. P. Ghate, “Aluminum alloy metallization for integrated circuits”, Thin Solid Films, vol 83, 1981, pp 195-205. J. Towner, E. Van de Ven, “Aluminum electromigration under pulsed D.C. conditions”, Proc. Int’l Reliability Physics Symp, 1983, pp 36-39. J. Lloyd, R. Koch, “Study of electromigration-inducedresistance and resistance decay in aluminum thin film-conductors” , Proc. In?? Reliability Physics Symp, 1987, pp 161-168. J. Black, “Electromigration of AI-Si alloy films”, Proc. Int’l Reliability Physics Symp, 1978, pp 233-240. J. Reimer, “The effect of contaminants on aluminum film properties”, J. Vacuum Science & Technology, vol 2, 1984, pp 242-243. M. Saito, S . Hirota, Effect of Grain Size on the Lifetime of Aluminum Interconnections”, 1974, pp 22; Rev. Electrical Communications Lab J . Suehle, H. Schafft, “The electromigration damage response time and implications for DC and pulsed characterizations”, Proc. Int ’1 Reliability Physics Symp, 1989, pp 229-233. H. Schafft, T. Grant, A. Saxena, C. Kao, “Electromigration and the current density dependence”, Proc. Int ’I Reliability Physics Symp, 1985, pp 93-99. F. Fantini, G. Specchiulli, C. Caprile, “The validity of resistometric technique in electromigration studies of narrow stripes”, Thin Solid Films, VOI 172, 1989, pp L85-L89. D. Abbott, J . Turner, “Some aspects of GaAs MESFET reliability”, IEEE Trans. Microwave Theory & Tech, vol MTT-24, 1976, pp 317-321. J. McPherson, C. Dunn, “A model for stress-induced metal notching and voiding in very large-scale integrated AI-Si (M metallization”, J . Vacuum Science & Technology, vol B5, num 5, 1987, pp 1321-1325. A. Tezaki, T. Mineta, H. Egawa, T. Noguchi, “Measurement of three dimensional stress and modeling of stress induced migration failure in aluminum interconnects”, Proc. Int ’1 Reliability Physics Symp, 1990, pp 221-229. D. Baglee, “Characteristics and reliability of l O O A oxides”, Proc. Int’l Reliability Physics Symp, 1984, pp 152-155. D. Crook, “Method of determining reliability screens for time dependent dielectric breakdown”, Proc. Int ’1 Reliability Physics Symp, 1979, pp 1-7. Y. Hokari, T. Baba, N. Kawamura, “Reliability of thin SiO, films showing intrinsic dielectric integrity”, IEDM Tech. Digest, 1982, pp 46-49. E. Anolick, G. Nelson, “Low field time dependent dielectric integrity”, Proc. Int’l Reliability Physics Symp, 1979, pp 8-12. J. McPherson, D. Baglee, “Acceleration factors for thin gate oxide stressing”, Proc. Int’l Reliability Physics Symp, 1985, pp 1-5. J. Irvin, A. Loya, “Failure mechanisms and reliability of low noise GaAs FETs”, Bell System Techn. J , vol 57 1978, p 2823. Quoted from [67]. S. Mizugashira, E. Sakaguchi, 15” Symp. Reliability & Maintainability, 1985, p 53. Quoted from 1671. P. White, B. Hewett, J. Turner, “Reliability investigationsofGa+ power FETs with aluminum gate metallization”, Proc. European Microwave Conf, 1978, pp 405-409. R. Merrett, J. Bryant, R. Studd, “An appraisal of high temperature humidity stress tests for accelerating plastic encapsulated semiconductor components”, Proc. Int’l Reliability Physics Symp, 1983, pp 73-82. W. McGarvey, “Autoclave vs 85”C/85’:RH testing - A comparison”, Proc. Int’l Reliability Physics Symp, 1979, pp 136-142. J. Kopanschi, D. Blackburn, G. Harman, D. Berning, “Assessment of reliability concerns for wide-temperature operation of semiconductor devices and circuits”, First Int’l High Temperature Electronics Conf, 1991.
T. Ajiki, M. Sugimoto, H. Higuchi, S . Kumada, “New cyclic biased THB test for power dissipated IC’s’’, Proc. Int’l Reliability Physics Symp, 1979, pp 118-126. 0. Hallberg, “Hardware reliability assurance and field experience in a telecom environment”, Quality & Reliability Eng’g Int’l, vol 10, 1994, pp 195-200. K. Beasley, “New standards for old”, Quality & Reliability Eng’g Int’l, V O ~6, 1990, pp 289-294. E. Hakim, “Reliability prediction: Is Arrhenius erroneous?”, Solid State Technology, vol 57, 1990 Aug, pp 57. J. McLinn, “Constant failure rate: A paradigm transition”, Quality & Reliability Eng’g Int’l, vol 6, 1990, pp 237-241. M. Pecht, V. Ramappan, “Are components still a major problem? A review of electronic systems and device field failure returns”, IEEE Trans. CHMT, vol 6, 1992 Dec, pp 1-5. P. Manno, “Failure rate prediction methodology % Today and tomorrow”, NATO ASI Series, vol F3, 1983. Westinghouse Electric C o p , Failure Analysis Memos, 1989. C. Bloomer, et al, “Failure mechanisms in through hole package”, Electronic Material Handbook, vol 1, 1989, pp 976. Delco Data. (as of 1988 Nov 02) ETDL LABCOM - from 636 ICs analyzed (513 Bipolar and 123 MOS). Quoted from [68]. D. Taylor, “Temperature dependence of microelectronic devices failures”, Quality & Reliability Eng’g Int’l, vol 6, 1990, p 275. Private Correspondence, Fort Monmouth, NJ. C. Leonard, “How failure prediction methodology affects electronic equipment design”, Proc. PCIM, 1989 Oct, pp 155-164. M. Cushing, D. Mortin, T. Stadterman, A. Malhotra, “Comparison of electronics reliability assessment approaches”, IEEE Trans. Reliability, vol 42, 1993 Dec, pp 600-607. M. Cushing, et al, “Design reliability evaluation of competing causes of failure in support oftest-timecompression”, Proc. IES, vol2, 1994, pp 1-8. J. Bowles, “A survey of reliability prediction procedures for microelectronic devices”, IEEE Trans. Reliability, vol 41, 1992 Mar, pp 2-12. M. Kelly, W. Boulton, J. Kukowski, et al, J7EC Panel Report on ElectronicManufacturing & Packaging in Japan, 1995Feb, Loyola College, MD. J. Evans, P. Lall, R. Bauemschub, “Framework for reliability modeling of electronics”, Proc. Ann. Reliability & MaintainabilitySymp, 1995, pp 144-151. Ricco, Fantini, Magistralli, Brambilla, “Reliability of GaAs MESFET’s”, in Christou & Unger, SemiconductorDevice Reliability, 1990, pp 455-461; Kluwer Academic Publishers. H.K. Dicken, Physics ofSemiconductorFailures,1988,p 119;DM Data Inc. K.L. Murty, L. Turlik, ‘Deformation mechanisms in tin-lead alloys: Application to solder reliability in electronic packages‘, Proc, 1st Joint Conf, Electronic Packaging, 1992, pp 309-318; ASMEIJSME.
AUTHOR Dr. Pradeep Lall; Motorola Inc; Plantation, Florida 33322 USA. Pradeep L d is Lead Mechanical Engineer at Motorola’sAdvancedManufacturing Technology Center in Plantation. His expertiseis in design, modeling, predictive, and experimental techniques applied to product reliability and to processes related to electronic equipment. He has published extensivelyin electronic packaging with emphasis on temperature effects, degradation mechanisms, failure modeling, reliabilityassessment, quality assurance & qualification,and derating. He has published book chapters on topics related to electronic packaging, including physics-offailure models, design guidelines, accelerated testing, electromigration, thermal stress & strain in electronics, passive devices (resistors), plastic packaging, and multichip modules. Dr. Lall received his MS (1989) and PhD (1993) in Mechanical Engineering, with focus on electronic packaging, from the University of Maryland. He is a member of the IEEE and ASME. Manuscript received 1996 February 27 Publisher Item Identifier S 0018-9529(96)03980-2
..