Numerical differentiation methods for the logarithmic derivative ...
Recommend Documents
entiation [7,8], which is a convolution of a uniformly- .... for a broad range of parameters in [7,9]. .... a detailed one needs to be determined in the light of the.
Mar 8, 2007 - ckB(k, k0). It should be mentioned here that this representation also leads to a smoothing problem (5), cf. App. A. But instead of the computation ...
11/14/2007 http://numericalmethods.eng.usf.edu. 1. Numerical Differentiation h xf
hxf xf h. )(. ) ( lim. )(. 0. −. +. = ′. →. Recall the definition of first derivative.
Dec 10, 2013 - the Simultaneous Determination of Carmoisine and Ponceau ... colorants, Carmoisine (E122) and Ponceau 4R (E124), in their binary mixtures and soft drinks. ..... point for Ponceau 4R) was related to the actual contents of.
as BSD (âbody and soul derivativeâ) after the title of the book where it was studied for functions of the single variable. The book is a part of the mathematics ...
Jun 18, 1983 - (n+ l)-dimensional, oriented, real analytic manifold such that 8r is an orientation ..... PROOF. Define z x y. Then. T where the j coordinate of the vectors z, x or y is positive if ..... A meromorphic function f on D(b) is the quotien
10 difference methods for the considered constitutive models. CSDA numerical scheme is observed. 11 to outperform other numerical differentiation schemes in ...
Jan 11, 2016 - With these boundary derivative formulations, the Jacobian determinants can be ... formal mapping, the length-to-width ratio of the rectangular.
Annals of Mathematics, 163 (2006), 1057â1076. Cauchy transforms of point masses: The logarithmic derivative of polynomials. By J. M. Anderson and V. Ya.
You're teaching a Calculus class, and get to the point in the course where it is ....
Deborah Hughes-Hallett, et al., Calculus: Single and Multivariable (3rd ed.) ...
the unit disk, with the property that the logarithmic derivative is contained in some domain ..... is symmetric about the real axis, the function F will not be bounded.
Chapter 8 – Numerical Integration and Differentiation. Prof. Michael ... Outline. 1.
Numerical Integration. 2. Numerical Differentiation. 3. Richardson Extrapolation.
functions here considered and the matrix functions involved in the Exponential. Integrators for IVPs (the so-called phi-functions) respectively. It is just the paper ...
Jul 29, 2014 - geometric function and the Gauss hypergeometric function. .... ware packages such as Matlab R2013a [99] and Mathematica 8 [100] are not ...
Aug 23, 2011 - Definition 1 (Robust Descent Direction) Let f be a locally-Lipschitz function and ¯x be a point. .... In particular, [BKS08] requires p(n + 1) function evaluations per iteration ... (b) Poll step: Choose a positive spanning set Dk and
ABSTRACT: Simple, fast and reliable derivative spectrophotometric methods were developed for determination of olanzapine in bulk and pharmaceutical ...
3, 5], the original pattern search algorithm of Robert. Hooke and T. A. Jeeves 14], and more recently the multidirectional search algorithm and its variants de-.
F(x) = 0. (1) where F : R n. â R m is a continuously differentiable function and m ⤠n, making special ... addressed using the spectral residual approach in [11] and the Broyden Quasi. Newton ..... n, the algorithm that allows us to obtain the ne
Mar 28, 2018 - and second derivative of (3) at. , 0,1, ,. n j x j Ï. +. = give a system of equations in the form. AX U. = (4). Figure 1. Showing RAS for Case 1.
only 11 decimal digits precision in the result like with 400 points, but one can .... take an integration with respect to the Gauss-Laguerre quadrature rule. We.
Jan 1, 1993 - The traditional, simple numerical differentiation of finite-element stiff- ness matrices by a forward difference scheme is the source of severe error.
Numerical differentiation methods for the logarithmic derivative ...
Numerical differentiation methods for the logarithmic derivative technique used in dielectric spectroscopy#. Henrik Haspel, Ãkos Kukovecz*, Zoltán Kónya, Imre ...
Processing and Application of Ceramics 4 [2] (2010) 87–93
Numerical differentiation methods for the logarithmic derivative technique used in dielectric spectroscopy# Henrik Haspel, Ákos Kukovecz*, Zoltán Kónya, Imre Kiricsi Department of Applied and Environmental Chemistry, University of Szeged, Rerrich 1, 6720 Szeged, Hungary Received 15 January 2010; received in revised form 28 June 2010; accepted 30 June 2010
Abstract In dielectric relaxation spectroscopy the conduction contribution often hampers the evaluation of dielectric spectra, especially in the low-frequency regime. In order to overcome this the logarithmic derivative technique could be used, where the calculation of the logarithmic derivative of the real part of the complex permittivity function is needed. Since broadband dielectric measurement provides discrete permittivity function, numerical differentiation has to be used. Applicability of the Savitzky-Golay convolution method in the derivative analysis is examined, and a detailed investigation of the influential parameters (frequency, spectrum resolution, peak shape) is presented on synthetic dielectric data. Keywords: dielectric spectroscopy, logarithmic derivative, Savitzky-Golay method I. Introduction Dielectric relaxation spectroscopy (DRS) has become a popular and powerful technique for studying the dielectric properties of almost any kind of material. Modern measurement systems allow the acquisition of relaxation spectra over a wide range in frequency and temperature with a high accuracy. Hence we are able to obtain information about molecular relaxation dynamics and conduction processes, leading to a deeper understanding of the materials’ nature. In order to extract most of the information carried by the measurement data, mathematical methods may be applied. In broadband dielectric spectroscopy the so-called harmonic analysis is used. This means that the value of the permittivity function is only known at given measurement frequencies. Since the spectra are discrete datasets, only numerical approximations can be used. Therefore, the result of the evaluation depends strongly on the precision of these methods. In this paper we will present numerical derivative calculations on synthetic dielectric data. All the influ-
ential parameters are considered, and the capabilities and limitations of the approach are discussed.
II. Theoretical Background In DRS the frequency-dependent complex dielectric function is used to determine the electrical/dielectric properties of materials [1]:
ε ∗ (ω ) = ε ′(ω ) − ε ′′(ω )
where ε’(ω) is the real and ε”(ω) is the imaginary part of the complex dielectric function. If the measured sample contains mobile charge carriers, i.e. it exhibits conduction, a considerable increase shows up in the low frequency part of the imaginary permittivity spectrum (loss spectrum). In moderately to highly conducting materials this “conductivity tail” hampers the proper analysis of slow dipolar relaxations. Furthermore, if the charge carriers are mobile ions, an undesirable effect, the socalled electrode polarization takes place (EP) [2]. This is due to the partial blocking of the charge exchange at the sample/electrode interfaces which results in the formation of two double layers. These double layers give rise to large capacitances in series to the conducting bulk of the sample. This manifests itself in a high apparent dielectric constant typically in the low frequency range. There are several meth-
Paper presented at 8th Students’ Meeting, SM-2009, Processing and Application of Ceramics, Novi Sad, Serbia, 2009 * Corresponding author: tel: +380 44 424 3364, fax: +380 44 424 2131, e-mail: [email protected] #
shape parameters. parameters. There There There Dshape ,hape he ,EEshape 11parameters. are areparameters. the the shape shape parameters. parameters. There There There
Figure 1. Comparison of dielectric loss ε”(ω) (lines with symbols) and ε”der(ω) (dashed lines) for symmetric (left) and for Figure 1. Comparison of dielectric loss İ"(Ȧ) (lines with symbols) and İ"der (Ȧ) (dashed lines) for symmetric (left) and for asymmetric (right) HN functions for α,β = 0.2, 0.4, 0.6, 0.8, 1 asymmetric (right) HN functions for D,E = 0.2, 0.4, 0.6, 0.8, 1
88 xx
H. Haspel et al. / Processing and Application of Ceramics 4 [2] (2010) 87–93 H. Haspel et al. / Processing and Application of Ceramics 4 [2] (2010) 87–93
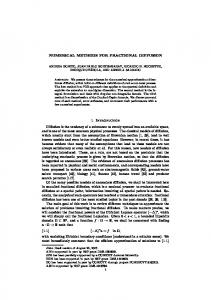
Figure 2. Numerical approximation of the logarithmic derivative of the Debye peak at four different spectrum resolutions Figure 2. Numerical approximation of the logarithmic (r =derivative 2, 21/2, 21/4,of 21/8the ) Debye peak at four different spectrum resolutions (r = 2, 21/2, 21/4, 21/8)
that must be treated separately, using special coefficients For differentiating the[9]). entire has to to calculate the derivative Thespectrum values of one the coeffislide this (2m + 1) point „window” through the cients depend on the degree of the fitted polynomial and measured data points (except for m points at each end the chosen width of the „window” and were published offorthe data array must be treated a broad range that of parameters in [7,9].separately, using special coefficients to calculate The We examined the effect of the the derivative polynomial[9]). degree values of the coefficients depend on the degree of the and the width of the dataset, used in one calculation fitted polynomial and the chosen width of the step, on the quality of the approximation of the deriva„window” were spectrum publishedresolutions for a broad rangebaof tive at fourand different for three parameters in [7,9]. sic dielectric peaks. A normalized Debye, a Cole-Cole examined thepeak effect of chosen the polynomial degree andWe a Cole-Davidson were for that with the and the width of the dataset, used in one calculation following parameters: Δε = 1, τ = 0.01, (β = 1, α = 0.22), step, the quality the approximation of the (α = 1,onβ = 0.2). The SGof coefficients of the used approxderivative at four different spectrum resolutions for imations are listed in Table 1. threeAtbasic peaks.the A two normalized n = 2 dielectric and (2m + 1) = 5 different Debye, set of co-a Cole-Cole and a Cole-Davidson peak were chosen for efficients are the quadratic five-point SG and the quathat with the following parameters: ǻİ = 1, W = 0.01, dratic spline, respectively [10]. r is the logarithmic = 1, D between = 0.22), (the D =measurement 1, E = 0.2). The SG chosen coefficients (E spacing points as r of= the used approximations are listed in Table 1. step 2, 21/2, 21/4, 21/8. Thus, spacing is halved in every At n =the 2 and (2m + 1) the two different (doubled resolution) on=a 5logarithmic scale. set of coefficients are the quadratic five-point SG and the quadratic spline, III. Results andrespectively discussion [10]. r is the logarithmic spacing between the measurement points chosen as r = The 1/4 results 1/8 of the numerical differentiation with , 2 , 2 . Thus, spacing is peak halved every step 2,the21/2 five techniques for the Debye areinpresented in (doubled the resolution) on a logarithmic scale.
Fig. 2. One can easily compare the exact derived peak with the numerically calculated ones visually. The inset III. Results and discussion graphs magnify the peaks at their maxima. As a general rule we state that as the resolution of the analyzed Thecanresults of the numerical differentiation with spectrum increases, all tested approximations provide in the five techniques for the Debye peak are presented good resolution, the more precise Fig. results. 2. One The can larger easily the compare the exact derived peak the technique is. At the same time we havevisually. to considwith the numerically calculated ones The erinset that graphs in broadband dielectric spectroscopy the number magnify the peaks at their maxima. As a ofgeneral measurement couldthat not as be the increased arbitrarirule wepoints can state resolution of the lyanalyzed because spectrum the measurement time depends on increases, all strongly tested approximations it,provide especially in the low frequency Rememberthe good results. The largerregime. the resolution, that at 0.001 Hzthe onetechnique total period ~17same min, time hencewe more precise is. takes At the -3 7 to measurement consider that dielectric –10 Hz range takes ahave dielectric in thein10 broadband spectroscopy the number measurement hours or even days at veryofhigh resolution. points There could are not be increased the measurement cases where this canarbitrarily be realizedbecause (with stable sample, or time strongly dependstechnique on it, especially in the low quenched measurement [11]), but with sensifrequency regime. Remember thattime at is0.001 Hz one tive or time-dependent systems [12] of primary total period takes ~17 hence a dielectric importance. Therefore, resultsmin, at lower resolutions are the 10-3–107 Hz range takes hours or ofmeasurement great practicalinsignificance. even very high resolution. There cases Thedays most at emphatic differences between the are applied where this can be realized (with stable sample, numerical techniques are at r = 2 logarithmic spacing. It or quenched measurement [11]), decreasbut with can be seen, that as the degreetechnique of the polynomial or time-dependent systemsthe [12] time is of essensitive or the width of the dataset increases, numerically primarypeakimportance. at lower derived is broadened Therefore, its maximumresults is lowered. resolutions are of great practical significance.
89 xx
H. Haspel et al. / Processing and Application of Ceramics 4 [2] (2010) 87–93
Table 1. bk coefficients used for the calculation of the logarithmic derivative
(2m + 1) 5
n=2 (-2,-1,0,1,2) 10 ln r
7
n=3 (1,-6,0,6,-1) 8 ln r
(-3,-2,-1,0,1,2,3) 28 ln r
The explanation of the first observation is that a higher degree polynomial can describe rapid changes better. Since the Debye peak is the sharpest peak that theoretically exists in dielectric spectroscopy, such a function fits better onto the data. However, higher degree polynomials are not considered in the following in order to avoid overfitting which would describe random error instead of the underlying process in a real, noisy measurement. The latter statement is also easy to understand by recalling the calculation procedure applied in the convolution method. A set of data points is multiplied with a set of coefficients in order to get the smoothed derivative at the middle of the data set and then this “window” is slid forwards. Practically, this is a weighted moving average which suppresses here not only the transients (in the case of noisy data), but the whole peak. As the fitted dataset broadens, the suppression is more and more notable. The following order of decreasing accuracy of the applied methods can be deduced from Fig. 2 at r = 2: fivepoint cubic SG (5pt n = 3), five-point quadratic spline (Spline), seven-point cubic SG (7pt n = 3), five-point quadratic SG (5pt n = 2), and seven-point quadratic SG (7pt n = 2). It is also obvious that this order is just an impression from the figure and does not take the effect of the frequency into account. Furthermore, at higher resolutions the differences between the function and the numerical results decrease with each applied method, hence with increasing resolution the use of lower degree polynomials or wider datasets provides also a good result. In those measurements where huge amounts of data can be collected and these data suffer from considerable noise, the use of larger arrays should be considered. Visual comparison allows important qualitative conclusions to be drawn but it lacks the possibility of exact numerical characterization of the applied methods. In our case the absolute and the relative error is defined as:
(1,-8,0,8,-1) 12 ln r (22,-67,-58,0,58,67,-22) 252 ln r
The quantitative results for the Debye, Cole-Cole, and Cole-Davidson peaks are given in Fig. 3. Since the quadratic Savitzky-Golay approximations are the worst ones, only the three other techniques (five-point quadratic spline, five-point cubic SG, seven-point cubic SG) are the subjects of our further investigations. Fig. 3 is technically a matrix, in its rows results for the three peaks at one specific resolution, whilst in its columns calculations for one specific peak at four different resolutions are presented. As expected, the accuracy of the approximations strongly differs with changing peak shapes. A broader peak could be fitted by any of the tested methods with an acceptable error. The difference in the absolute and relative errors for the Debye and for the Cole-Cole peak is about four-five order of magnitude at any resolution. Furthermore, the accuracy depends on the measured frequency as well, so results near and far from the maximum are discussed separately. Hence the original accuracy order established on the basis of Fig. 2. must be reconsidered, or more exactly, a detailed one needs to be determined in the light of the error calculations. At r = 2 spacing, near the maximum of the Debye peak the quadratic spline provides the best result, followed by the five-point, and the seven-point SG with -0.9 %, -3.8 %, -11.7 % absolute, and -1.3 %, -5.0 % and -15.4 % relative errors. At lower and higher frequencies the five-point SG claims the first place (-0.02 % absolute, -15,1 % relative error), the spline is the second (-0.04 % absolute, -40.3 % relative error), and the seven-point SG is the third best choice (-0.1 % absolute, and -127.9 % relative error). In the case of the Cole-Cole peak at the peak maximum the five-point SG is the most accurate method (-1.1×10⁻⁴ % absolute, -1.5×10⁻³ % relative error) followed by the seven-point SG (-7.2×10⁻⁴ %, absolute, -8.9×10⁻³ % relative error) and the quadratic spline (6.7×10⁻³ % absolute, and 8.4×10⁻² % relative error). In Fig. 3. points for spline divided by ten are plotted in order to scale all results to the same order of magnitude. Further from the maximum the same order of accuracy can be found with approximately half of absolute errors which means slightly better relative errors (5pt n = 3: 5.4×10⁻⁵ % abs., 1.2×10⁻³ % rel.; 7pt n = 3: 3.4×10⁻⁴ % abs., 7.2×10⁻³ % rel.; Spline: -1.4×10⁻³ abs., -3.4×10⁻² % relative error) in spite of the decreasing function values.
′′ (ω ) = ε der ′′ ,num (ω ) − ε der ′′ (ω ) ∆ε der and
′′ ,num (ω ) − ε der ′′ (ω ) ′′ (ω ) ε der ∆ε der = ′′ (ω ) ′′ (ω ) ε der ε der The lack of the absolute value function in the definition of the relative error allows this quantity to take negative values that show the direction of the deviation from the approximated function.
90
H. Haspel Haspel et et al. al. // Processing Processing and and Application Application of of Ceramics Ceramics 44 [2] [2] (2010) (2010) 87–93 87–93 H.
Figure 3. 3. Comparison Comparison ofofthe quadratic spline (Spline), the five-point cubic SG (5ptSG n =(5pt 3) and cubic SG Figure the quadratic spline (Spline), the five-point cubic n =the 3)seven-point and the seven-point (7pt n = 3) numerical derivatives for the investigated three different peaks at four resolutions cubic SG (7pt n = 3) numerical derivatives for the investigated three different peaks at four resolutions
As the Cole-Davidson function asymerror). In Fig. 3. points for spline describes divided byanten are metrically broadened Debye peak towhere the slope plotted in order to scale all results the same order of the low-frequency peak is unchanged and magnitude. Furtherwing from of thethe maximum the same order the slope of the decreases with of accuracy canhigh-frequency be found withwing approximately halfdeof creasing it could be regarded a mixture of arelative Debye absolute β,errors which means as slightly better -5 -3 % abs., in 1.2×10 % rel.; 7pt errors (5pt n = 3: peak. 5.4×10 and a Cole-Cole It behaves the low-frequen-4 -3 % abs., % high-frequency rel.; Spline: n =range 3: 3.4×10 cy like a Debye peak7.2×10 and in the -2 -3.4×10peak % relative error) from in spite the 1.4×10as-3 aabs., range Cole-Cole as observable theoferror decreasing function values. calculations. Values at the characteristic frequency are the Cole-Davidson function an best As approximated by the quadratic splinedescribes (-0.03 % abasymmetrically broadened Debye peak where the solute, -0.2 % relative error), then the five-point SG (-0.3 slope of the wing peak is % absolute, -1.7low-frequency % relative error), andofthethe seven-point SG (-1.1 % absolute, and -5.5 % relative error). Close
xx 91
to the peak value the slope five-point SGhigh-frequency is the most accurate unchanged and the of the wing (0.2 % absolute, 0.7 % relative the quadratic E, iterror) couldthen be regarded as a decreases with decreasing spline (0.3of%a absolute, 1.1a%Cole-Cole relative error) sevmixture Debye and peak.and It the behaves en-point SG (0.9 % absolute, and a3.9 % relative in the low-frequency range like Debye peak error). and in So only the accuracy order the direction of the thenot high-frequency range as but a Cole-Cole peak as difference changed. Allcalculations. tested methods behave at observablewas from the error Values at the characteristic approximated by the low frequenciesfrequency similar toare thebest Debye case: 1. five-point -3 quadratic spline (-0.03 % absolute, -0.2 % relative SG (-2.0×10 % absolute, -15.3 % relative error), 2. qua-3 error),spline then the five-point SG (-0.3-40.5 % absolute, -1.7er% dratic (-5.4×10 % absolute, % relative -2 relative error), and the seven-point SGand (-1.1 % ror), 3. seven-point SG (-1.7×10 % absolute, -130.9 absolute, -5.5and % at relative error). Close to thetopeak % relative and error), high frequencies similar the -4 value the case: five-point SG is the accurate (0.2 % Cole-Cole 1. five-point SGmost (4.6×10 % absolute, 3.2×10⁻³ % relative error), 2. seven-point SG (1.1×10⁻² %
H. Haspel et al. / Processing and Application of Ceramics 4 [2] (2010) 87–93
ror). 3. quadratic spline (0.04 % absolute, 1.1 % relative error). At r = 21/8 spacing the previous order is valid for all types of peaks used to describe dielectric relaxation processes. Even if we use the least accurate one, the quadratic five-point spline, the absolute error remains below 0.1 %, the relative error under 0.3 % for a Debye peak, and below 0.01 % absolute, and 0.25 % relative error for a Cole-Davidson peak
absolute, 7.2×10⁻² % relative error), 3. quadratic spline (-2.8×10⁻² % absolute, -0.2 % relative error). Doubling the resolution of the spectrum (r = 21/2) rearranges the accuracy order in the Debye and the ColeDavidson cases. At the maximum value of the Debye peak the former two best choices are interchanged: 1. five-point SG (-0.4 % absolute, -0.5 % relative error), 2. quadratic spline (0.8 % absolute, 1.0 % relative error), 3. seven-point SG (-1.8 % absolute, and -2.4 % relative error), whereas at much lower and higher frequencies the order remains the same: 1. five-point SG (-4.5×10⁻⁴ % absolute, -0.8 % relative error), 2. quadratic spline (-2.9×10⁻³ % absolute, -5.3 % relative error), 3. sevenpoint SG (-3.0×10⁻³ % absolute, -5.5 % relative error). A strong decrease in the errors could be observed, especially far from the peak maximum for the quadratic spline and the seven-point SG. In the case of the ColeCole function the order is the same as mentioned above, but the absolute and the relative errors are so small even if we use quadratic spline (0.002 % absolute, and 0.02 % relative error), that these are completely negligible in the evaluation of a real measurement. Since the errors decrease with increasing resolution, only the two other types of peaks are discussed below. The best method for the Cole-Davidson function at this resolution (r = 21/2) is the five-point SG with the highest absolute error of 0.03 % (0.35 % relative error) in the peak area, and -5.4×10⁻⁵ % (-0.8 % relative error) in the low-frequency range. The second best choice is the quadratic spline with an absolute error of 0.12 % (0.54 % relative error) near the maximum and -3.5×10⁻⁴ % (-5.3 % relative error) at low frequencies. The absolute error for the seven-point SG at the maximum is under 1 % (0.17 % absolute, 0.77 % relative error) and is close to the absolute error of the spline in the lowfrequency regime (-3.6×10⁻⁴ % abs., and -5.5 % relative error). At high frequencies both the absolute and the relative errors of all three methods are much lower, practically negligible, which is the effect of the similarity to the Cole-Cole function. At r = 21/4 logarithmic spacing for Debye peak the accuracy order is the following in the whole frequency range: 1. five-point SG with a highest absolute error of -0.04% and -0.05% relative error. 2. seven-point SG with maximum -0.2 % absolute and -0.3 % relative errors. 3. quadratic spline with maximum of 0.3 % absolute and 1.1 % relative errors. From this resolution on, all examined techniques are able to approximate the sharpest possible derived spectrum with an error (either absolute or relative) less than 1 % (even less than 0.5 %) which is an often used limit in the characterization of analytical methods. For the Cole-Davidson peak the same order holds with very similar highest error values: 1. five-point SG (-0.003 % absolute, and -0.05 % relative error). 2. seven-point SG (-0.02 % absolute, and 0.3 % relative er-
IV. Conclusions The accuracy of numerical techniques could depend on many parameters, hence we have to apply them very carefully. Here we examined the effect of the frequency, spectrum resolution and the shape of the peak on the accuracy of the so-called numerical logarithmic derivative technique, a versatile tool in the evaluation of dielectric relaxation spectroscopy measurements. A well-known numerical method, the Savitzky-Golay convolution method for differentiation was chosen for the calculations. Synthetic dielectric data were generated in the 10-3– 7 10 Hz frequency range with four different resolutions (r = 2, 21/2, 21/4, 21/8 logarithmic spacing). Three types of peaks were used to investigate the shape effect: the logarithmic derivative of the normalized Debye, a normalized Cole-Cole (α = 0.2), and a Cole-Davidson (β = 0.2) functions. These are all empirical dielectric relaxation functions used frequently. From visual comparison of the numerical results for the Debye peak it can be concluded, that with increasing polynomial degree or decreasing dataset width better approximations could be reached even at lower resolution (i.e. at r = 2 spacing). As the resolution of the spectrum increases, all of the investigated methods give good results with an acceptable error. Although applying higher-than-third degree polynomials is not recommended in order to avoid overfitting, the use of wider dataset could be beneficial due to its stronger noise suppression capability. A quantitative analysis of the investigated methods was also done for all the three types of peaks at the four different resolutions. In the case of the Cole-Cole function a definite order in the accuracy can be found. The best choice for the differentiation of such a symmetrically broadened peak is the five-point Savitzky-Golay method at all resolutions. In the case of Debye and Cole-Davidson functions, at lower resolutions there is a difference in the order of accuracy near the peak maximum and far from it. Generally the five-point quadratic spline approximates the peak values best, followed by the five-point SG, which is in turn the most accurate in the low and high frequency regime followed by the quadratic spline. As the resolution increases the five-point SG overtake the first place in every range of frequency for any of the peak shape, and the accuracy of the seven-point SG also increases. Hence if the spacing can be
92
H. Haspel et al. / Processing and Application of Ceramics 4 [2] (2010) 87–93
chosen short enough, wider „windows” in the convolution procedure can be used. Summarizing, numerical differentiation techniques for logarithmic derivative method must be chosen carefully, taking the shape of the relaxation peak, the resolution and possibly the frequency range where the approximation should be the most accurate into account. Although our results support the selection of a proper method, the best tactics is the generation of noisy synthetic dielectric data, which properties are almost the same as the measured spectrum. In that case we could be 100 % sure regarding the reliability of the applied numerical technique.
4. P.A.M. Steeman, J. van Turnhout, “A numerical Kramers-Kronig transform for the calculation of dielectric relaxation losses free from Ohmic conduction losses”, Colloid Polym. Sci., 275 (1997) 106–115. 5. G.G. Raju, Dielectrics in Electric Fields, Marcel Dekker, New York 2003. 6. M. Wübbenhorst, J. van Turnhout, “Analysis of complex dielectric spectra. I. One-dimensional derivative techniques and three-dimensional modelling”, J. NonCryst. Solids, 305 (2002) 40–49. 7. A. Savitzky, M.J.E. Golay, “Smoothing and Differentiation of Data by Simplified Least Squares Procedures”, Anal. Chem., 36 (1964) 1627–1639. 8. J. Steinier, Y. Termonia, J. Deltour, “Comments on Smoothing and Differentiation of Data by Simplified Least Square Procedure”, Anal. Chem., 50 (1978) 1383–1386. 9. P.A. Gorry, “General Least-Squares Smoothing and Differentiation by the Convolution (Savitzky-Golay) Method”, Anal. Chem., 62 (1990) 570–573. 10. F.B. Hildebrand, Introduction to Numerical Analysis, 2nd Ed., McGraw-Hill, New York, 1974. 11. J. Mijovic, J.-W. Sy, “Segmental and normal mode dynamics during network formation”, J. Non-Cryst. Solids, 307-310 (2002) 679–687. 12. Y. Bian, J. Mijovic, “Effect of side chain architecture on dielectric relaxation in polyhedral oligomeric silsesquioxane/polypropylene oxide nanocomposites”, Polymer, 50 (2009) 1541–1547.
Acknowledgment: The financial support of the Hungarian Scientific Research Fund (OTKA) through projects NNF-78920 and 73676 is acknowledged References 1. F. Kremer, A. Schönhals (eds.), Broadband Dielectric Spectroscopy, Springer, Berlin 2003. 2. E. Barsoukov, J.R.Macdonald (eds.), Impedance Spectroscopy: Theory, Experiment, and Applications, John Wiley & Sons, Inc., Hoboken, New Jersey, 2005. 3. A. Brather, “Numerisch einfache Bezichungen zwischen Verlust- und Speicherkomponente des dynamischen dielektrischen Faktors”, Colloid Polym. Sci., 257 (1979) 467–477.