Numerical Modeling of Non-Spherical Response of Therapeutic Encapsulated Microbubbles to. Ultrasound. Chao-Tsung Hsiao and Georges L. Chahine.
Numerical Modeling of Non-Spherical Response of Therapeutic Encapsulated Microbubbles to Ultrasound Chao-Tsung Hsiao and Georges L. Chahine DYNAFLOW, INC. www.dynaflow-inc.com 10621-J Iron Bridge Road Jessup, MD 20794 Abstract. A 3-D zero-thickness shell model was developed to simulate the non-spherical response of therapeutic encapsulated microbubbles subjected to ultrasound excitation. The 3-D model was compared with previous developed models for validation. This model was then utilized to study the bubble break-up during non-spherical deformations resulting from the presence of a nearby solid wall. The effect of shell thickness and standoff distance to the solid wall on the bubble break-up was studied parametrically. A diagram of bubble shapes was derived to categorize bubble forms at break-up, and four zones were identified. The diagram provides the good conditions for drug and gene delivery. Keywords: Therapeutic Ultrasound; Encapsulated Bubble Dynamics; Cavitation; Drug Delivery, Boundary Element Method PACS: 43.35.Ei, 43.80.Sh, 47.11.Hj, 47.55.dd, 47.55.dp
INTRODUCTION Encapsulated microbubbles formed by a gas core and a viscous shell have been used in ultrasound medical applications for many years. The most established use of encapsulated microbubbles is acoustic contrast agents to enhance ultrasonic images quality [1,2]. However, due to their inert properties under normal biological conditions and reactive character when subjected to ultrasound excitation, there are rapidly emerging applications for microbubbles for targeted drug and gene delivery [3-5]. Several ways of using encapsulated microbubbles for targeted drug and gene delivery have been studied. One approach is to inject regular ultrasound contrast agents and drug-containing vesicles simultaneously [5,6]. Then, a sufficiently strong ultrasound pulse is applied to the targeted area such that the contrast agents expand explosively and collapse violently near cells and tissues to produce sonoporation; a temporary formation of pores on the cell membrane, which assist large molecule drugs delivery from carriers to the interstitial tissue. An alternative approach is to incorporate the drug directly into the encapsulating layer of the microbubbles [7-9]. When subjected to ultrasound excitation, the shell is forced to fragment and release the payload to the targeted area. Such drug-laden encapsulated microbubbles need a thick shell to increase the payload because the volume of the drug delivered by the microbubbles is relatively small as compared to other means of drug delivery. Further improvement of drug-laden encapsulated microbubbles is to attach a ligand that is
targeted to specific endothelial receptor [10]. This method allows the encapsulated microbubbles to adhere to the endothelial surface and thus increase local microbubble accumulation and targeted delivery. However, sonoporation is therapeutic only at low doses of ultrasound. An increase in the ultrasound intensity results in cells death and other detrimental biological side effects. Therefore, characterization and understanding of the fragmentation mechanism of encapsulated microbubbles is pivotal to its use for drug delivery. Although many studies [11-14] have been dedicated to investigate shell break-up of encapsulated microbubbles, they are limited to spherical models and no real life deformations are included. From previous studies on bubble dynamics [15-17], it is known that an oscillating bubble may form a re-entrant jet during its collapse depending on its distance to nearby boundaries. A similar behavior is expected with the encapsulated microbubbles. Indeed, micro-jetting and micro-streaming associated with the violent non-spherical breakup have been hypothesized as mechanisms to enhance drug delivery [18]. Understanding this phenomenon is particularly important for drug-laden microbubbles baring surface ligands to adhere to the endothelial surface because of their small standoff from the tissue surface. Hsiao et al. [19] developed a 3-D finite-thickness shell numerical model based on a domain decomposition scheme to study the dynamics of encapsulated microbubbles. The computational domain is composed of inner domains covering the shells, and an outer domain covering the host liquid medium. The inner domains are discretized and solved using an unsteady Navier-Stokes solver, 3DYNAFS-VIS©, while the flow field in the outer domain is solved using a BEM-based potential flow solver, 3DYNAFSBEM©. This method can best describe the dynamics of thick-shelled encapsulated microbubbles, but at high computational cost. In this paper, to speed up computations, we present a 3-D zero-thickness shell model which replaces the shell thickness with an equivalent dilatational viscosity term in the boundary condition.
NUMERICAL MODELS The present 3-D zero-thickness shell model solves the flow field only in the outer domain, which is assumed to be irrotational and incompressible. This assumption allows the definition of a velocity potential, φ, which satisfy the Laplace equation: ∇ 2φ = 0 and u =∇φ , (1) where u is the velocity vector. A boundary integral method is used to solve Equation (1), based on using Green’s theorem, which can be written in the following form:
∫Ω (φ∇
2
)
G − G∇ 2φ d Ω = ∫ n ⋅ [φ∇G − G∇φ ] dS . S
(2)
Ω is the domain of integration, S is the boundary surface, n is local normal unit vector, and G is Green's function. If G is selected to be harmonic everywhere but at some discrete points, such as G = −1/ x − y , where x is a fixed point in Ω and y is a point on the boundary surface S, Equation (2) reduces to Green’s formula with απ being the solid angle at x enclosing the domain Ω: απφ (x) = ∫ n y ⋅ [φ (y )∇G (x,y ) − G (x,y )∇φ (y ) ] dS , (3) S
To solve Equation (3) either the velocity potential, φ, or the normal velocity, ∂φ/∂n, to the boundary surface S needs to be provided. The boundary surface for the current problem (encapsulated microbubble near a wall) includes a rigid wall and the liquid/shell interface. For the rigid wall, a no-penetration condition, ∂φ/∂n =0, is used to specify the normal velocity. For the liquid/shell interface, the velocity potential can be deduced from integration of the Bernoulli equation: ∂φ P ( t ) − Pl 1 = − ∇φ ⋅∇φ , (4) ∂t ρl 2 where P(t) is the imposed acoustic pressure, ρl is the liquid density, and Pl is the liquid side pressure on the liquid/shell interface. Pl can be determined through the normal stress balance across the liquid/shell interface. However, in the zero-thickness shell model, the inner domain is degenerated and thus the liquid/shell interface and the liquid/gas interface coincide. To express the normal stress boundary condition across the liquid/shell/gas interface, we introduce an “effective” normal stress,τ n , to represent the normal stress due to the shell. If the bubble was spherical, then the normal stress balance across the interface would be written as: 2γ R& Pl = pg − − 4 μl + τ n , (5) R R where R is the bubble radius, R� is the bubble wall velocity, μl is the liquid viscosity, γ is the surface tension and pg is the pressure of the gas core. In [21] Hsiao et al. found that if τ n = 12d 0 μ s R& / R 2 , where μ s is the shell viscosity and d 0 is the initial shell thickness, then the spherical finite-thickness shell model recovers the spherical zerothickness shell model derived in [13], using a dilatational viscosity in the normal stress balance equation. To adapt Equation (5) for the current 3-D zero-thickness model, a local spherical motion approximation such that R ~ 2 / C , where C is the interface curvature, and R& ~ ∂φ ∂n is applied. As a result, the normal stress boundary condition is written as: ∂φ Pl = pg − Cγ − C ( 2μl + 3d 0 μ s C ) . (6) ∂n
RESULTS The results and computations in this study focus on thick oil-shelled microbubbles developed for drug delivery. For example, ImaRx Therapeutics (Tucson, AZ) has produced a prototype with a triacetin shell. For a triacetin-shelled bubble in water, we have the following fluid properties used in the numerical computations: μ s = 0.028 kg ms , ρl = 1000 kg m3 , μl = 0.001kg ms , γ = 0.068 kg s 2 .
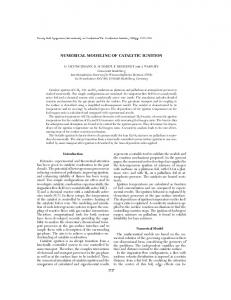
Validity of the 3-D Zero-Thickness Model To validate the 3-D zero-thickness shell model we have compared its solutions with those obtained by a spherical finite-thickness shell model which has been validated with experimental measurement by Hsiao et al. [19]. FIGURE 1(a) shows the comparison between these two models for a bubble with initial outer radius R0 =1.7
μm and an initial thickness of d0* =10-4 μm suspended in water at 1 atm ambient pressure driven by a acoustic wave of amplitude, Pa =0.2Mpa, and frequency, f =2.5MHz. It can be seen that the solution of the zero-thickness model matches very well with the thick shell case. FIGURE 1(b) compares the maximum radius of the oscillation versus normalized with the initial shell thickness after periodic oscillations are reached in both models. It can be seen that the zero-thickness model deviates significantly from the finite-thickness model when the shell thickness exceeds more than 10% of the initial outer radius, but matches very well with it, otherwise. (a)
1.5
(b)
Z e ro thickne ss m od e l F inite thickne ss m ode l
Finite thickness model Zero thickness model 1.4
R
Rmax/R0
1 .5
1
1.3
1.2
1.1 0 .5
0
2
4
6
8
t
10
12
10-4
10-3
10-2
10-1
100
d/R0
FIGURE 1. Comparison between spherical finite-thickness shell model and 3-D zero-thickness shell model of (a) the time history of the shelled bubble radius for d0*=10-4μm and (b) the normalized maximum radius versus normalized initial shell thickness.
FIGURE 2. Comparison of the bubble shape variations between the 3-D finite-thickness model and the zero-thickness shell model at several time steps during the first bubble oscillation cycle.
The 3-D zero-thickness shell model was also applied to simulate the dynamics of a thick-shelled microbubbles near a rigid wall under ultrasound acoustic excitation with Pa =1Mpa, and f =2.5MHz. The thick-shelled microbubble had an initial inner radius of 1.2 μm and an initial outer radius of 1.7μm and was initially located 3.6 μm away from the solid wall. The results of the zero-thickness model are compared to those of the finite-thickness shell model for small standoff conditions. During the comparison we found that using the average across the thickness initial radius of R0 =1.45 μm for the zero-thickness shell model best match the finite-thickness shell model results. FIGURE 2 shows a comparison of the bubble shape variations between the two models at several time steps during the first bubble oscillation cycle. It is seen that the bubble shape of the zero-thickness shell model almost falls between the shape of the inner and outer shell interfaces obtained from the finite-thickness shell model
when shell thickness is think. The solutions start to deviate when the thickness become very thick near the end of bubble collapse.
Effect of Shell Thickness and Standoff on Shell Break-up It has been shown by Chahine [22] that an explosion bubble may become pinched off and cut into two instead of forming a reentrant jet during its collapse depending on its initial distance to a solid boundary. For the current problem other parameters such as shell thickness, shell material, initial bubble radius, acoustic pressure amplitude, frequency may also influence the form of the breakup. In this study we only focus on the effect of standoff and shell thickness on the shell breakup. Simulations were conducted for a triacetin-shelled bubble with an initial mi-thickness radius of R0=1.45 μm under ultrasound acoustic excitation with Pa =1 Mpa, and f =2.5 MHz. To cover a wide range of parametric space, we conducted simulations for five different standoff distances, i.e. X = 1.45, 2.85, 4.35, 5.80 and 7.25 μm, and five different shell thicknesses, i.e. d0 = 0.1, 0.3, 0.5, 0.7 and 0.9 μm. The simulation of each case was continued for more than one oscillation cycle unless breakup occurred earlier.
FIGURE 3. Diagram of bubble shapes within the parametric space studied.
Within the parametric space studied, FIGURE 3 shows a diagram of the bubble shapes either at the end of the simulation due to bubble becoming multi-connected or at the end of the first bubble oscillation cycle. According to the last shape of the bubble surface we can divide the diagram into four zones: In Zone A, a reentering jet is found to punch through the bubble. In Zone B, a ring type of jet is found at touch down. In Zone C, the bubble is found to pinch off into two. In Zone D, the bubble surface does not become multi-connected during the first cycle. Based on this diagram, the bubble break-up in Zones A and B could be the best conditions for drug or gene delivery. That is because the break-up of bubble in the first cycle allows lower ultrasound dose and the jet directed to the wall can help drug or gene particles
penetrate the cell membrane. Although the bubble also breaks up due to pinch-off in Zone C within the first cycle, there is no wall-heading jet to enhance the sonoporation.
CONCLUSIONS A 3-D zero-thickness shell model was developed to study shell break-up mechanisms for a triacetin-shelled microbubble under ultrasound excitation. It is shown that the zero-thickness shell model can predict well the dynamics of encapsulated microbubbles if the shell thickness is less than 10% of the initial shell outer radius. A parametric study on shell thickness and standoff shows a variety of bubble shapes at break-up. Four zones are identified in the parametric space. Based on the diagram, the best condition for drug and gene delivery enhancement can be provided.
ACKNOWLEDGMENTS This work was supported by the National Institute of Biomedical Imaging and Bioengineering under SBIR Phase I and Phase II programs.
REFERENCES 1. 2. 3. 4. 5. 6. 7. 8. 9. 10. 11. 12. 13. 14. 15. 16. 17. 18. 19. 20. 21. 22.
H. Becher, P. N. Burns, Handbook of Contrast Echocardiography: Left Ventricular Function and Myocardial Perfusion, New York, Spring Verlag, 2000. pp1-44. B. B. Goldberg, J. S. Raichlen and F. Forsberg (Eds.), Ultrasound Contrast Agents: Basic Principales and Clinical Applications, London, Martin Dunitz, 2001. K. W. Ferrara, R. Pollard and M. Annu Rev. Biomed. Eng., 9, 415-447 (2007). C. R. Mayer and R. Bekeredjian. Advanced Drug Delivery Reviews, 60, 1177-1192 (2008). J. Song, J. C. Chappel, Q. Ming, E. J. VanGieson, S. Kaul and R. J. Price. J. Am. Coll. Radiol. 39, 726-731 (2002). R. J. Price, D. M. Skyba, S. Kaul, and T. C. Skalak. Circulation 98, 1264-1267 (1998). E. C. Unger, T. O. Matsunaga, T. McCreery, P. Schumann, R. Switzer and R. Quigley. Eur. J. Radiol. 42, 160-168 (2002). S. Y. Chen, J. H. Ding, R. Bekeredjian, B. Z. Yang and R. V. Shohet. Proc. Natl. Acad. Sci. USA, 103, 8469-8474. (2006) P. Hauff, S. Seemann, R. Reszka, M. Schultze-Mosgau and M. Reinhardt. Radiology 236, 572-578 (2005). M. S. Tartis, J. McCallan, A. F. Lum, R. Labell, and S. M. Stieger. Ultrasound Med. Biol. 32, 1771-1780 (2006). C. C. Church. J. Acoust. Soc. Am. 97(3), 1510-1521 (1995). P. Marmottant P, S. van der Meer, M. Emmer, M. Versluis, N. de Jong, S. Hilgenfeldt and D. Lohse. J. Acoust. Soc. Am. 118(6), 3499-3505 (2005). K. Sarkar, W. T. Shi, D. Chatterjee and F. Forsberg. J. Acoust. Soc. Am. 118(1), 539-550 (2005). J. S. Allen, D. J. May and K. W. Ferrara. Ultrasound in Med. & Biol. 29(6), 805-816 (2002). L. A. Crum. Journal de Physique. colloque c8, supplement au N 11, tome 40: c8-285 (1979). G. L. Chahine. Applied Scientific Research 38, 187-197 (1982). S. Zhang, J. H. Duncan, G. L. Chahine. J. Fluid Mech. 257, 147–181 (1993). M. W. Miller. Ultrasound in Med. & Biol. 26, S59-S62 (2000). C.-T. Hsiao, X. Lu, G. L. Chahine. To appear in Ultrasound in Med. & Biol. (2010) G. L. Chahine, T. O. Perdue, C. B. Interaction between underwater explosion bubble and a solid submerged body. DYNAFLOW, INC. Technical Report 89001-1, August, 1989. C.-T. Hsiao, X. Lu, G. L. Chahine. 3D modeling of the dynamics of therapeutic ultrasound contrast agents SBIR Phase I final Report. DYNAFLOW, INC. Technical Report 2M6018-NIH-1, May, 2007. G. L. Chahine. Numerical and experimental study of explosion bubble crown jetting behavior.. DYNAFLOW, INC. Technical Report 96003-1-ONR, July, 1997.