ABSTRACT. We present results from three-dimensional numerical simulations of head-on mergers between two clusters of galaxies using a hybrid hydro/N-body ...
THE ASTROPHYSICAL JOURNAL SUPPLEMENT SERIES, 109 : 307È332, 1997 April ( 1997. The American Astronomical Society. All rights reserved. Printed in U.S.A.
NUMERICAL SIMULATIONS OF MERGING CLUSTERS OF GALAXIES KURT ROETTIGER,1 CHRIS LOKEN, AND JACK O. BURNS Department of Astronomy, New Mexico State University, Las Cruces, NM 88003 ; kroett=pecos.astro.umd.edu, cloken=nmsu.edu, jburns=nmsu.edu Received 1995 June 22 ; accepted 1996 October 14
ABSTRACT We present results from three-dimensional numerical simulations of head-on mergers between two clusters of galaxies using a hybrid hydro/N-body code. In these simulations, the gaseous intracluster medium (ICM) is evolved as a massless Ñuid within a changing gravitational potential deÐned by the collisionless dark matter component. The ICM is represented by the equations of hydrodynamics which are solved by an Eulerian, Ðnite-di†erence method. The cluster dark matter component is represented by the N-body particle distribution. A series of simulations have been conducted in which we have systematically varied the cluster-subcluster mass ratio between 8 : 1 and 1 : 1. We Ðnd that cluster-subcluster mergers result in an elongation of both the cluster dark matter and gas distributions. The dark matter distribution is elongated parallel to the merger axis and accompanied by anisotropy in the dark matter velocity dispersion. Both the elongation and corresponding velocity anisotropy are sustained for more than 5 Gyr after the merger. The elongation of the gas distribution is also generally along the merger axis, although shocks and adiabatic compressions produce elongations perpendicular to the merger axis at various times during the merger. We also Ðnd a signiÐcant o†set between dark matter and gas centroids in the period following core passage. The gasdynamics is also severely a†ected by the cluster-subcluster merger. In these simulations, the subcluster enters the primary at supersonic speeds initiating bulk Ñows that can exceed 2000 km s~1. The width of the bulk Ñows are seen to range between several hundred kiloparsecs to nearly 1 Mpc. We believe the bulk Ñows can produce the bending of wide-angle tailed (WAT) radio sources. The most signiÐcant gasdynamics is seen to subside on timescales of 2 Gyr, although still signiÐcant dynamics is seen even after 5 Gyr. The merger-induced gasdynamics may also play a role in the formation of radio halo sources, and, consequently, the sustained nature of the gasdynamics may extend the lifetime of halos beyond the canonical synchrotron lifetime of the source. Substructure, shocks, and adiabatic cooling during the merger can result in a very complex temperature structure within the intracluster medium. As a result of these mergers, we Ðnd temperature inhomogeneities of several keV on linear scales of ¹0.5 Mpc. Finally, these simulations indicate that even relatively high mass-ratio mergers (e.g., 8 : 1) result in nonequilibrium conditions for an extended period of time. The period of time with the most signiÐcant dynamical evolution is within 2 Gyr after core passage. The nonequilibrium conditions have implications for cluster mass estimates. The observable consequences of cluster mergers and their inÑuence on cluster mass estimates are addressed in Roettiger, Burns, & Loken (1996). Subject headings : galaxies : clusters : general È intergalactic medium È hydrodynamics È methods : numerical 1.
INTRODUCTION
are beginning to realize their full potential as cosmological probes. In recent years, clusters of galaxies have shown great promise in constraining various cosmological parameters. The total mass in clusters as well as their shape (Crone, Evrard, & Richstone 1994) and level of substructure (Richstone, Loeb, & Turner 1992) place limits on ), the matter density in the universe. The mass of their ICM constrains ) , the baryonic fraction of the universe. They have even beenb used, via the Sunyaev-Zeldovich e†ect (Sunyaev & Zeldovich 1972 ; Birkinshaw, Hughes, & Arnaud 1991), to determine H , the current rate of cosmological expansion. 0 However, assumptions must be made about the clusterÏs three-dimensional structure, dynamical state, or both. Typically, they are assumed to be spherically symmetric, virialized, and in hydrostatic equilibrium. These assumptions are being challenged on the basis of observational results (e.g., Loeb & Mao 1994 ; Bird 1995). In a hierarchical universe in which large-scale structures form through the accretion of smaller structures, mergers between clusters of galaxies will play a fundamental role in
This is Paper II in a series which presents the results from numerical simulations of merging clusters of galaxies. Paper I (Roettiger, Burns, & Loken 1993) presented a brief description of the code and a few general results, and Paper III (Roettiger, Burns, & Loken 1996) addresses their observational consequences. In this paper, we focus on the numerical methodology and physical evolution of cluster mergers. Of course, it is the observational implications that have motivated much of this research. The recent availability of X-ray images from Einstein and ROSAT has allowed detailed study of the hot intracluster medium (ICM). Similarly, the recent availability of multiobject spectrographs on large-aperture telescopes has revolutionized the study of galaxy dynamics within clusters of galaxies (e.g., Pinkney et al. 1993 ; Zabludo† & Zaritsky 1995). With the inÑux of the new observational data, clusters of galaxies 1 Current address : Goddard Space Flight Center, Mailstop 930.0, Greenbelt, MD 20771.
307
308
ROETTIGER, LOKEN, & BURNS
1.0000
Normalized Density
0.1000
0.0100
0.0010
0.0001 0.1
1.0 Radius (/250 kpc)
10.0
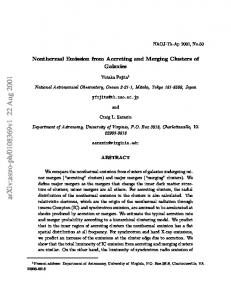
FIG. 1.ÈNormalized initial dark matter (solid) and gas (dashed) proÐles
determining the structure and dynamics of those clusters. Over the years, substantial observational evidence has accumulated suggesting that clusters are not the dynamically relaxed systems they were once thought to be and that mergers do play a signiÐcant role in their evolution. X-ray observations of the hot ICM reveal signiÐcant substructure in 30%È75% of clusters (Jones & Forman 1991 ; Mohr, Fabricant, & Geller 1993a ; Burns et al. 1994a). By X-ray substructure, we refer to multiple X-ray peaks or clumpiness, isophotal twisting, centroid shifting, etc. (e.g., Mohr, Fabricant, & Geller 1993b ; Mohr et al. 1995). New spatially resolved X-ray temperature maps reveal decidedly nonisothermal temperature substructure in the ICM of several rich clusters of galaxies (e.g., A2256, Briel & Henry 1994 ; A754, Henry & Briel 1995). The same is true in the galaxy distributions. Although more difficult to identify than X-ray substructure, Dressler & Schectman (1988) found galaxy substructure in 30%È40% of 15 rich clusters, while Bird (1993) estimates that 30%È70% of well-studied clusters contain signiÐcant substructure in their galaxy distribution. The reader is directed to Pinkney et al. (1996) for a comprehensive overview of galaxy substructure tests. If the observed substructure is the result of recent evolution through mergers, several questions naturally arise. First, how do mergers a†ect the structure and dynamics within clusters ? How are these reÑected in the observed properties of clusters ? Second, how will they inÑuence the analyses currently made under the common assumptions of spherical symmetry, isothermality, hydrostatic equilibrium, and virial equilibrium ? The Ðrst question is addressed in this paper. The latter two will be addressed in Paper III and in Roettiger, Burns, & Pinkney (1995). Although the galaxy cluster data have dramatically expanded and improved in the last decade, two vital components of information are still lacking. First, we do not have information on the true three-dimensional structure in clusters. This situation is unlikely to ever change. Second, we have virtually no information regarding the internal ICM dynamics. This will hopefully change with the launch of the next generation of X-ray satellites (e.g., Astro E). For now, however, we turn to numerical simulations to supply the missing information. The numerical modeling of the dark matter and gas within clusters of galaxies is currently an active area of
Vol. 109
research with a number of participants employing a variety of computational methodologies and initial conditions. Recent work includes Evrard (1990), Cen (1992), Paper I, Schindler & Muller (1993), Pearce, Thomas, & Couchman (1994), Katz & White (1993), Navarro & White (1994), and Bryan et al. (1994a), among others. As represented within this list, the two primary computational methodologies used to model the intracluster gas are smoothed particle hydrodynamics (SPH) and Eulerian hydrodynamics. Many researchers in this Ðeld employ SPH codes. Compared to Eulerian codes, SPH algorithms are relatively simple to implement and less computationally intensive, and, in the absence of a Ðxed grid, they more naturally a†ord higher dynamic range. However, Eulerian codes better handle shocks (Balsara 1991) and high density-contrast Ñows (Schindler & Muller 1993), both of which appear to be important in galaxy cluster mergers. Consequently, we have chosen to employ the Eulerian hydrocode, ZEUS-3D, developed at the National Center for Supercomputing Applications (NCSA). ZEUS-3D (Clarke 1990) is a threedimensional extension of ZEUS-2D, which is discussed in Stone & Norman (1992) (see ° 2.1). There are also two approaches to the initial conditions. The general trend in the Ðeld has been to develop ever more sophisticated initial conditions representative of popular cosmological models. One chooses a spectrum of initial density Ñuctuations tied ultimately to a choice of dark matter properties whether it be cold dark matter (CDM), hot dark matter (HDM), or some combination of the two (CHDM). The chosen density spectrum is applied to a computational volume containing a signiÐcant fraction of the local universe and the density Ñuctuations are allowed to grow, ultimately forming large-scale structures such as clusters of galaxies, superclusters, and voids. These simulations are extremely useful in that they reproduce the large-scale and therefore statistical properties of the observable universe. The subsequent analysis reveals many observationally veriÐable properties (i.e., mass, temperature, and luminosity functions) (e.g., Bryan et al. 1994b). They are limited, however, in that they are necessarily of low resolution. In order to represent a statistically signiÐcant sampling of the universe, a large volume must be simulated. Consequently, typical resolutions are on the order of hundreds of kiloparsecs, so that the cores of clusters are signiÐcantly underresolved. Since a large fraction of the cluster mass, both in dark matter and gas, is contained within the core, the lack of resolution has many implications. As an example, it has been shown by Anninos & Norman (1996) that with the typical resolution of cosmological simulations, cluster X-ray luminosities can be underestimated by a factor of several. In addition, the low resolution severely limits what can be said about the internal cluster dynamics, in particular the dynamics of the ICM. It is apparent that higher resolution simulations are required to obtain a more comprehensive understanding of the cluster environment. It is this fact that has motivated the more idealized approach presented in this paper. Here we begin with the initial conditions of two, isolated, isothermal clusters in hydrostatic equilibrium. There are several beneÐts to this approach. First, it is a more efficient use of the computational volume which naturally leads to higher resolution. The linear resolution in these simulations is scaled to 50 kpc. More signiÐcantly, this corresponds to Ðve zones across the primary cluster core radius. Second, we
No. 2, 1997
MERGING CLUSTERS OF GALAXIES
309
a) -0.25 Gyrs
b) 0.0 Gyrs
c) 0.5 Gyrs
d) 1.0 Gyrs
e) 2.0 Gyrs
f) 5.0 Gyrs
FIG. 2.ÈContours of a slice in gas density taken along the merger axis through the cluster cores in the 8 : 1 mass ratio merger. Contours are logarithmic and constant from one panel to the next, log (o /o ) D 3.6. Each panel represents a di†erent epoch in the evolution of the merger. The times listed above maxThe minlateral dimension of each panel is 6.5 Mpc. The vertical dimension scales accordingly. each panel are relative to the time of core passage.
have essentially isolated the clusters from their environment in order to study speciÐcally the evolution of the merger apart from the formation process. Third, the controlled conditions supply a well-deÐned baseline with which to compare the subsequent evolution of the clusters after the merger. Finally, this paper represents a parameter survey in which we have systematically varied the mass of the galaxy clusters. Galaxy clusters exhibit a range in mass from the relatively poor clusters with mass less than 1014 M to very rich Coma-like systems exceeding 1015 M . Of_ course, _ than highthere are signiÐcantly more low-mass systems mass systems. For this reason, we ran four merger simulations ranging from the merger of two low-mass systems to a merger of a low-mass system with a high-mass system. Comparing mergers spanning a range of relative masses allows us to examine the relative levels of substructure and dynamics that might exist in a representative cluster population.
In this paper, we discuss the evolution of the dark matter and gas components of merging clusters of galaxies. In ° 2, we describe the hybrid hydro/N-body code. In ° 3, we describe the initial conditions including the initial dark matter and gas distributions and the computational grid. In ° 4, we deÐne the parameter space addressed by these simulations. In ° 5 we discuss the results of our parameter study. Finally, in ° 6, we present a brief summary of our more important results. 2.
THE HYBRID CODE
2.1. T he Hydrocode : ZEUS-3D The hydrodynamics component of our code is ZEUS-3D, an astrophysical Ñuid dynamics code maintained by the Laboratory for Computational Astrophysics at NCSA. ZEUS-3D is an Eulerian, Ðnite-di†erence code which solves the equations of ideal magnetohydrodynamics by implementing the algorithms discussed in Stone & Norman
310
ROETTIGER, LOKEN, & BURNS
Vol. 109
a) -0.25 Gyrs
b) 0.0 Gyrs
c) 0.5 Gyrs
d) 1.0 Gyrs
e) 2.0 Gyrs
f) 5.0 Gyrs
FIG. 3.ÈGas density contours, 4 : 1 mass ratio merger, log (o
(1992). We used a Cartesian grid which is fully staggered with scalar quantities being zone-centered while vectors are face-centered. The upwinded, monotonic van Leer interpolation algorithm was used for the advective terms and shocks were smeared over several zones with the usual von NeumannÈRichtmeyer prescription for an artiÐcial viscosity. The size of the individual time steps (dt ) used for hydrothe usual evolving the gas equations is governed by Courant-Friedrichs-Lewy (CFL) stability condition. This ensures that both material and sound waves propagate less than a single zone in one time step. We actually use only half of the CFL time step. 2.2. T he N-Body Code : T REECODE The N-body particle distribution is evolved using the FORTRAN implementation of the Barnes-Hut tree algorithm described by Hernquist (1987). This code has been applied extensively to a variety of astrophysical problems. Our only signiÐcant modiÐcation was the introduction of a variable time step based on the formulation of Pearce et al.
/o ) D 3.6. See Fig. 2. max min
(1994). The adaptive time step is deÐned as
C
dt \ 0.5
D
v 1@2 , max (a)
(1)
where dt is the time step, v is the Ðxed softening parameter (see Hernquist 1987), and a is the particle acceleration. As particle accelerations increase, the time step will decrease. In tests, we have found this formulation of the time step to be useful in mitigating peak-to-peak variations in the total particle energy during the merger. With a Ðxed time step, the total energy evolution showed a sharp increase (D1%) at the time of core passage. This was reduced to D0.4% with the adaptive time step. Extensive tests of TREECODE are presented in Hernquist (1987). The results of our code tests are discussed in the Appendix. 2.3. Interfacing the Codes The TREECODE is run as a subroutine to ZEUS-3D although operation is fairly autonomous. The only contact between the codes is via the time step and the Poisson
No. 2, 1997
MERGING CLUSTERS OF GALAXIES
311
a) -0.25 Gyrs
b) 0.0 Gyrs
c) 0.5 Gyrs
d) 1.0 Gyrs
e) 2.0 Gyrs
f) 5.0 Gyrs
FIG. 4.ÈGas density contours, 2 : 1 mass ratio merger, log (o
solver. The hydrodynamical time step is always shorter than the N-body time step, usually by a factor of 3È4. The time is kept separately by each code. The hydrodynamical portion is evolved until the next hydro time, t ] dt , is greater than or equal to the next N-bodyhydro time, t hydro Nvbody ] dt , at which time the next evolution of the N-body Nvbody distribution is performed. The N-body particles are then regridded onto the hydrogrid (° 3.4) supplying a smoothed dark matter density Ðeld from which the gravitational potential is calculated. We solve PoissonÏs equation using a Dynamic Alternating Direct Implicit (DADI ; Hewett, Larson, & Doss 1992) method supplied with ZEUS-3D (version 3.2). The resulting potential is used as a source term in solving the gas momentum equations. Originally intended to solve PoissonÏs equation for self-gravitating gas, the routineÏs relationship to ZEUS-3D has been modiÐed for our purposes. 3.
INITIAL CONDITIONS
3.1. A Brief Overview of the Simulations To summarize our approach, we model clusters of gal-
/o ) D 3.6. See Fig. 2. max min
axies as consisting of two components : a collisional gas component and a collisionless dark matter component. The gas component is modeled as a Ñuid using the Eulerian, Ðnite-di†erence code, ZEUS-3D, while the dark matter component is modeled using the N-body particle code, TREECODE (Hernquist 1987). Both components are distributed in a manner consistent with a lowered isothermal King model (° 3.2). The dark matter component is initially isotropic and virialized, while the gas component is initially in hydrostatic equilibrium within the gravitational potential which is deÐned entirely by the dark matter distribution (i.e., the gas is not self-gravitating). We do not include radiative cooling in these simulations, although we have done so in one previous simulation (Burns et al. 1994b). The radiative cooling calculation signiÐcantly increases the required CPU time. Since we ignore radiative cooling, the baryon content is constrained such that cooling times are long compared to the simulation time. In addition, the baryonic content of the clusters is chosen so as to be dynamically insigniÐcant. Consistency with observations is allowed within both of these con-
312
ROETTIGER, LOKEN, & BURNS
Vol. 109
a) -0.25 Gyrs
b) 0.0 Gyrs
c) 0.5 Gyrs
d) 1.0 Gyrs
e) 2.0 Gyrs
f) 5.0 Gyrs
FIG. 5.ÈGas density contours, 1 : 1 mass ratio merger, log (o
straints, although the gas content of the simulated clusters is at the low end of the observational range (¹7% baryons by mass). The two clusters are placed side-by-side on the computational grid, and they are allowed to merge head-on under the inÑuence of their mutual gravity. We believe this to be consistent with the lack of angular momentum observed on large scales (Ho†man 1986) and with large-scale structure simulations which indicate that mergers generally occur along Ðlaments. We have also ignored cosmological expansion in these simulations. Since we begin with preformed clusters, they necessarily represent signiÐcant local overdensities with respect to the mean density in the universe, and as such, cosmological expansion within the computational volume is minimal. 3.2. Isothermal King Models : T he Dark Matter Distribution We have chosen to model our clusters as isothermal King spheres (King 1996). Originally designed to model selfgravitating clusters of stars, observational evidence suggests
/o ) D 3.6. See Fig. 2. max min
that clusters of galaxies can be approximated by these models (e.g., Jones & Forman 1984). SpeciÐcally, we have chosen the ““ lowered isothermal models ÏÏ discussed by Binney & Tremaine (1987, ° 4.4.3c). These models resemble an isothermal model at small radii while becoming less dense than an isothermal model at large radii. It is this property that allows us to model clusters with nondivergent masses. The lowered isothermal King models are parameterized by the core radius, r , and the concentration parameter, c \ log (r /r ), where rc is the tidal radius deÐned c \ 0. Together t as the radius wheret o(r) these parameters deÐne the size of the cluster and the radial slope of the density distribution. In each of the simulations discussed here, the concentration was chosen to be 1.08 for both the primary and the subcluster. This corresponds to a D [2.9 near the half-mass radius (r D 2.1r ), where a isdmthe c dm power-law index of the density distribution. Our choice of the lowered isothermal model has implications for the distribution of the dark matter relative to the gas. These will be discussed in ° 3.3.
No. 2, 1997
MERGING CLUSTERS OF GALAXIES
FIG. 6.ÈGas velocity relative to the subcluster core velocity for the 4 : 1 mass ratio merger at 0.25 Gyr before core passage overlaid with the gas density contours. This Ðgure shows the reduction and redirection of Ñow about the subcluster core as a result of a shock that has formed at the cluster-subcluster interface. Density contours are 95%, 30%, 10%, and 3% of the peak. Velocity vectors are spaced by 66 kpc. The plotted region is 2 Mpc on a side. The longest vector corresponds to a velocity of D2000 km s~1.
3.3. T he Gas Distribution The clusterÏs gas component or ICM is initially isothermal and distributed in hydrostatic equilibrium within a gravitational potential deÐned entirely by the dark matter. Since the conditions for hydrostatic equilibrium determine only the temperature and shape of the gas distribution, the gas content of the cluster is a free parameter. Therefore, one can select any gas density with regard to two considerations. First, since we neglect the gravitational inÑuence of the gas component, the total gas mass should be dynamically insigniÐcant. Second, these simulations do not include radiative cooling which is a strong function of density. Consistency then requires that a central density be chosen such that the cooling time is long compared to the duration of the simulation. Observationally, core gas densities range from 10~4 to 10~2 cm~3 (Sarazin 1986). For the gas distributions in these clusters, a central density of less than 10~3 cm~3 simultaneously Ðts our criteria for low dynamical gas mass and long cooling times. Finally, since central densities are poorly, if at all, correlated with cluster mass (Edge & Stewart 1991, assuming temperature is correlated with mass), we have assigned the same central gas density to both the primary and subcluster. Figure 1 shows an example of the relative gas and dark matter density distributions. Note that the gas distribution is somewhat more extended than the dark matter. There is some observational evidence for this type of structure (Eyles et al. 1991). This is equivalent to saying that the global b parameter (Sarazin 1986) is less than unity. 3.4. T he Hydrodynamical Grid The clusters are placed next to each other on the compu-
313
tational grid such that their cores are separated by the sum of their respective tidal radii plus one primary cluster core radius or 250 kpc. The core separations range from 4.75 to 6.25 Mpc. The linear grid dimensions were chosen so as to just accommodate the two clusters involved in the merger. Perpendicular to the merger axis, the grid is 6.5 Mpc wide. The primary cluster has a radius of 3 Mpc. The linear dimension parallel to the merger axis varies from D10 to 13 Mpc, depending on the size of the subcluster. ZEUS-3D solves the equations of hydrodynamics on a Ðxed grid. We do, however, have the capability of spatially varying the grid resolution. This allows us to concentrate resolution in the regions of greatest interest and numerical sensitivity. Experience has shown us that it is the cluster core that su†ers the greatest disruption during the head-on mergers. It is also the brightest X-rayÈemitting region of the cluster and, therefore, the region of greatest observational signiÐcance. Often, the cluster X-ray data are limited to the inner few core radii or D0.5È1.0 Mpc. In terms of numerical sensitivity, the steep gas density gradient near the cluster cores and the violence of the merger in this region are the deÐning factors. For these reasons, we have concentrated our maximum resolution within a region extending the length of the grid parallel to the merger axis and 2 Mpc perpendicular to the merger axis. Our maximum resolution corresponds to 50 kpc or Ðve zones across the primary cluster core radius. Beyond 1 Mpc from the merger axis, the grid is ratioed, with zone dimensions perpendicular to the merger axis increasing by 14% from one zone to the next. The simulations range in size from 1.1 to 1.4 million zones. 4.
PARAMETER SPACE
In this study, we examine the e†ect of varying the relative dynamical mass of the clusters. Initial cluster parameters can be found in Table 1. Since the initial shape of the primary cluster gravitational potentials is always the same, varying the relative total mass will e†ectively vary the central dark matter density and ultimately the impact velocity. It will also e†ectively vary the relative sizes of the interacting clusters since the cluster radius scales as the cube root of the mass. Although these simulations are fully scaleable (see ° 4.1), we have assigned speciÐc masses to each cluster. In each simulation, the subcluster mass is 1 ] 1014 M , which corresponds roughly to a richness class 0 _ cluster. The primary cluster mass is then scaled upward with the desired mass ratio. The most massive primary cluster is 8 ] 1014 M , which is comparable to a rich ““ Coma-like ÏÏ cluster. _ 4.1. Rescaling the Simulations The simulations have been scaled to reasonable values for convenience when comparing with observational data. It is possible, however, to rescale the simulations in the following manner. If M and R are the desired mass and core radius of the primary cluster, and M@ and R@ are the corresponding values that appear in Table 1, then the gas temperatures scale as
A B
T \T @ velocities then scale as
M R@ , M@ R
A B
V \V @
M R@ 1@2 , M@ R
(2)
(3)
a) -0.25 Gyrs
b) 0.0 Gyrs
c) 0.5 Gyrs
d) 1.0 Gyrs
e) 2.0 Gyrs
f) 5.0 Gyrs
FIG. 7.ÈShaded contours of a slice in gas temperature taken along the merger axis through the cluster cores in the 8 : 1 mass ratio merger. Times listed above each panel are relative to the time core passage. The contours are constant from one panel to the next and uniformly spaced between T \ 1.1 and 26.7 keV. Black represents low temperature. White represents high temperatures. The region displayed is the same as in Figs. 2È5.
TABLE 1 INITIAL CLUSTER PARAMETERS TOTAL MASS (1014 M ) _
r c (kpc)
PARTICLE NUMBER
T (keV)
p v (km s~1)
P (1)
S (2)
P (3)
S (4)
P (5)
S (6)
M gas M total (7)
t dyn t (8 : 1) dyn(8)
v impact (km s~1) (9)
P (10)
S (11)
P (12)
S (13)
8.0 4.0 2.0 1.0
1.0 1.0 1.0 1.0
18000 18000 15000 10000
2250 4500 7500 10000
250 250 250 250
125 157 200 250
0.02 0.04 0.07 0.07
1.0 1.4 2.0 2.8
3394 2550 1920 1484
9.28 4.64 2.31 1.16
2.32 1.84 1.46 1.16
930 660 465 330
465 415 370 330
NOTE.ÈCols. (1) and (2) contain the primary (P) and subcluster (S) dynamical masses, cols. (3) and (4) list the number of dark matter particles, cols. (5) and (6) contain the core radii of both systems, col. (7) is the global mass fraction in gas of both systems, col. (8) is the dynamical timescale of the system normalized to the dynamical time of the 8 : 1 mass ratio merger, col. (9) is the impact velocity (mean relative dark matter velocity at core passage), cols. (10) and (11) contain the initial gas temperatures, and cols. (12) and (13) are the dark matter velocity dispersion.
MERGING CLUSTERS OF GALAXIES
315
a) -0.25 Gyrs
b) 0.0 Gyrs
c) 0.5 Gyrs
d) 1.0 Gyrs
e) 2.0 Gyrs
f) 5.0 Gyrs
FIG. 8.ÈGas temperature contours, 4 : 1 mass ratio merger. Contours are uniform between T \ 0.6È12.7 keV. See Fig. 7.
and time scales as t \ t@
A B
R M R@ ~1@2 , R@ M@ R
(4)
where T , V , and t are the newly rescaled temperature, velocity and time, respectively, and primed quantities are those determined under the original scaling. It should be noted that it is only possible to rescale an entire simulation. The relative cluster properties are Ðxed. 5.
RESULTS AND DISCUSSION
5.1. T he N-Body/Dark Matter Evolution The evolution of the N-body particle distributions represents that of a simple head-on collision of two King model spheres (i.e., gas does not inÑuence the dynamics of the particles). As such, the evolution of the dark matter in these simulations is, qualitatively, very similar to the high-mass ratio mergers discussed by Hernquist & Quinn (1987), and the lower mass ratio mergers are quite similar to those dis-
cussed by White (1972). Since the evolution of these systems is discussed in detail elsewhere, we will limit ourselves to a brief overview. We then focus on aspects of the dark matter evolution that will inÑuence the evolution of the gas distribution. Regarding the evolution of the gas distribution, the two most important aspects of the dark matter evolution are the rapid Ñuctuation of the gravitational potential minimum during core passage and the sustained velocity anisotropy in the particle distribution. As the subcluster passes through the primary core, the gravitational potential rapidly deepens. This is followed by an equally rapid return to near premerger depths as the bulk of the subcluster exits the primary. The e†ect of this rapid variation on the gas temperature and dynamics will be discussed in ° 5.3 and ° 5.4. We also Ðnd that subcluster particles remain on largely radial orbits parallel to the merger axis for a signiÐcant period of time. The result is a sustained velocity anisotropy which maintains an elongated dark matter distribution. This is consistent with the numerical results of van Haarlem
316
ROETTIGER, LOKEN, & BURNS
Vol. 109
a) -0.25 Gyrs
b) 0.0 Gyrs
c) 0.5 Gyrs
d) 1.0 Gyrs
e) 2.0 Gyrs
f) 5.0 Gyrs
FIG. 9.ÈGas temperature contours, 2 : 1 mass ratio merger. Contours are uniform between T \ 0.5È8.4 keV. See Fig. 7.
& van de Weygaert (1993), whose cosmological simulations show cluster elongations to be aligned with the axis of their most recent merger. The sustained elongation of the dark matter distribution would seem to indicate that although cluster elongation (i.e., elongation in the gas or galaxy distribution) may be a signature of merger activity, it is not a sensitive indicator of recent merger activity. 5.2. Gas Morphology In this section, we discuss the evolution of the gas distribution during the merger. Figures 2È5 show contours of gas density in a slice taken parallel to the merger axis through both cluster cores at six epochs ([0.25, 0.0, 0.5, 1.0, 2.5, and 5.0, Gyr) relative to the time of core passage. In each case, the subcluster entered from the top of the panel. In the Ðrst panel of each of Figures 2È5 (t \ [0.25 Gyr), we see that the leading edge of the subcluster is compressed and swept back upstream as gas is stripped from the subcluster. The basic morphology is very similar to that observed in A2256 (Briel et al. 1991) which is reported to be
in a comparable merger state (Roettiger et al. 1995). A similar situation exists for all mass ratios, although the radius of curvature of the bow shock increases as the mass ratio decreases implying a more efficient stripping of the subcluster gas in the higher mass ratio mergers. Several factors contribute to this situation. In the higher mass ratio mergers, the subcluster has a higher velocity, a smaller core radius, much lower thermal pressure, and lower gravitational binding energy when compared to the primary than in the low-mass ratio mergers. Consequently, stripping will begin sooner and at smaller radii resulting in a smaller radius of curvature. Gas stripping and the role of the bow shock will be discussed further in ° 5.2.1. As the merger proceeds, the cores coalesce creating a centrally concentrated gas distribution slightly elongated perpendicular to the merger axis (Figs. 2È5, t \ 0.0 Gyr). This distribution mimics that of the dark matter which also reaches maximum concentration at this epoch. After core passage, an extension of gas emerges downstream from the primary core. In order to determine the origin of gas in the
No. 2, 1997
MERGING CLUSTERS OF GALAXIES
317
a) -0.25 Gyrs
b) 0.0 Gyrs
c) 0.5 Gyrs
d) 1.0 Gyrs
e) 2.0 Gyrs
f) 5.0 Gyrs
FIG. 10.ÈGas temperature contours, 1 : 1 mass ratio merger. Contours are uniform between T \ 0.3È5.8 keV. See Fig. 7.
extension, we reran the 4 : 1 mass ratio merger with the inclusion of a passive-scalar Ðeld (or dynamically neutral quantity), ', in order to trace the subcluster gas. This is accomplished by setting ' equal to 1 in the subcluster and 0 elsewhere and then solving the continuity equation for the new variable ' along with the usual gas equations. Thereby ' is evolved in the velocity Ðeld of the subcluster. As the subcluster gas mixes with gas from the primary, regions of 0 \ ' \ 1 develop. The central region of the downstream extension was found to be composed of subcluster gas, while the outer edges are composed largely of gas swept up from the primary cluster. During the early stages after the merger, the morphology of the central region changes dramatically. In the high-mass ratio mergers (8 : 1 and 4 : 1), the central region is elongated perpendicular to the merger. This morphology, after 1 or 2 Gyr, eventually gives way to elongation parallel to the merger axis. The elongation perpendicular to the merger axis is seen to be a ring of compressed gas that forms as the relatively small subcluster penetrates the primary core while pushing primary cluster gas to the side. The ring is seen
perpendicular to the merger axis and so appears as two symmetric peaks on opposing sides of the primary core in Figure 2c. A similar feature is evident at 1.0 Gyr in the 4 : 1 mass ratio merger (Fig. 3d). The ring structure is seen to be nearly collapsed by 1.0 Gyr in the 8 : 1 case and has completely collapsed by 2.0 Gyr in both the 8 : 1 and 4 : 1 mergers. Owing to the more nearly matched core sizes, the ring structure is not seen in the lower mass ratio mergers. In these cases, the core proceeds immediately to an extreme elongation parallel to the merger axis. Observationally, the ring structure might appear as a bar in the X-ray emission when viewed perpendicular to the merger axis. A similar feature is noted in recent ROSAT images of A754 (Henry & Briel 1995). In the case of the higher mass ratio mergers, the downstream extension continues to grow. However, since the gas is largely unconÐned (the gravitational potential has been tidally disrupted), it expands and cools adiabatically (see ° 5.3.1). Eventually, it reaches turnaround and falls back into the primary being heated as it nears the core. However, before the extension can completely recede, the outward
318
ROETTIGER, LOKEN, & BURNS
Vol. 109
a) -0.25 Gyrs
b) 0.0 Gyrs
c) 0.5 Gyrs
d) 1.0 Gyrs
e) 2.0 Gyrs
f) 5.0 Gyrs
FIG. 11.ÈContours of a slice in Mach number taken along the merger axis through the cluster cores in the 8 : 1 mass ratio merger. Times listed above each panel are relative to the time of core passage. Contours are constant from one panel to the next and uniformly spaced between 0 and 2.7. The Mach number is indicative of the gas dynamics, with strong gradients revealing shocks in the ICM.
streaming velocity support is lost, and it is crushed laterally. Unfortunately, the low-mass ratio mergers were not evolved to a comparable stage of their evolution. The Ðnal feature that we draw attention to is the evacuated region left behind when the subcluster Ðrst enters the primary. The inward streaming of relatively low density gas produces Kelvin-Helmholtz instabilities at the interface with the denser primary cluster gas. These instabilities are apparent in Figure 2e (t \ 2.0 Gyr) as curled features above the primary core. Eventually, the evacuated region collapses resulting in a ““ splash.ÏÏ The splash is most apparent as the mushroom-shaped feature above the core in Figure 3f at 5 Gyr. These features are all very low density and therefore not observationally signiÐcant at this time. 5.2.1. Gas Stripping
Does the subcluster gas penetrate the core of the primary cluster ? From the passive-scalar analysis (° 5.2), it appears that a signiÐcant amount of subcluster gas does make it
through the core of the primary cluster. This is somewhat surprising in light of the analytical analysis performed by Fabian & Daines (1991) which indicated that the subcluster would be completely stripped before core passage. The difference is that the Fabian & Daines analysis pertained only to a mildly transonic infall, v D p , in which shocks do not form. They argue that shocks arev not important in cluster mergers (at least in A2256) and will form only if (1) the ram pressure (ov2) is greater than the thermal pressure of the gas and (2) if the rate at which the ram pressure increases is faster than the rate at which a pressure wave can propagate across the subcluster which is equivalent to the condition that dP /(dP /dt) is greater than the subcluster sound crossingramtime. ram In our simulations, the subclusterÏs infall velocity exceeds the speed of sound, a bow shock does form, and the conditions outlined by Fabian & Daines for shock formation are met. The Ðrst condition, which is also the condition for stripping the subcluster gas, simply requires that the infall veloc-
No. 2, 1997
MERGING CLUSTERS OF GALAXIES
319
a) -0.25 Gyrs
b) 0.0 Gyrs
c) 0.5 Gyrs
d) 1.0 Gyrs
e) 2.0 Gyrs
f) 5.0 Gyrs
FIG. 12.ÈMach number contours. 4 : 1 mass ratio merger. Contours are uniformly spaced between M \ 0.0È2.7. See Fig. 11.
ity be on the order of the velocity dispersion. Examination of the values in Table 1 show the infall velocities (at core passage) to be well in excess of the velocity dispersion. In each merger, the infall velocity is greater than 2 times the sound speed in the primary cluster which in these simulations is somewhat larger than, but on the order of, the velocity dispersion. The second condition is met shortly before core passage. During this time, the subcluster gas is being decelerated, but the density at the cluster-subcluster interface is rapidly increasing as the cores near one another. As a result, a bow shock forms on the leading edge of the subcluster. The exact epoch and location at which the shock forms is a function of the density proÐle and the infall velocity. Since the higher mass ratio mergers have greater infall velocities, the shock forms at greater distances from the primary core. It is reasonable to expect that our relatively steep density proÐles enhance the formation of a bow shock during the merger. The role of the bow shock is to inhibit the ram-pressure stripping of the subcluster gas. The shock forms an oblique
boundary layer which e†ectively reduces ram pressure by slowing the gas Ñow and redirecting it around the subcluster core (e.g., Fig. 4.4 of Shore 1992). In the case of a strong shock the velocity is reduced by a factor of 4, the density increases by a factor of 4, and thus the ram pressure experienced by the subcluster is reduced by as much as a factor of 4. The reduction and redirection of the Ñow is graphically demonstrated in Figure 6 where we have plotted the gas density contours overlaid onto the gas velocity vectors in the rest frame of the subcluster. The epoch depicted is shortly after the formation of the shock in the 4 : 1 mass ratio merger. 5.3. Gas T emperature Before discussing the gas temperature evolution, it should be kept in mind that potentially important physical processes have not been included in the simulations. For example, we have not included radiative cooling or thermal conduction. In both instances, the additional computational load can be prohibitive.
320
ROETTIGER, LOKEN, & BURNS
Vol. 109
a) -0.25 Gyrs
b) 0.0 Gyrs
c) 0.5 Gyrs
d) 1.0 Gyrs
e) 2.0 Gyrs
f) 5.0 Gyrs
FIG. 13.ÈMach number contours. 2 : 1 mass ratio merger. Contours are uniformly spaced between M \ 0.0È2.0. See Fig. 11.
Regarding radiative cooling, the initial gas densities were chosen such that the e†ect of cooling would be minimized. We have examined the evolution of the gas cooling time throughout the merger. Only brieÑy do we Ðnd cooling times less than a Hubble time (10È20 Gyr), and these are in relatively shortlived features such as shocks where adiabatic heating is important. In a previous simulation within comparable parameter space (Burns et al. 1994b), we included radiative cooling, and the results are quantitatively very similar to those presented here. Likewise, Schindler & Muller (1993) included radiative cooling and also produced similar results. Therefore, we argue that for our set of parameters radiative cooling is not important. Of course, this is not to say that cooling should not be considered or that it is not important in a large volume of parameter space. We are currently involved in a study of cooling Ñow evolution in the merger environment (Gomez et al. 1996). As for thermal conduction, there ae several reasons for not including it in these simulations. Two considerations are the computational difficulty and the computational
load. Another reason, and potentially the most important, is our nearly complete lack of knowledge regarding thermal conduction in clusters of galaxies. If thermal conduction in clusters of galaxies is characterized by the Spitzer (1962) conductivity coefficient, it has been argued that temperature inhomogeneities should be erased on relatively short time scales (Sarazin 1986). Fabian, Nulsen, & Canizares (1991) argue that in order for cooling Ñows (see Fabian 1994 for a review) to form, the thermal conductivity in the cluster core must be less than 1% of the Spitzer value. Often, tangled magnetic Ðelds are invoked to suppress thermal conduction (Borkowski, Balbus, & Fristrom 1990). It is believed that the free electrons become trapped in the Ðeld, thus reducing conductivity. On the other hand, Tribble (1989) has shown that thermal conduction can occur freely along tangled magnetic Ðeld lines, although the nature of the Ðeld does contribute to temperature inhomogeneities on small spatial scales. To further confuse the situation, David, Hughes, & Tucker (1992) argue that substantial thermal conduction (i.e., the Spitzer value) does not suppress cooling Ñow for-
No. 2, 1997
MERGING CLUSTERS OF GALAXIES
321
a) -0.25 Gyrs
b) 0.0 Gyrs
c) 0.5 Gyrs
d) 1.0 Gyrs
e) 2.0 Gyrs
f) 5.0 Gyrs
FIG. 14.ÈMach number contours. 1 : 1 mass ratio merger. Contours are uniformly spaced between M \ 0.0È2.0. See Fig. 11.
mation but rather drives it. In any case, the thermal conductivity in clusters of galaxies is uncertain by at least two orders of magnitude, and given the level of uncertainty in the subject at this time, we feel it does not warrant inclusion in these simulations. Having mentioned these caveats, we continue with a description of the temperature evolution in the merger environment. 5.3.1. Gas T emperature Morphology We began the simulations with two isothermal clusters. A listing of initial temperatures can be found in Table 1. Although we began with isothermal clusters, the postmerger clusters are certainly not isothermal. Figures 7È10 show the temperature evolution of the ICM within a slice taken along the merger axis through the cores of both clusters. The linear scale and epoch of these gray-scale images are identical to those in the gas density contours of Figures 2È5. As with the density contour images, the subcluster enters from the top of each frame. Complementary to the temperature slices are the Mach number slices in Figures 11È14. The
Mach number slices are useful as a measure of the internal gasdynamics such as shocks and turbulence. Shocks are recognizable as strong gradients in Mach number. Even a causal comparison of Figures 7È10 and Figures 11È14 reveals a strong correlation between gas temperature and gasdynamics. It is for this reason that detailed temperature maps such as those generated from ROSAT data for A2256 (Briel & Henry 1994) and A754 (Henry & Briel 1995) are invaluable diagnostics of internal cluster dynamics and substructure. Soon ASCA and AXAF will be producing high spatial resolution temperature maps like those for Perseus (Arnaud et al. 1994) and A2163 (Markevitch et al. 1994). In each merger, the subcluster falls in at supersonic speeds. The impact velocities can be seen in Table 1. On the leading edge of the subcluster, a bow shock forms, resulting in the heating of a thin layer of gas which tends to broaden as the cores interact. The peak Mach number at core passage, as a function of mass ratio are 2.6, 2.4, 2.0, and 1.7 for the 8 : 1, 4 : 1, 2 : 1, and 1 : 1 mass ratios, respectively. After core passage, the bow shock continues to propagate down-
322
ROETTIGER, LOKEN, & BURNS
10
(a) Temperature (keV)
Temperature (keV)
6
Vol. 109
4
2
(b)
8 6 4 2
0 -1
0
1
2 3 Time (Gyrs)
4
5
6
0
1
2 3 Time (Gyrs)
4
5
25
(c) Temperature (keV)
Temperature (keV)
15
0 -1
10
5
6
(d)
20 15 10 5
0 -1
0
1
2 3 Time (Gyrs)
4
5
6
0 -1
0
1
2 3 Time (Gyrs)
4
5
6
FIG. 15.ÈThe evolution of bulk gas temperature characteristics. Included are the mean (diamonds), the emissivity-weighted mean (asterisk), the minimum (square), and the maximum temperature (triangle) within 1 Mpc of the dark matter density peak for each of six epochs during each merger. Times are relative to the time of core passage. The dashed line represents the initial primary cluster temperature. (a) 1 : 1 mass ratio, (b) 2 : 1 mass ratio, (c) 4 : 1 mass ratio, (d) 8 : 1 mass ratio.
stream. This is apparent in Figures 7È10 as an arc of heated gas below the cluster core and as a similar arc of closely spaced contours in Mach number, Figures 11È14. Behind the bow shock, we see the subcluster remnant expand and adiabatically cool. This is most apparent in the 8 : 1 mass ratio merger, Figure 7d. Here the subcluster remnant is seen as a nearly circular region of cool gas just below the hot core at 1.0 Gyr. The region is seen to be somewhat larger, cooler, and closer to the bottom of the panel at 2.0 Gyr. During this time, both temperature and density decrease such that T /o(c~1) \ constant, indicating that adiabatic cooling is responsible. This e†ect is most dramatic in the higher mass ratio mergers where the subcluster gravitational potential is more thoroughly disrupted and is unable to conÐne the remaining subcluster gas. Eventually, the cool gas reaches turnaround, falls back toward the core, where it is heated as it interacts with other gas. As described in ° 5.1, the gravitational potential quickly reaches an extreme minimum as the cores become coincident. This causes a signiÐcant amount of gas to Ñow inward. As the subcluster dark matter exits the primary, the
gravitational potential rapidly returns to its premerger depth, expelling much of the gas that was drawn in during the merger. The gas expelled in the upstream direction collides head-on with residual infall from the merging subcluster, forming a shock that propagates upstream from the primary clusterÏs core. The opposing shocks are particularly apparent as two facing C-shaped structures in both the 1 : 1 and 2 : 1 mass ratio temperature (Figs. 9, 10cÈ10e) and Mach number contours (Fig. 13, 14cÈ14e). In three-dimensions, these shocks are conical structures. Similar features are also present, but only for a short time, in the 4 : 1 mass ratio merger. The upstream shock does not appear to form in the 8 : 1 mass ratio merger. In the higher mass ratio mergers, the perturbation to the primary potential is smaller relative to the total potential and is of a shorter duration. Consequently, gas has less time to respond to the changing potential, reducing the infall and subsequent outÑow. Also, the residual infall from the subcluster is less in the higher mass ratio mergers, and since the primary is hotter, a higher velocity Ñow is required to form a shock. Comparable temperature features have been iden-
No. 2, 1997
MERGING CLUSTERS OF GALAXIES
8
(a)
4
Temperature (keV)
Temperature (keV)
5
3 2 1 0
(b)
6
4
2 0
0
200
400 600 Radius (kpc)
800
15
1000
0
10
5
200
400 600 Radius (kpc)
800
25
(c) Temperature (keV)
Temperature (keV)
323
1000
(d)
20 Initial -0.25 Gyrs 0.0 Gyrs 0.5 Gyrs 1.0 Gyrs 2.0 Gyrs 5.0 Gyrs
15 10 5
0
0 0
200
400 600 Radius (kpc)
800
1000
0
200
400 600 Radius (kpc)
800
1000
FIG. 16.ÈThe evolution of the gas temperature proÐles. The gas temperature was azimuthally averaged within spherical shells, dr \ 50 kpc. The center of the proÐle is located at the peak of the dark matter density proÐle. The initial isothermal temperature of the primary cluster is indicated by the diamonds. (a) 1 : 1 mass ratio, (b) 2 : 1 mass ratio, (c) 4 : 1 mass ratio, (d) 8 : 1 mass ratio. The various epochs are indicated in the legend.
tiÐed in A2256 (Briel & Henry 1994) and, based on this analysis, have been tentatively linked to a recent merger event (Roettiger et al. 1995). In addition to A2256, ““ patchy ÏÏ temperature distributions similar to those in the merger simulations have also been identiÐed in A754 (Henry & Briel 1995), A2163 (Markevitch et al. 1994), and Perseus (Arnaud et al. 1994). A2256, A754, and Perseus all show temperature variations of several keV on less than 0.5 Mpc scales. Two regions of gas separated by D0.5h~1 Mpc have been identiÐed in 75 than 6 keV. Neither the very A2163 that di†er by greater hot ([13 keV) region nor the cool (\7 keV) region is coincident with the X-ray core. A2163 has been the subject of a gravitational lensing experiment that indicates the gas distribution may not be in hydrostatic equilibrium with the gravitational potential (Miralda-Escude & Babul 1994). It has also been shown to have a radio halo (Herbig & Birkinshaw 1994). Cluster radio halos are a cluster-wide phenomenon which have been linked to cluster mergers (Ja†e 1992 ; Tribble 1993 ; Burns et al. 1994b). 5.3.2. Bulk Gas T emperature Characteristics
The bulk temperature properties of the postmerger clusters are interesting in that they are most directly comparable to current cluster observations. Although ASCA promises to improve the situation, reliable temperature estimats of the ICM are typically very difficult to come by. Large numbers of photons are needed to obtain reliable
estimates necessarily limiting them to extended regions about the cluster core. Here we examine the bulk temperature properties within a sphere, R \ 1 Mpc, centered on the gravitational potential minimum of the system. Figures 15aÈ15d show the evolution of the temperature properties within the 1 Mpc sphere. Shown in these plots is the mean temperature, the mean emissivity-weighted temperature, the minimum temperature, and the maximum temperature. The initial primary cluster temperature is indicated by a dashed line. The mean temperature values are presented with 1 p ““ error bars ÏÏ which represent the zoneby-zone dispersion about the mean. This is a measure of the inhomogeneity of the temperature distribution ; p \ 0 T implies strict isothermality. The X-ray emissivity-weighted temperature, the actual observed quantity, is calculated by weighting the temperature in each zone by the emissivity in that zone then dividing by the total emissivity of the sphere. The X-ray emissivity is calculated using the Raymond & Smith (1977) X-ray spectrum which includes both thermal bremsstrahlung and line emission. We have assumed a ROSAT -like bandpass of 0.5È2.0 keV. Figures 15aÈ15d show the behavior of the bulk temperature properties to be very similar from one merger to the next. As with other aspects of the merger, it is simply a matter of degree. Examination of the mean temperature shows it to be relatively Ñat with time. The largest fractional increase in the mean temperature is seen in the lowtemperature 1 : 1 mass ratio merger. The trend is to decrease
324
ROETTIGER, LOKEN, & BURNS 4000
Max. Gas Velocity R