time of Java programs. ... have a negative impact on the runtime performance of
programs, as it needs to be ..... A Java Expert Shell System for puzzle solving.
Object Co-location and Memory Reuse for Java Programs ZOE C.H. YU, FRANCIS C.M. LAU, and CHO-LI WANG The University of Hong Kong
We introduce a new memory management system, STEMA, which can improve the execution time of Java programs. STEMA detects prolific types on-the-fly and co-locates their objects in a special memory space which supports reuse of memory. We argue and show that memory reuse and co-location of prolific objects can result in improved cache locality, reduced memory fragmentation, reduced GC time, and faster object allocation. We evaluate STEMA using 16 benchmarks. Experimental results show that STEMA performs 2.7%, 4.0%, and 8.2% on average better than MarkSweep, CopyMS, and SemiSpace. Categories and Subject Descriptors: D.3.4 [Programming Languages]: Processors—Memory management (garbage collection); D.4.2 [Operating Systems]: Storage Management—Allocation/deallocation strategies General Terms: Experimentation, Languages, Measurement, Performance Additional Key Words and Phrases: Memory allocator, garbage collector, mutator, Java, object co-location, memory reuse
1. INTRODUCTION Java has been widely used on many systems ranging from high-end servers, PCs, to embedded systems and mobile handsets. Java’s success derives in large part from the success of the Java Virtual Machine (JVM) [Lindholm and Yellin 1999]. Among the outstanding functions of the JVM, automatic memory management, which manages dynamically allocated memory for the programmer, contributes significantly to the software engineering benefits and user-friendliness of Java. This function includes a garbage collection (GC) mechanism to detect no-longer-needed memory in the heap and reclaim them safely for future allocation. GC however can have a negative impact on the runtime performance of programs, as it needs to be triggered intermittently [Brecht et al. 2001]. Our first goal is to make the memory management function (and GC) work faster. It has been observed that there is a widening gap between processor speed and memory latency, the result of which is that the effect of hardware cache misses on the performance of a runtime system becomes increasingly significant [Sun Microsystems 2003]. Our second goal is to find a way to improve the cache locality of the executing program. Faster memory Authors’ address: Department of Computer Science, The University of Hong Kong, Pokfulam Road, Hong Kong; E-mail: {chyu, fcmlau, clwang}@cs.hku.hk. Permission to make digital/hard copy of all or part of this material without fee for personal or classroom use provided that the copies are not made or distributed for profit or commercial advantage, the ACM copyright/server notice, the title of the publication, and its date appear, and notice is given that copying is by permission of the ACM, Inc. To copy otherwise, to republish, to post on servers, or to redistribute to lists requires prior specific permission and/or a fee. c 2007 ACM 0000-0000/2007/0000-0001 $5.00
ACM Transactions on Architecture and Code Optimization, Vol. V, No. N, February 2007, Pages 1–35.
2
·
Zoe C.H. Yu et al.
management operations and improved cache locality combined is expected to lead to increased execution speeds of the application programs. A program will have a better time performance if it is provided with a large heap, because fewer GCs will be necessary. But a large heap cannot always be taken for granted, especially in view of the prolification of small-memory and multiprocessing platforms. For embedded systems and mobile handsets, the memory resource is constrained. For multiprogrammed systems, memory available for a program may fluctuate intensely because of the competition from concurrent computational processes [Yang et al. 2004]. Our third goal in the design of the memory management system is to enable programs to run efficiently with a small memory footprint—i.e., small heap size. Our strategies to achieve the above are embodied in a new memory management system called STEMA (Space-Time Efficient Memory Allocator) which aims to improve the total execution time of Java programs. Following the literature [Dijkstra et al. 1978], the total execution time of a program consists of the mutator time and the collector time. Mutator time is the actual time used to execute the user program. Times to carry out some memory management related operations such as object allocation and write barrier are included in the mutator time. Collector time (also known as GC time) is the time spent in detecting and reclaiming nolonger-needed heap memory. STEMA achieves better mutator cache locality and reduced memory fragmentation, which gives rise to shorter mutator and GC time. STEMA extends and improves the work of Shuf et al. [2002], who referred to frequently instantiated object types as prolific types and developed a type-based collector based on them. Their idea is to collect prolific type objects (or simply prolific objects) more frequently because these objects tend to have a shorter lifetime than other objects. They allocate these objects in a prolific region and other objects in a non-prolific region so that partial GC on only the prolific objects can be performed. By co-locating prolific objects that are connected by object references, and visiting these objects before other objects at GC times, they improve the collector cache locality. STEMA rides on the notion of prolific types to optimize its decisions on memory allocation and object co-location. It introduces reuse of memory blocks 1 for prolific objects, and allocates them in a reusable memory space (R-space), and the rest in a non-reusable memory space (NR-space). Co-location of prolific objects in the R-space happens in two different ways, which lead to improved mutator cache locality and reduced memory fragmentation: objects of the same prolific type are placed side-by-side in the same memory block; objects of different prolific types that are created at similar times are arranged to be close to each other in their respective memory blocks in the R-space. If all objects in a memory block are dead at some GC time, instead of returning the block to the free virtual memory resource pool of the JVM, STEMA retains the memory block in the heap; then by reusing 1A
memory block is a chunk of memory which is partitioned into a certain number of size-k memory cells; the size of a memory block is page aligned, i.e., a multiple of 4KB, for efficient address computation; a memory cell is a unit of allocation in a memory block; a size-k memory cell can be used to accommodate an object with size no larger than k bytes; the memory cells of the same memory block have the same size. ACM Transactions on Architecture and Code Optimization, Vol. V, No. N, February 2007.
Object Co-location and Memory Reuse for Java Programs
·
3
these retained blocks as soon as possible later on at allocation times, the memory allocation process is simplified, and the number of L1 cache misses induced by the new objects is reduced. Unlike the work of Shuf et al. where they perform partial GC on prolific objects more frequently and thus require the use of write barrier, STEMA applies GC to both the R-region and the NR-region at GC times. Thus, STEMA does not have any overhead due to write barrier and has a smaller minimum heap requirement. Moreover, STEMA identifies the prolificacy of types on-the-fly using a low-overhead online type sampling (OTS) mechanism. This dynamic prolific type information can be used immediately by STEMA for its allocation decisions. The information can also be recorded offline so that STEMA could make use of it in its future runs, thus avoiding the online sample overhead in these runs. With online identification of prolific types, STEMA does not require a profile run to collect prolific type information before an actual run of the program. We evaluate the performance of STEMA using the eight SPECjvm98 benchmarks [SPEC 1998], seven of the DaCapo benchmarks [DaCapo 2004], and the gcbench [Boehm 1997] benchmark. The experimental results show that STEMA outperforms the MarkSweep, CopyMS, and SemiSpace collectors included in the Jikes RVM over all the benchmarks by an average of 3.0%, 3.4%, and 28.8% for a small heap; 2.6%, 6.7%, and 9.0% for a medium heap; and 2.4%, 5.3%, and 2.1% for a large heap. We show that the performance improvement is due to better mutator time and reduced memory fragmentation in most of the executions. Compared with GenMS (a two-generational collector in the Jikes RVM), STEMA can run all benchmarks including those that cannot be run to completion in GenMS when given a small heap, and so STEMA may be a better choice for systems with tight memory provision. Nevertheless, we do not expect STEMA to outperform GenMS with a medium to large-size heap, because STEMA does not perform any partial GC as in GenMS which can handle short-lived objects well. The organization of the paper is as follows. Section 2 introduces prolific types and objects, and the method to identify them. Section 3 describes the properties of prolific objects. Section 4 discusses STEMA, and how reusing memory can improve the cache locality of memory references, reduce fragmentation, and speed up the execution of Java programs. Section 5 presents the implementation of STEMA in the Jikes RVM and the method used for performance evaluation. Section 6 presents the experimental results. Section 7 discusses related work. Finally, we conclude the paper and discuss possible future work. 2. ONLINE IDENTIFICATION OF PROLIFIC TYPES Prolific types can be identified with offline profiling or online profiling. Offline profiling simply counts the number of objects created in a program for each type. Shuf et al. use this method to identify prolific types. In their experiment, a type is regarded as prolific if its number of objects is larger than 1% of the program’s total number of objects of any type. Identifying prolific types offline has two problems. First, it needs an extra profile run of the program to collect the required information; second, methods such as Shuf et al. may miss some localized phenomena. Conversely, because the type count ACM Transactions on Architecture and Code Optimization, Vol. V, No. N, February 2007.
4
·
Zoe C.H. Yu et al. Executing Code
Profiling
Adaptive Sampling System
Detected Hot Types
Prolific Type Analysis
Online Profile: The prolificacy of types affects space allocation decisions for objects.
Prolific Type Designations
Offline Profile: Prolific type information of previous program runs is fed back to the system to influence allocation decisions.
Offline Repository
Fig. 1.
Architecture of the Online Type Sampling System
Sampling(size, type) 1 bytesAllocated ← bytesAllocated + size 2 if bytesAllocated > BY T ES ALLOCAT ED then 3 type.incrementCount(type.id) 4 bytesAllocated ← 0 Fig. 2.
Pseudocode for Sampling Prolific Types
is cumulative over the entire program execution, some sparingly allocated object types may be marked as prolific. STEMA determines type prolificacies on-the-fly (online), and takes into account also the size of each sampled object. Based on the finding that most prolific objects are small in size, STEMA skips those objects having a size larger than a certain threshold. Figure 1 shows the architecture and flow of STEMA’s online type sampling (OTS) mechanism. OTS extends the timer-driven sampling function in the adaptive optimizing compilation system [Arnold et al. 2000] of the Jikes RVM. OTS samples an allocating object for every BY T ES ALLOCAT ED bytes of allocation. The sampling interval, BY T ES ALLOCAT ED, can be specified statically or tuned dynamically. Figure 2 is the code fragment used for sampling object types. Each object type has a counter field for keeping track of its number of instances. Figure 3 outlines the procedure used to detect prolific types. The invocation of the Threshold-Reached method occurs at thread switch points (i.e., method prologues, method epilogues, and loop backedges). The “hotness” of each type is updated periodically to reflect the current degree of the type’s prolificacy. A type is marked as hot if the number of object instances of the type created is equal to or above a predefined threshold, SAM P LES REQU IRED, over a certain time interval.2 The type is marked as prolific if it is found to be hot in two or more time intervals. This prolific type information can be used immediately by STEMA to inform allocation and object co-location decisions. To minimize mis-identification of prolific types because of heat accumulation, STEMA decays the hotness of types continually (every 100 yield points) during program execution (Figure 4). Thus, a type whose object instantiations are evenly spread out over the entire course of execution may not be perceived as prolific. This 2 In
this work, we use the default sampling time interval of 20ms, and a buffer size of 10 samples (i.e., SAM P LES REQU IRED). ACM Transactions on Architecture and Code Optimization, Vol. V, No. N, February 2007.
Object Co-location and Memory Reuse for Java Programs
·
5
Threshold-Reached(recordedT ypes) 1 for each type in recordedT ypes do 2 if type.count > SAM P LES REQU IRED then 3 type.hotness ← type.hotness + 1 4 if type.hotness > T HRESHOLD then 5 type.isP rolif ic ← true 6 else 7 type.isP rolif ic ← f alse 8 type.count ← 0 Fig. 3.
Pseudocode for Determining the Prolificacy of Types
Decay-Hotness(recordedT ypes) 1 for each type in recordedT ypes do 2 type.hotness ← type.hotness × DECAY RAT E Fig. 4.
Decaying the Prolificacy of Types
helps separate out genuinely hot objects that are created in bursts. STEMA provides the user with an option to record the prolific types detected in an offline repository (implemented as a simple log file in our prototype). The user can use this offline profile to carry out various optimizations, but avoid the overhead of the online sampling. 3. PROPERTIES OF PROLIFIC OBJECTS A number of important properties of prolific objects provide optimization opportunities for the memory manager and the application programs. We have identified seven such properties, labeled P1 to P7 in the following, which are true of most prolific objects most of the time. The design of STEMA capitalizes on these properties. P1. Prolific objects are small in size. P2. Prolific objects die younger than non-prolific objects. P3. Prolific objects, whether they are of the same type or not, are created in bursts. P4. Prolific objects repeat similar allocation patterns throughout the program execution. P5. Prolific objects of the same type have similar lifetimes in a program if they are allocated at similar times. P6. Prolific objects, not necessarily of the same type, tend to die simultaneously if they are allocated at similar times. P7. Objects of the same type tend to be accessed together. P1 and P2 are due to [Shuf et al. 2002]. P3 through P7 are derived from our own experiments [Yu et al. 2006]. If P1 is not true, the system would easily run out of memory. P2 suggests that prolific objects have shorter lifetime than nonprolific objects. Because of the importance of P2, we conducted an experiment to confirm its truthfulness, where we used an instrumented version of the tracegeneration algorithm Merlin [Hertz et al. 2002] to generate perfect traces (using ACM Transactions on Architecture and Code Optimization, Vol. V, No. N, February 2007.
6
·
Zoe C.H. Yu et al. Table I.
Benchmark compress jess raytrace db javac mtrt jack antlr bloat fop hsqldb jython ps xalan gcbench
A modified Lempel-Ziv method (LZW) for data compression. A Java Expert Shell System for puzzle solving. A ray tracer which works on a scene depicting a dinosaur. Performs multiple database functions on memory resident database. The Java compiler from JDK 1.0.2. A multithreaded version of raytrace. A Java parser generator. A parser generator and translator generator. A Java bytecode optimizer for optimizing Java bytecode files. A Formatting Objects Processor for generating PDF from XSL-FO file. A SQL relational database engine for in-memory trasactions. An implementation of the Python language in Java. A postscript interpreter. An XSLT processor for transforming XML documents. An artifical garbage collector benchmark.
Table II.
Benchmark compress jess raytrace db javac mtrt jack antlr bloat fop hsqldb jython ps xalan gcbench
The Benchmarks Description
Average Lifetimes of Prolific, Non-Prolific, and Small Objects Average Lifetime (in bytes allocated) Prolific Objects Non-Prolific Objects Small Objects G.M. A.M. G.M. A.M. G.M. A.M. 14 3 12 5 24 11 15 4 37 7 48 5 65 9 20
410 3 76 13 149 109 119 18 74 29 179 77 88 88 57
22 33 42 11 60 22 12 23 39 27 24 34 24 25 31
16682 5772 7510 20060 244767 449 15312 13277 8260 10579 43838 22289 1673 11052 426
19 18 14 6 55 17 13 16 37 21 26 8 34 20 21
12607 4353 800 1599 222728 299 10316 10520 68722 8622 38158 5409 1095 9050 105
low trace granularity) of objects’ lifetimes for the first 64MB memory allocated for the benchmarks shown in Table I. Merlin works by computing backward in time to find when a garbage-collected object is last reachable (i.e., last used) so that the actual lifetime of an object can be obtained. Table II compares the average lifetimes of prolific objects, non-prolific objects, and small objects (objects which are smaller than 256KB in size). The “G.M.” and the “A.M.” columns of each object type category refer to the geometric mean and the arithmetic mean of objects’ average lifetimes respectively. Where the arithmetic mean is much larger than the geometric mean, it indicates that the object type category contains some very longlived objects. Thus, Table II reveals that there are more long-lived non-prolific objects than long-lived prolific objects, and that most longest-lived objects are non-prolific. Comparing prolific objects with small objects of any type, more small objects than prolific objects are long-lived. This means that we can filter out most long-lived objects by the prolificacy of types, but not by object sizes. ACM Transactions on Architecture and Code Optimization, Vol. V, No. N, February 2007.
Object Co-location and Memory Reuse for Java Programs 16384
262144
Byte Arrays (byte[])
·
7
Character Arrays (char[])
65536
4096
Number of Objects
Number of Objects
16384 1024 256 64 16
4096 1024 256 64 16
4
4
1
1 8
16
32 64 128 256 512 1024 2048 4096 8192 Object Size Buckets (in Bytes Allocated)
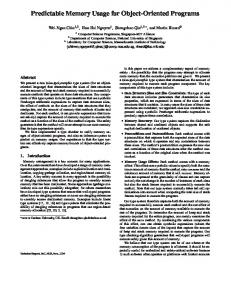
(a) Byte Arrays in hsqldb Fig. 5.
8
16
32 64 128 256 512 1024 2048 4096 8192 Object Size Buckets (in Bytes Allocated)
(b) Character Arrays in antlr
Size Distribution of Byte Arrays (Left) and Character Arrays (Right)
P3 states that prolific objects tend to be created in large numbers within a short period of time. If P2 is not true, P3 cannot be true either because then the demand of memory by the burst of requests would be far too great. To give an example of P4, suppose T1 and T2 are two prolific types; if the instances of these two types are created in the order of T1 , T2 , T2 , T1 , T2 , T2 and so on, it is likely that this or a similar instantiation pattern will repeat in the near future. P6 implies P5, but we single out prolific objects of the same type in P5 because they are much more likely than unrelated objects to die together, thus creating an opportunity for more memory blocks to be reused. P7 is true of all objects, prolific or not, because objects of the same type are usually related. We have also identified three additional properties which are specific to arrays and Java objects: SP1. Arrays having potentially many different sizes are not suitable for reuse. For example, character and byte arrays. SP2. Interned objects are not suitable for reuse. For example, objects of String type in the standard Java API. SP3. Objects of types in the Java Collections Framework such as Hashtable and Vector are not suitable for reuse. Character arrays and byte arrays have various sizes—for example, from 20 bytes or so to several kilobytes as illustrated in Figure 5. If they are allocated in the Rspace, they will present a hurdle to memory block reuse because very large objects are usually long-lived. String type objects in standard Java API are not suitable for reuse because String objects are immutable and interned in JVM (including the Jikes RVM). SP3 is true because object types belonging to the Java Collections Framework are more likely to be long-lived. For example, data structures such as Hashtable, HashSet, Vector and the like are usually used for a long period of time before they are discarded, because they support convenient and efficient management and manipulation of large amount of data. Table III shows the average lifetimes of character arrays, byte arrays, String objects, and objects of types belonging to the Java Collections Framework. When comparing these results with the corresponding lifetimes of prolific objects and non-prolific objects in Table II, these special objects ACM Transactions on Architecture and Code Optimization, Vol. V, No. N, February 2007.
8
·
Zoe C.H. Yu et al. Table III.
Benchmark compress jess raytrace db
javac
mtrt jack antlr bloat fop hsqldb
jython
ps xalan
Average Lifetimes of Objects of Different Types Average Lifetime (in bytes allocated) Object Class Name G.M. A.M. byte[] java.util.HashMap$HashEntry[] char[] java.lang.String java.lang.String char[] java.lang.String java.util.Vector java.lang.String java.util.Hashtable$HashEntry java.util.Hashtable$HashEntry[] java.lang.String java.lang.String java.util.Vector char[] java.lang.String java.lang.String java.util.HashMap$HashEntry[] java.util.ArrayList byte[] java.lang.String java.util.HashMap java.util.HashMap$HashEntry[] char[] java.lang.String java.util.HashMap$HashEntry[] java.lang.String java.util.Stack java.lang.String
15 496 15 31 6 16 33 829704 16 622 151 33 19 851 12619 39 29 464 17 13 36 91 141 24 92 1263044 18 119 27
6202 31158 60 2007 110 7265 198694 4227402 5350 1373917 310043 89 20055 31286 19087 23739 4743 93397 2359 116 137 855 110879 8511 46278 2921728 184 233 901
are as long-lived as non-prolific objects in many cases. Hence, we have SP2 and SP3. 4. SPACE-TIME EFFICIENT MEMORY ALLOCATOR (STEMA) STEMA performs the following actions in response to the properties of prolific objects identified in Section 3. A1. In response to P1, the check for prolificacy is skipped for large objects, and these objects are directly allocated in the large object space. A2. P2, together with P3 and P5, offers an opportunity for memory block reuse. STEMA thus retains the memory block vacated by objects of a certain prolific type at GC time and reuses the block as soon as possible for future objects of the type. A3. In response to P7, STEMA tries to co-locate prolific objects of the same type in the same memory block in the R-space. Because of P3 and P5, such co-location is possible. A4. Because of P4 and P6, memory blocks allocated at similar times to different prolific objects are placed side-by-side in the heap. ACM Transactions on Architecture and Code Optimization, Vol. V, No. N, February 2007.
Object Co-location and Memory Reuse for Java Programs
·
9
Request2 Allocation Request
Memory Allocator (Reusable Space)
Request1
Reuser
Retain
Request4 Allocation Request
Fig. 6.
Memory Allocator (Non−Reusable Space)
Request3
Garbage Collector
STEMA: Reuser, Memory Allocators, and Garbage Collector
A5. Because of SP1, STEMA would not allocate character arrays and byte arrays in the R-space. A6. By SP2 and SP3, STEMA would not allocate objects belonging to the Java Collections Framework in the R-space. The above actions speed up object instantiation, improve cache locality, and reduce fragmentation, and as a result, the total execution time of Java programs is shortened. Because of A2, coalescing memory blocks into the pool of free virtual memory resources maintained by the JVM is deferred until necessary. And by allocating the retained memory blocks as soon as possible, the header information of the memory blocks can be reused. Both of these lead to faster memory allocation as well as better L1 data cache locality. A3 helps improve the mutator L2 cache locality of Java programs, because objects of the same prolific type are likely to be accessed together; and the same is true of objects of different prolific types because of A4. Co-location of objects (A3 and A4 ) can reduce fragmentation; so can A5 and A6 because objects of many different sizes and lifetimes would not all cram together in the R-space. These actions thus lower the minimum space requirement of Java programs. 4.1 Architecture of STEMA STEMA consists of three components: two memory allocators, a garbage collector, and a reuser (Figure 6). The garbage collector detects memory blocks in the R-space containing only no-longer-needed prolific objects at GC times. The reuser retains some of these memory blocks in the R-space based on history (to be discussed in Section 4.3). The two memory allocators are for the R-space and the NR-space respectively. The R-space allocator first requests a memory block from the reuser (i.e., Request1 ) which can promptly allocate a memory block, if one is available, from the list of retained blocks. If none is available, the R-space allocator requests a new block from the pool of virtual memory resources maintained by the JVM (i.e., Request2 ), which takes longer time. On the other hand, the NR-space allocator requests a memory block from the JVM’s pool (i.e., Request3 ) first. If the pool has run out of memory, the reuser will transfer some unused retained blocks (if any) to the NR-space (i.e., Request4 ), thus avoiding premature invocation of GC and over retention of memory blocks in the heap. GC is triggered if the heap memory is exhausted. ACM Transactions on Architecture and Code Optimization, Vol. V, No. N, February 2007.
·
10
Zoe C.H. Yu et al.
Reusable Space
Non−Reusable Space
Large Object Space
Meta−data Space
Immortal Space
Boot Image Space
Hi
Lo
Fig. 7.
Heap Layout of STEMA in the Jikes RVM
4.2 Dynamic Allocation Targets Figure 7 shows the heap layout of STEMA. STEMA has six memory spaces: reusable space (R-space), non-reusable space (NR-space), large object space, metadata space, immortal space, and boot image space. To enable the reuse of memory blocks, prolific objects and non-prolific objects are allocated to the R-space and the NR-space respectively. Large or very large objects (i.e., of size greater than 8K bytes) are allocated to the large object space. The meta-data space, immortal space, and the boot image space are specific to the Jikes RVM and will not be garbage-collected. 4.3 Memory Block Reuse Policies In a garbage-collected system where stop-the-world GC is used, the mutator has to be suspended whenever GC is triggered. STEMA keeps track of the number of memory blocks allocated to each prolific type in each mutator phase. This information is used by the garbage collector to estimate the number of memory blocks to be retained for each type in the upcoming GC for future prolific object allocations. A memory block is retained by inserting it into a linked-list in lastin-first-out order instead of merging it into the JVM’s pool of virtual memory resources. It is reasonable to assume that the number of memory blocks allocated for each prolific type is more or less the same over two consecutive mutator phases. So the number of memory blocks retained for each prolific type is no more than the number allocated for each prolific type in the last mutator phase. A memory block can be retained for future reuse only if all the objects it contains are found to be dead at GC time. Retaining and reusing memory blocks reduce unnecessary coalescing and splitting of memory blocks at GC and memory allocation times. This helps speed up the process of memory allocation. Figure 8 shows the memory allocation routine of STEMA. At allocation time, when going through the fast path of the allocation sequence (allocF ast), if all memory cells of an active memory block for the type in question in the R-space are occupied, STEMA will obtain a memory block from the pool of retained blocks for allocation; if the pool is empty, a new memory block is obtained from the free memory pool—the slow path (allocSlow). Allocating a memory block from the pool of retained blocks (allocReuse, line 4 of the Alloc method for ALLOC REU SER) requires just a conditional check for the availability of the memory block in a linked-list; it does not require constructing a freelist of allocation entries from scratch, which simplifies the allocation process. 4.4 Object Co-location STEMA’s co-location strategy is divided into two courses of action. First, STEMA co-locates objects of the same prolific type in the same memory block residing ACM Transactions on Architecture and Code Optimization, Vol. V, No. N, February 2007.
Object Co-location and Memory Reuse for Java Programs
·
11
Alloc(size) 1 Address cell ← allocF ast(size) 2 if cell.isZero() then 3 return allocSlow(size) 4 else 5 return cell (a) Allocation Routine in the Non-Reusable Memory Space (ALLOC DEF AU LT ) Alloc(size, type) 1 Address cell ← allocF ast(size, type) 2 if cell.isZero() then 3 // Alloc memory block from the retained memory pool 4 cell ← allocReuse(size, type) 5 if cell.isZero() then 6 return allocSlow(size, type) 7 return cell (b) Allocation Routine in the Reusable Memory Space (ALLOC REU SER) Fig. 8.
Memory Block Allocation Routines in STEMA
in the R-space. This can improve the mutator cache locality of Java programs, because objects of the same type are usually connected directly or indirectly, and are likely to be accessed together during execution. Prolific objects being created at about the same time are likely to have a similar lifespan. If they would die at more or less the same time, the memory block they occupy can be conveniently retained and reused. As shown in Figure 8(b), STEMA checks the type of the object and allocates the object in the memory block dedicated to that prolific type at allocation time. Thus, objects of the same prolific type are placed together in the same memory block. Since prolific objects are created in bursts, prolific objects residing in the same memory block tend to have similar lifetimes, which leads to reduced fragmentation. Second, STEMA co-locates memory blocks for different prolific types in the Rspace. We have observed that object creation patterns involving multiple types tend to repeat. So if two memory blocks, each accommodating objects of a different prolific type, are sitting next to each other at the beginning of the program execution, there is a good chance that their adjacency will persist for much longer or until the end of program execution. Thus, retaining and reusing these memory blocks preserve the cache locality of these object types, because they are likely to be accessed together also. 4.5 Effects of Memory Block Reuse on Locality During GC, memory blocks that are suitable for retention are inserted into persize stack-like lists so that the “top” pointer of each list always points to the most recently retained blocks. To increase cache hits, STEMA preferentially allocates prolific objects to memory cells of the recently accessed blocks which are the latest blocks joining the retention pool in the R-space. This ensures that the prolific objects always try to fill the retained memory blocks in the retained block lists, which increases the chance that all prolific objects in the retained memory blocks ACM Transactions on Architecture and Code Optimization, Vol. V, No. N, February 2007.
12
·
Zoe C.H. Yu et al.
become dead together at GC time. This also avoids using memory blocks with only a few unused memory cells left; GC is likely to occur before these memory cells can be used. This has a number of advantages. First, it avoids inducing more cache misses which come with memory blocks that are not accessed for sometime. Second, it avoids mixing old objects with newly created objects, which reduces fragmentation. Each memory block in the R-space is homogeneous, meaning that the prolific objects in the same memory block have the same type and size. This can help improve the cache locality of programs, because these objects are likely to be accessed together. 4.6 Fragmentation Fragmentation occurs when the program has free memory which cannot be used because the memory available is partitioned into small pieces of which not a single one is large enough for an allocation request. Co-locating prolific objects at allocation time can help reduce fragmentation because of the similar lifetime property of prolific objects. Hence, we can retain and reuse the memory blocks allocated to these objects. If less memory is wasted due to fragmentation, fewer GCs will need to be triggered [Choi et al. 2005]. As a result, the GC time as well as the total execution time of a program would be improved. 4.7 Aggressive Transfer of Unused Memory Blocks To avoid premature GC invocations or out-of-memory errors due to excessive retention of memory blocks for prolific objects, STEMA can transfer unused retained memory blocks from the R-space to the NR-space. Normally, the NR-space allocator requests memory blocks via the slow path of the allocation sequence. If however the free memory from the slow path is exhausted, and there are unused retained memory blocks in the R-space, STEMA aggressively transfers all the unused retained memory blocks from the R-space to the NR-space. We decide to transfer all the retained memory blocks because when in this situation, very few prolific objects will be allocated in the remainder of a mutator phase. Releasing all the retained memory blocks in the R-space ensures that there is no unused, empty memory block in the heap before triggering a GC. 5. METHODOLOGY In this section, we describe the tools used to develop STEMA. We also present the methodology used to evaluate the system, the experimental platform, and the benchmarks used and their key characteristics. 5.1 Jikes RVM and Its Compilers We use IBM’s Jikes RVM v2.3.4 using GNU classpath 0.12 with CVS timestamp of “2004/12/24 14:20:40 UTC” [Alpern et al. 2000; Alpern et al. 2005] for implementing STEMA. The Jikes RVM is an open-source high-performance virtual machine written mostly in Java. It has a baseline compiler and an optimizing compiler, but no bytecode interpreter. The Jikes RVM generates machine code using its baseline compiler for any methods that are initially executed. With its adaptive optimization system [Arnold et al. 2000] enabled, the Jikes RVM compiles the frequently ACM Transactions on Architecture and Code Optimization, Vol. V, No. N, February 2007.
Object Co-location and Memory Reuse for Java Programs
·
13
executed methods using its optimizing compiler at an increased level of optimization based on the method samples it collects during runtime. We use the Fast configuration of the JIT compilation, which precompiles as much code as possible, with the key libraries and the optimizing compiler included, and the assertion checking turned off. This adaptive configuration uses timer-based sampling to select hot methods for recompilation and optimization in order to achieve high performance. However, this timer-based sampling introduces nondeterminism and thus a variation in the measured time performance when different sets of hot methods are recompiled and optimized in different runs of the same program [Eeckhout et al. 2003]. Therefore, we use the pseudo-adaptive compilation method [Sachindran and Moss 2003] to control the non-determinism of the adaptive compilation mechanism. We run each benchmark program five times, and collect the log of hot methods and their corresponding optimization levels in each run. For each program, we pick the log for which the program has the best execution time, and use it to decide on the compilation level at which to compile a method using the optimizing compiler in the evaluation runs of the program. OTS piggybacks on the timer-based sampling mechanism of the Jikes RVM. It suffers from the same non-determinism problem as the adaptive optimization system in the Jikes RVM. We use the same approach just mentioned to collect type prolificacy information for each benchmark program. This information is fed back to the system to advice which object types should be allocated in the R-space deterministically. In our evaluation runs, each benchmark program execution goes through two iterations. In the first iteration, the compiler optimizes the methods according to the optimization levels specified in the log file. At the same time, the Jikes RVM loads the type prolificacy information into the system to inform the allocation decisions. Before the second iteration of the program, GC is triggered to flush the compiler objects in the heap. We execute each program five times and report the average result. 5.2 Memory Allocators and Collectors STEMA is modified from the MarkSweep collector of the Memory Managment Toolkit (MMTk) [Blackburn et al. 2004] in the Jikes RVM. The MarkSweep collector has no concept of type prolificacy, and both prolific objects and non-prolific objects are allocated in the NR-space. When the heap is full, the MarkSweep collector triggers a GC. When that happens, the collector traces and marks lived objects starting from the roots (i.e., static variables and thread stacks) using bitmaps, and returns memory blocks containing only dead objects to the virtual memory resource pool. STEMA introduces a new R-space for accommodating prolific objects. STEMA does not return empty memory blocks belonging to the R-space to the virtual memory resource pool immediately at GC times, but retains a suitable amount of memory blocks for each prolific type in the heap, thus reducing the need to coalesce or split memory blocks in the virtual memory resource pool. The MarkSweep collector finds free memory cells in nonempty memory blocks lazily to construct freelists for object allocations. STEMA further defers the construction of such freelists by preferentially allocating prolific objects in the retained memory blocks. It finds free memory cells to construct ACM Transactions on Architecture and Code Optimization, Vol. V, No. N, February 2007.
14
·
Zoe C.H. Yu et al.
freelists for allocation only when the retained memory blocks are all used up. This actually helps improve the execution time of programs. Finally, the MarkSweep collector allocates objects of the same size in the same memory block, regardless of their types. STEMA co-locates prolific objects of the same type at allocation time, which leads to increased locality, less fragmentation, and improved performance of the executing programs. We also evaluate STEMA against two non-generational GC systems, SemiSpace and CopyMS, and a generational GC system, GenMS. SemiSpace uses two copying spaces. Objects are continuously allocated in one copying space by bumping a pointer, and the other space is reserved for copying lived objects at GC time. The two copying spaces are swapped after each collection. CopyMS is a hybrid version of the SemiSpace and the MarkSweep collector. CopyMS allocates objects in a copying space with a bump pointer allocator, and copies lived objects to a markand-sweep space when the heap is full. CopyMS does not require a copy reserved as in SemiSpace, and is thus more space efficient than SemiSpace. GenMS is an Appelstyle two-generation collector where the nursery space uses a copying collector, and the mature space (the older generation) uses a mark-and-sweep collector. GenMS requires a write barrier to record object references from the mature space to the nursery space. When the nursery is full, GenMS triggers a partial collection. If the partial collection cannot reclaim enough memory for object allocation, a full heap collection is invoked. 5.3 Experimental Platform We perform our experiments on an Intel Xeon 2.4GHz machine with user accessible performance counters and hyper-threading enabled. The machine has an 8KB 4way set associative L1 data cache with 64-byte lines, a 12Kµops trace cache, a 512KB 8-way set associative L2 unified cache with 128-byte lines, a data TLB with 64 fully associative entries, and 512KB main memory. It runs Redhat Linux 9.0 with kernel version 2.4.20-28.9 including SMP support. We use the processor’s performance counters to measure the numbers of instructions executed, retirement events, L1 data misses, L2 misses, as well as data TLB misses of the mutator and collector of STEMA. Due to hardware limitation, each event counter requires a separate run. We use the Linux/x86 performancemonitoring counters software package v2.6.4 (perfctr-2.6.4) and the associated kernel patch and libraries [Pettersson 2003] to access the event counters. 5.4 Benchmarks Table IV shows the benchmark programs we use and their characteristics. They are the SPECjvm98 benchmark suite, seven benchmarks of the DaCapo suite and gcbench. In Table IV, the “Total Alloc (MB)” column shows the total amount of memory allocated in megabytes for each benchmark program using STEMA with the adaptive optimization system enabled. The “R-space Alloc (MB)” column shows the amount of memory allocated in megabytes in the R-space of STEMA. The “R-space Alloc %” column indicates the percentage of total memory allocated in the R-space. The “alloc:min” column lists the ratio of the total amount of memory allocated to the minimum heap size of the program in execution using STEMA. This ratio reflects upon the GC load in a program. The “P-Type #” ACM Transactions on Architecture and Code Optimization, Vol. V, No. N, February 2007.
·
Object Co-location and Memory Reuse for Java Programs Table IV. The 16 Benchmarks and Their Characteristics Total Alloc alloc R-space Alloc R-space Alloc Benchmark (MB) :min (MB) % jess mtrt raytrace javac jack db mpegaudio compress bloat jython hsqldb ps xalan antlr fop gcbench
280.7 163.0 156.9 226.6 248.1 88.4 31.0 120.6 693.2 442.3 503.2 533.0 186.0 279.0 104.2 356.4
31:1 10:1 12:1 8:1 21:1 6:1 3:1 6:1 28:1 22:1 22:1 38:1 2:1 17:1 3:1 18:1
231.8 116.9 115.1 65.6 50.1 40.4 0.8 0.2 253.8 247.1 172.3 58.7 52.0 30.7 10.2 345.6
82.6 71.7 73.4 29.0 20.2 45.7 2.7 0.2 36.6 55.9 34.3 11.0 27.9 11.0 9.8 97.0
15
P-Type # 13 19 17 25 20 6 5 3 19 26 36 16 14 13 17 2
column shows the number of prolific types detected by OTS for each program. According to Table IV, we group the benchmark programs into different categories. jess, mtrt, raytrace, bloat, jython, hsqldb, and gcbench feature a large amount of prolific objects with a high ratio of total allocation to minimum survival heap size (i.e., high GC load). javac, jack, xalan, and fop are allocation intensive, but they have a relatively small GC load and a moderate percentage of memory allocated in the R-space. db has a relatively high percentage of memory allocated in the R-space, but has a relatively low GC load. ps and antlr have a high GC load, but a low memory reuse percentage. mpegaudio and compress both produce mainly non-prolific objects and are not GC intensive. Due to the page limit, we choose six benchmarks—compress, raytrace, db, hsqldb, jython, and gcbench—for detailed presentation in this paper, which belong to different benchmark suites and are of different application types. In particular, we include compress and db because of their unique and interesting behavior. A summary of the performance of the other benchmarks can be found in Section 6, Tables VI, VII, VIII and IX. Complete results are available in [Yu et al. 2006]. 6. EXPERIMENTAL EVALUATION In this section, we present the evaluation of STEMA. We first report the measured overheads of OTS, including that of the dynamic check for the type prolificacies at memory allocation time. We compare the performance of STEMA with the commonly used collectors. We also discuss the effect of being selective in identifying prolific types. We finally show that STEMA does reduce fragmentation as anticipated, which in turn results in fewer GCs and overall performance improvement. 6.1 Overheads of Online Profiling of Prolific Types To compute the overheads of OTS for detecting type prolificacies, we measure the time performance of the first iteration of the benchmark programs where the adaptive optimizing compiler is active on a moderate heap size (2 × minimum ACM Transactions on Architecture and Code Optimization, Vol. V, No. N, February 2007.
16
·
Zoe C.H. Yu et al. Table V.
Benchmark
Default
jess mtrt raytrace javac jack db mpegaudio compress bloat jython hsqldb ps xalan antlr fop gcbench
8.25s 7.84s 7.34s 12.04s 7.48s 18.64s 8.00s 8.28s 19.21s 16.86s 15.94s 19.10s 7.05s 26.35s 4.25s 4.15s
Overheads of Online Type Sampling (OTS) OTS (32K) OTS (64K) OTS (128K) Time Overhead Time Overhead Time Overhead
8.33s 8.00s 7.44s 12.25s 7.52s 18.96s 8.24s 8.41s 19.18s 17.04s 16.25s 19.74s 7.18s 26.51s 4.33s 4.29s
G.M.
-0.96% -2.00% -1.34% -1.71% -0.53% -1.69% -2.91% -1.55% 0.14% -1.06% -1.91% -3.24% -1.81% -0.60% -1.85% -3.26% -1.65%
8.28s 7.95s 7.30s 12.06s 7.45s 18.73s 7.92s 8.29s 19.23s 16.70s 15.74s 19.50s 7.15s 26.38s 4.29s 4.24s
-0.36% -1.38% 0.55% -0.17% 0.40% -0.48% 1.01% -0.12% -0.10% 0.96% 1.27% -2.05% -1.40% -0.11% -0.93% -2.12%
8.14s 7.81s 7.28s 12.01s 7.39s 18.66s 7.92s 8.39s 19.19s 16.73s 16.21s 19.30s 7.14s 26.26s 4.22s 4.21s
-0.32%
1.35% 0.38% 0.82% 0.25% 1.22% -0.11% 1.01% -1.31% 0.10% 0.78% -1.67% -1.04% -1.26% 0.34% 0.71% -1.43% 0.01%
heap requirement). For each benchmark program, we pick the fastest five runs and compute their average. The programs carry out the additional runtime work of OTS to sample the objects at creation time to determine the prolificacy of types, and to check for prolificacy at allocation time. They do not however allocate prolific objects in the R-space nor reuse any memory blocks occupied by prolific objects. Therefore, the experiment does only the work of prolific type detection. Table V compares the performance of the original system with the augmented system running OTS with sampling rates (i.e., BY T ES ALLOCAT ED) of 32K, 64K, and 128K bytes of memory allocated. From Table V, we see that OTS adds at most 3.26%, 2.12%, and 1.67% of runtime overhead to the system when the sampling rates of 32K, 64K, and 128K are used respectively. However, these overheads become insignificant when we compare them with those of the timer-based sampling which are much more dominant. In the remaining experiments, we use the sampling rate of 64K. 6.2 Total Execution Times From here onwards, we apply the pseudo-adaptive methodology when evaluating the performance of the benchmark programs—that is, we only report the application behavior, but not the compiler behavior. Tables VI and VII show the total execution times of the benchmarks with two small heap sizes (1 and 1.25 times of the minimum heap size). Tables VIII and IX show the average total execution times of the benchmarks over the medium heap range (1.75–2.25 times of the minimum heap size) and the large heap range (2.5–3 times of the minimum heap size). In these four tables, the “STEMA”, “MS”, “CMS”, “SS”, and “GenMS” columns are the total execution times of the benchmark programs using STEMA, MarkSweep, CopyMS, SemiSpace, and GenMS respectively. The “%” columns show the percentage improvement of STEMA over the corresponding collector system, using STEMA as the base. The “G.M.” row is the average percentage improvement (geACM Transactions on Architecture and Code Optimization, Vol. V, No. N, February 2007.
Object Co-location and Memory Reuse for Java Programs
Benchmark jess mtrt raytrace javac jack db mpegaudio compress bloat jython hsqldb ps xalan antlr fop gcbench
Table VI. Average Total Execution Times (1× Minimum Heap Size) STEMA MS % CMS % SS % GenMS 109.12s 14.02s 14.04s 17.06s 12.64s 30.03s 5.81s 7.19s 45.67s 26.64s 29.33s 22.27s 5.23s 65.87s 8.61s 10.89s
– 14.19s 14.27s 18.14s 12.11s 29.71s 5.77s – 50.11s 27.80s – 22.04s 10.16s – 9.26s 10.40s
G.M. ∞/+ve/-ve
∞ 1.24 1.65 6.32 -4.21 -1.04 -0.73 ∞ 9.73 4.37 ∞ -1.06 94.38 ∞ 7.57 -4.46
– 12.31s 15.08s 16.02s 16.98s 34.07s 5.96s – – 26.76s 34.96s 23.12s 3.90s – 4.86s 16.06s
7.30 4/7/5
∞ -12.23 7.39 -6.10 34.35 13.47 2.54 ∞ ∞ 0.46 19.20 3.80 -25.46 ∞ -43.56 47.45
– – – 27.37s 19.87s – – – – 33.04s – 25.50s – – – –
0.54 4/8/4
∞ ∞ ∞ 60.47 57.18 ∞ ∞ ∞ ∞ 24.02 ∞ 14.47 ∞ ∞ ∞ ∞
– 11.72s 16.22s 13.07s 22.99s 36.63s – – – 13.83s 30.06s 11.91s 4.66s – 2.77s 6.85s
37.60 12/4/0
G.M. ∞/+ve/-ve
30.49s 6.96s 7.26s 11.39s 9.75s 20.94s 5.80s 7.29s 27.27s 20.05s 21.23s 18.73s 3.88s 35.44s 4.78s 7.22s
– 7.01s 7.62s 11.25s 9.41s 21.14s 5.84s – 29.02s 19.60s 23.69s 19.12s 3.90s 35.19s 4.43s 7.46s
∞ 0.68 4.99 -1.28 -3.47 0.93 0.67 ∞ 6.42 -2.24 11.59 2.08 0.54 -0.71 -7.22 3.34 1.07 2/9/5
– 7.68s 8.57s 11.81s 11.69s 22.95s 5.92s 8.58s – 25.87s 20.56s 19.45s 3.40s – 3.35s 10.38s
∞ 10.42 18.16 3.67 19.90 9.56 2.08 17.77 ∞ 29.03 -3.19 3.85 -12.57 ∞ -29.91 43.74 7.10 3/10/3
46.89s – – 14.92s 13.30s – 5.72s 8.91s – 22.84s 25.17s 21.02s 3.56s 58.10s 5.66s –
53.78 ∞ ∞ 30.97 36.39 ∞ -1.40 22.26 ∞ 13.89 18.56 12.26 -8.31 63.94 18.45 ∞ 22.03 5/9/2
17
% ∞ -16.39 ∞ -23.37 81.86 21.98 ∞ ∞ ∞ -48.07 2.47 -46.51 -10.92 ∞ -67.85 -37.12 -23.04 6/3/7
Table VII. Average Total Execution Times (1.25× Minimum Heap Size) Benchmark STEMA MS % CMS % SS % GenMS jess mtrt raytrace javac jack db mpegaudio compress bloat jython hsqldb ps xalan antlr fop gcbench
·
– 3.36s 8.32s 9.52s 4.76s 23.62s 5.85s 8.53s 16.94s 13.21s 20.03s 11.92s 4.05s – 2.49s 3.97s
% ∞ -51.71 14.64 -16.40 -51.71 12.80 0.96 17.06 -37.88 -33.07 -5.65 -36.35 4.30 ∞ -47.98 -45.05 -23.77 2/5/9
ometric mean) of STEMA over the 16 benchmarks. In Tables VI and VII, we use “–” to indicate that the collector is unable to run the application because of insufficient memory, and “∞” to represent the corresponding percentage improvement of STEMA. The “∞/+ve/-ve” row summarizes in each “%” column the number of benchmarks that cannot run to completion with the testing collector system; STEMA can achieve a performance improvement; and STEMA results in a performance degradation, respectively. In Tables VIII and IX, the total execution times are the geometric means of the total execution times of the benchmark programs across the suggested heap ranges. Table VI shows that of all the runnable benchmarks, STEMA performs 7.30%, ACM Transactions on Architecture and Code Optimization, Vol. V, No. N, February 2007.
18
·
Zoe C.H. Yu et al.
Table VIII. Average Total Execution Times (1.75× to 2.25× Minimum Heap Size) Benchmark STEMA MS % CMS % SS % GenMS jess mtrt raytrace javac jack db mpegaudio compress bloat jython hsqldb ps xalan antlr fop gcbench
9.92s 4.54s 4.57s 9.93s 6.43s 19.23s 5.88s 7.28s 18.90s 14.92s 13.90s 15.38s 3.48s 26.11s 2.84s 4.28s
10.35s 4.73s 4.72s 9.78s 6.30s 19.28s 5.89s 7.51s 19.20s 15.26s 16.37s 15.81s 3.52s 25.39s 2.86s 4.61s
G.M. ∞/+ve/-ve
4.35 4.24 3.29 -1.49 -2.16 0.22 0.13 3.13 1.59 2.32 17.72 2.83 1.06 -2.76 0.80 7.81 2.33 0/13/3
10.77s 5.02s 5.10s 9.76s 7.45s 20.23s 5.85s 7.21s 16.49s 25.88s 14.51s 15.60s 3.26s 26.48s 2.47s 5.81s
8.51 10.68 11.56 -1.71 15.86 5.21 -0.57 -1.05 -12.74 73.47 4.32 1.41 -6.37 1.39 -13.11 35.78 6.72 0/10/6
13.11s 5.84s 6.01s 10.07s 7.94s 19.19s 5.73s 7.18s 18.23s 15.85s 14.65s 16.28s 2.92s 27.29s 2.61s 6.83s
32.10 28.76 31.60 1.45 23.45 -0.20 -2.40 -1.38 -3.52 6.27 5.39 5.88 -16.11 4.52 -8.04 59.64
3.23s 3.33s 3.08s 9.00s 4.00s 20.12s 5.83s 7.27s 14.52s 13.37s 13.30s 11.89s 3.60s 23.43s 2.08s 3.17s
8.99 0/10/6
-20.75 0/2/14
Table IX. Average Total Execution Times (2.5× to 3× Minimum Heap Size) Benchmark STEMA MS % CMS % SS % GenMS jess mtrt raytrace javac jack db mpegaudio compress bloat jython hsqldb ps xalan antlr fop gcbench G.M. ∞/+ve/-ve
7.08s 3.95s 3.90s 9.20s 5.55s 18.80s 5.89s 7.31s 16.77s 13.47s 12.32s 14.02s 3.25s 24.24s 2.52s 3.33s
7.80s 4.11s 4.09s 9.02s 5.53s 18.93s 5.89s 7.33s 16.73s 13.73s 13.41s 14.68s 3.30s 23.33s 2.50s 3.66s
10.10 4.26 4.93 -1.96 -0.25 0.73 0.00 0.35 -0.26 1.95 8.79 4.76 1.60 -3.75 -0.66 9.64
7.45s 5.17 4.28s 8.52 4.30s 10.38 9.12s -0.88 6.09s 9.75 19.69s 4.75 5.87s -0.28 6.97s -4.57 13.47s -19.71 25.87s 92.10 12.79s 3.81 14.18s 1.16 3.08s -5.10 23.45s -3.25 2.20s -12.74 4.28s 28.41
8.46s 19.43 4.54s 15.07 4.54s 16.33 9.19s -0.10 6.37s 14.89 17.46s -7.11 5.73s -2.69 6.88s -5.80 14.48s -13.70 13.87s 2.96 12.44s 0.96 14.45s 3.14 2.64s -18.61 23.86s -1.57 2.15s -14.86 4.72s 41.61
2.44 0/11/5
5.28 0/9/7
2.11 0/8/8
%
-67.49 -26.63 -32.61 -9.31 -37.83 4.64 -0.79 -0.18 -23.15 -10.36 -4.32 -22.68 3.41 -10.28 -26.63 -25.79
3.22s 3.35s 3.07s 8.74s 3.95s 19.87s 5.85s 6.82s 14.00s 13.37s 12.60s 11.87s 3.44s 21.72s 2.10s 2.95s
% -54.58 -15.22 -21.25 -5.04 -28.86 5.70 -0.66 -6.62 -16.53 -0.75 2.24 -15.28 6.00 -10.40 -16.45 -11.46 -13.34 0/3/13
0.54%, 37.60% better than MarkSweep, CopyMS, and SemiSpace respectively with a tight heap. Table VII shows that with a more relaxed heap, STEMA outperforms MarkSweep, CopyMS, and SemiSpace by 1.07%, 7.10%, and 22.03%. Moreover, STEMA can run all the benchmark programs, while MarkSweep, CopyMS, and SemiSpace have 4, 4, and 12 benchmark programs that ran out of memory. The results demonstrate that with a small heap, STEMA performs well convincingly among the commonly used non-generational collectors. In these two tables, we also compare STEMA with GenMS. With a tight heap, although GenMS achieves a better time performance than STEMA in seven benchmarks, it cannot run six of the benchmark programs properly because of its larger heap size requirement ACM Transactions on Architecture and Code Optimization, Vol. V, No. N, February 2007.
Object Co-location and Memory Reuse for Java Programs
·
19
than STEMA. This suggests that STEMA may be a better choice than GenMS for memory constrained devices or systems. Table VIII shows that STEMA outperforms CopyMS and SemiSpace on average by 6.72% and 8.99% with a moderate heap. Table IX shows that when CopyMS and SemiSpace are provided with a large heap, STEMA is 5.28% and 2.11% better than CopyMS and SemiSpace. These two tables reveal that CopyMS and SemiSpace can get close to the time performance of STEMA, when they are provided with sufficient memory. Neither CopyMS nor SemiSpace is a suitable choice for handheld devices and multiprogrammed systems because of their large memory requirement. With a moderate to a large heap, both CopyMS and SemiSpace are ahead of STEMA for bloat, fop, and xalan. These outliers are probably due to their use of a bump pointer allocator which places objects side-by-side in the heap according to the allocation order; the time performance would become better if these objects are accessed according to their allocation order, which is not necessarily always the case in real applications. We do not use a bump pointer allocator in STEMA because we are interested in improving the performance of non-copying mark-andsweep systems which are more space-efficient. Our techniques should be applicable to copying collectors too. GenMS is shown to have excellent performance with a medium to a large heap ranges in Tables VIII and IX. It not only outperforms all non-generational collectors (including STEMA), but can also run all the benchmark programs for such heap ranges. Thus, GenMS is suitable for modern systems having plenty of memory. As STEMA and GenMS have their edge with different heap ranges, this suggests that STEMA may work adaptively with GenMS to achieve good performance for all heap sizes. To probe deeper into the true behavior of STEMA, we examine the performance breakdown of the benchmark programs. We focus on the four programs that are in the first group as discussed in Section 5.4. Since these programs, which belong to different benchmark suites and are of different application types, allocate a relatively large portion of memory in the R-space and exhibit a high GC load, their performance due to reusing memory blocks varies substantially. We also study compress and db, because of their unique and interesting behavior—the former creates very few prolific objects, and the latter produces mostly long-lived objects. We compare the performance of STEMA with the MarkSweep, CopyMS, and SemiSpace collectors in the MMTk toolkit, to demonstrate the strength of STEMA among non-generational collectors. Figures 9, 10, and 11 display the total execution time, mutator time, and GC time, respectively, of the six benchmark programs. STEMA attains the best time performance when the heap size is tight in most cases. SemiSpace has the poorest time performance with a small heap. It either cannot run the benchmark program, or takes a much longer time than other collectors to complete the execution. Similar results can be found in Tables VI and VII. SemiSpace reserves half of the memory space for copying lived objects at GC time. This reserved space is unused at mutator time. Thus, more GCs are needed to make enough room for future allocations, which results in a longer total GC time. Compared with MarkSweep, STEMA improves the mutator time of gcbench, raytrace, hsqldb, and jython by 21.64%, 9.07%, 15.69%, and 4.34% on average (geometACM Transactions on Architecture and Code Optimization, Vol. V, No. N, February 2007.
·
Zoe C.H. Yu et al. 20
Heap Size (MB) 30 35 40
25
45
50
55
20
5.5 MarkSweep SemiSpace CopyMS STEMA
30
Heap Size (MB) 35 40 45
50
55
1.4
14
4
12
3.5 10
3 2.5
8
2
6
Total Time (sec)
4.5
MarkSweep SemiSpace CopyMS STEMA
16 Normalized Total Time
5 Normalized Total Time
25
1.5 10 9.5 9
1.3
8.5 1.2 8
Total Time (sec)
20
7.5
1.1
1.5 4
7
1
1 1.5 2 2.5 Heap Size Relative to Minimum Heap Size
3
1
(a) gcbench Total Time 20
(b) compress Total Time
35
40
15
4 MarkSweep SemiSpace CopyMS STEMA
25
Heap Size (MB) 30 35
40
45
3
10
2.5
8
2
Total Time (sec)
1.8 12
30 28 26 1.4
24 22
6
1.2
1
4
1
1.5 2 2.5 Heap Size Relative to Minimum Heap Size
3
20 18 1
1.5 2 2.5 Heap Size Relative to Minimum Heap Size
(c) raytrace Total Time 30
55
60
65
3
35
MarkSweep SemiSpace CopyMS STEMA
2.5
20
30
25
2
20 1.5
25
30
Heap Size (MB) 35 40 45
50
55
60
3
Total Time (sec)
25
3
(d) db Total Time
Normalized Total Time
20
Heap Size (MB) 35 40 45 50
32
1.6
1.5
1
34
MarkSweep SemiSpace CopyMS STEMA
14 Normalized Total Time
Normalized Total Time
20
2
3.5
Normalized Total Time
3
Total Time (sec)
15
Heap Size (MB) 25 30
1.5 2 2.5 Heap Size Relative to Minimum Heap Size
MarkSweep SemiSpace CopyMS STEMA
2.5
35
30 2
25
Total Time (sec)
1
20
1.5
15 15 1
1 1
1.5 2 2.5 Heap Size Relative to Minimum Heap Size
(e) hsqldb Total Time Fig. 9.
3
1
1.5 2 2.5 Heap Size Relative to Minimum Heap Size
3
(f) jython Total Time
STEMA vs. Other Collectors (Total Execution Time)
ric mean) over the entire heap ranges (1–3 times the minimum heap requirement). However, STEMA achieves either very little or no improvement on the mutator time for db and compress. Compared with CopyMS and SemiSpace, STEMA shows a poorer mutator time in almost all cases. Both CopyMS and SemiSpace achieve very good mutator time because of the use of the bump pointer allocator. We discuss this further in Section 6.3 in the context of cache locality. Nonetheless, STEMA achieves a better total execution time than CopyMS and SemiSpace for these six benchmarks with a small to a medium heap size. This is because STEMA’s GC time is much shorter than that of CopyMS or SemiSpace. In particular, STEMA’s ACM Transactions on Architecture and Code Optimization, Vol. V, No. N, February 2007.
·
Object Co-location and Memory Reuse for Java Programs 55
2.4 2.2
1.6 2 1.4
1.8 1.6
1.2
25
30
Heap Size (MB) 35 40 45
50
55 9.5
MarkSweep SemiSpace CopyMS STEMA
1.4
9 8.5
1.3 8 1.2 7.5 1.1
7
1.4 1
6.5
1 1
1.5 2 2.5 Heap Size Relative to Minimum Heap Size
3
1
(a) gcbench Mutator Time 35
40
Normalized Mutator Time
1.5 MarkSweep SemiSpace CopyMS STEMA
1.4
15
4 3.8
1.3 3.6 3.4
1.2
3.2
20
25
Heap Size (MB) 30 35
40
45
1.5
4.2
Mutator Time (sec)
20
3
(b) compress Mutator Time
1.1
Normalized Mutator Time
15
Heap Size (MB) 25 30
1.5 2 2.5 Heap Size Relative to Minimum Heap Size
MarkSweep SemiSpace CopyMS STEMA
1.4
24 23 22
1.3
21 20
1.2 19 18
1.1
3
17
1
1 1
1.5 2 2.5 Heap Size Relative to Minimum Heap Size
3
1
(c) raytrace Mutator Time 30
55
60
65
Normalized Mutator Time
2
16
MarkSweep SemiSpace CopyMS STEMA
1.8
20
15 14
1.6
13 12
1.4 11 10
1.2
25
30
Heap Size (MB) 35 40 45
50
55
60
1.5
Mutator Time (sec)
25
3
(d) db Mutator Time
Normalized Mutator Time
20
Heap Size (MB) 35 40 45 50
1.5 2 2.5 Heap Size Relative to Minimum Heap Size
MarkSweep SemiSpace CopyMS STEMA
1.4
15
14
1.3
13
1.2
12 1.1
9 1
Mutator Time (sec)
Normalized Mutator Time
2.6
MarkSweep SemiSpace CopyMS STEMA
1.8
20 1.5
Mutator Time (sec)
50
Mutator Time (sec)
45
Mutator Time (sec)
Heap Size (MB) 30 35 40
25
Normalized Mutator Time
20 2
21
11 1
1
1.5 2 2.5 Heap Size Relative to Minimum Heap Size
(e) hsqldb Mutator Time Fig. 10.
3
1
1.5 2 2.5 Heap Size Relative to Minimum Heap Size
3
(f) jython Mutator Time
STEMA vs. Other Collectors (Total Mutator Time)
GC time is 110.41% and 115.17% better than SemiSpace for compress and db, and is 250.10% better than CopyMS for jython. The poor GC time of CopyMS for jython is likely due to the repeated copying of long-lived objects. CopyMS allocates objects to the copying space at allocation time, and copies reachable objects to and reclaims unreachable objects in the mark-and-sweep space at GC time. If many objects are reachable during GC time, CopyMS will have significant copying overhead. This will greatly increase the total GC time and hence the total execution time, as we can see in jython. Of the six benchmarks, hsqldb is the only one using multiple threads. STEMA ACM Transactions on Architecture and Code Optimization, Vol. V, No. N, February 2007.
·
Zoe C.H. Yu et al. 45
50
55
20
MarkSweep SemiSpace CopyMS STEMA
Heap Size (MB) 35 40 45
50
55
12
7
10
6 8
5
6
4 3
4
2 1
1.5 2 2.5 Heap Size Relative to Minimum Heap Size
1.6 1.4
5
1.2
4
1 3
0.8
2
0.6
1
3
1
1.5 2 2.5 Heap Size Relative to Minimum Heap Size
35
40
17 MarkSweep SemiSpace CopyMS STEMA
15 13
15
20
25
10 8
9
6
7 4
5 3
40
45
2
1
16
MarkSweep SemiSpace CopyMS STEMA
35
11
Heap Size (MB) 30 35
40
12
GC Time (sec)
20
3
(b) compress GC Time
Normalized GC Time
15
1.8
6
(a) gcbench GC Time Heap Size (MB) 25 30
2
0.4
2
1
2.2
MarkSweep SemiSpace CopyMS STEMA
7
GC Time (sec)
Normalized GC Time
8
14
30
12
25
10
20
8
15
6
10
4
5
2
1 1
1.5 2 2.5 Heap Size Relative to Minimum Heap Size
3
1
1.5 2 2.5 Heap Size Relative to Minimum Heap Size
(c) raytrace GC Time 30
55
60
65 25
MarkSweep SemiSpace CopyMS STEMA
9
20
15 5 10
30
Heap Size (MB) 35 40 45
50
55
60
MarkSweep SemiSpace CopyMS STEMA
10 20
7
25
12
GC Time (sec)
25
3
(d) db GC Time
Normalized GC Time
20
Heap Size (MB) 35 40 45 50
11
Normalized GC Time
30
14
Normalized GC Time
9
Normalized GC Time
25
8
GC Time (sec)
Heap Size (MB) 30 35 40
25
GC Time (sec)
20 10
20
15
8
6 10
GC Time (sec)
22
4
3 5 1
5 2 1
1
1.5 2 2.5 Heap Size Relative to Minimum Heap Size
(e) hsqldb GC Time Fig. 11.
3
1
1.5 2 2.5 Heap Size Relative to Minimum Heap Size
3
(f) jython GC Time
STEMA vs. Other Collectors (Total GC Time)
performs well for hsqldb, because the retention of memory blocks and their allocation are per mutator thread, and so reusing the retained memory blocks does not have the synchronization overhead of allocating a new one from the virtual memory resource pool. STEMA shows an improvement in both the mutator time and the GC time in hsqldb. Its time performance however has certain fluctuation when compared with other benchmarks. This is likely due to the thread scheduling system of the Jikes RVM. As we will see later, STEMA can also improve the cache locality of hsqldb, which gives rise to a good execution time for this benchmark. From the results, we observe that a program’s mutator time is not affected much ACM Transactions on Architecture and Code Optimization, Vol. V, No. N, February 2007.
·
Object Co-location and Memory Reuse for Java Programs 25
Heap Size (MB) 30 35 40
45
50
55
20
MarkSweep SemiSpace CopyMS STEMA
30
Heap Size (MB) 35 40 45
50
55
30
7 25 6 5
20
4
15
3
10
Normalized Mutator L1 Misses
8
600
MarkSweep SemiSpace CopyMS STEMA
35 Mutator L1 Misses (106)
9
1.8
550 500
1.6
450 1.4 400 1.2 350
2 5
1 1
1.5 2 2.5 Heap Size Relative to Minimum Heap Size
1
3
1
(a) gcbench L1 Mutator Misses 15
Heap Size (MB) 25 30 35
20
40
3
(b) compress L1 Mutator Misses
45
15
20
25
Heap Size (MB) 30 35
40
45
2 MarkSweep SemiSpace CopyMS STEMA
150 140
1.6 130 120
1.4
110 1.2
100
Normalized Mutator L1 Misses
160 Mutator L1 Misses (106)
1.8
MarkSweep SemiSpace CopyMS STEMA
1.8
600 550
1.6
500
1.4
450 400
1.2 350
90 1
1 1
1.5 2 2.5 Heap Size Relative to Minimum Heap Size
3
1
1.5 2 2.5 Heap Size Relative to Minimum Heap Size
(c) raytrace L1 Mutator Misses 20
25
30
Heap Size (MB) 35 40 45 50
55
60
3
(d) db L1 Mutator Misses 65
20
3
25
30
Heap Size (MB) 35 40 45
50
55
60
2 MarkSweep SemiSpace CopyMS STEMA
500 450 400
2
350 300
1.5
250 200
1 1
1.5 2 2.5 Heap Size Relative to Minimum Heap Size
(e) hsqldb L1 Mutator Misses Fig. 12.
3
Normalized Mutator L1 Misses
2.5
MarkSweep SemiSpace CopyMS STEMA
550 Mutator L1 Misses (106)
Normalized Mutator L1 Misses
Mutator L1 Misses (106)
2 Normalized Mutator L1 Misses
1.5 2 2.5 Heap Size Relative to Minimum Heap Size
1.8
400
350 1.6 300 1.4
250
1.2
Mutator L1 Misses (106)
Normalized Mutator L1 Misses
25
2
Mutator L1 Misses (106)
20 10
23
1 1
1.5 2 2.5 Heap Size Relative to Minimum Heap Size
3
(f) jython L1 Mutator Misses
STEMA vs. Other Collectors (Total L1 Mutator Misses)
by the chosen heap size. On the other hand, a program’s GC time always decreases with the growth of the heap, because less GC is required when more memory is available. 6.3 Cache Locality We measure both L1 and L2 cache locality for STEMA, MarkSweep, CopyMS, and SemiSpace. In particular, we measure the number of mutator misses and the number of collector misses separately for each application so that we can have a better understanding of how STEMA affects cache locality. ACM Transactions on Architecture and Code Optimization, Vol. V, No. N, February 2007.
·
Zoe C.H. Yu et al. 45
50
55
250
10 200 8 150 6 100
4
Heap Size (MB) 35 40 45
50
55
MarkSweep SemiSpace CopyMS STEMA
9
50 45 40 35
7
30 25
5
20 15
3
10 5
1 1
1.5 2 2.5 Heap Size Relative to Minimum Heap Size
3
1
(a) gcbench L1 Collector Misses 15
20
25
Heap Size (MB) 30 35
40
1.5 2 2.5 Heap Size Relative to Minimum Heap Size
3
(b) compress L1 Collector Misses
45
20
25
30
Heap Size (MB) 35 40 45
50
55
60 250 200
15 150 10 100 5
Collector L1 Misses (106)
20
50
1
MarkSweep SemiSpace CopyMS STEMA
50
350 300 250
40
200
30
150 20 100 10
Collector L1 Misses (106)
MarkSweep SemiSpace CopyMS STEMA
Normalized Collector L1 Misses
25 Normalized Collector L1 Misses
30
50
2 1
50
1 1
1.5 2 2.5 Heap Size Relative to Minimum Heap Size
3
1
(c) raytrace L1 Collector Misses 30
55
60
65
20 700
MarkSweep SemiSpace CopyMS STEMA
600
15 500 400 10 300 200
5
3
25
30
Heap Size (MB) 35 40 45
50
55
60
20 Normalized Collector L1 Misses
25
1.5 2 2.5 Heap Size Relative to Minimum Heap Size
(d) db L1 Collector Misses
Collector L1 Misses (106)
20
Heap Size (MB) 35 40 45 50
20 Normalized Collector L1 Misses
25
MarkSweep SemiSpace CopyMS STEMA
600 500
15
400 10
300 200
5 100
100 1
Collector L1 Misses (106)
Normalized Collector L1 Misses
300
MarkSweep SemiSpace CopyMS STEMA
12
20 11
Collector L1 Misses (106)
Heap Size (MB) 30 35 40
25
Normalized Collector L1 Misses
20 14
Collector L1 Misses (106)
24
1 1
1.5 2 2.5 Heap Size Relative to Minimum Heap Size
(e) hsqldb L1 Collector Misses Fig. 13.
3
1
1.5 2 2.5 Heap Size Relative to Minimum Heap Size
3
(f) jython L1 Collector Misses
STEMA vs. Other Collectors (Total L1 Collector Misses)
6.3.1 L1 Cache Locality. Figures 12 and 13 show the mutator and the collector L1 cache misses respectively for different collectors. Compared with MarkSweep, STEMA reduces the L1 mutator cache misses for three of the six benchmark programs, gcbench, hsqldb, and jython by 10.71%, 13.43%, and 23.52% on average. We attribute this result to the effectiveness of the memory block reuse feature of STEMA. The reuse is effective for these benchmark programs because they create a considerable amount of prolific objects with a high GC load. Both are necessary conditions because STEMA relies on a tracing collector to determine the number of memory blocks to be retained for reuse purposes. A high GC load means more ACM Transactions on Architecture and Code Optimization, Vol. V, No. N, February 2007.
Object Co-location and Memory Reuse for Java Programs
·
25
GCs, which provides more opportunities for the system to adjust the amount of memory retained. STEMA increases the L1 mutator cache misses of compress, as compress allocates only a small amount of prolific objects. CopyMS and SemiSpace have relatively fewer L1 mutator cache misses for most benchmark programs. It is due to their use of a bump pointer allocator which provides good locality to Jikes RVM-specific objects. The amount of the L1 collector cache misses follows the trend of the GC times. If more GCs are performed, more L1 misses would be induced. Therefore, SemiSpace has poorest L1 collector cache locality, while STEMA and MarkSweep have very good L1 collector cache locality.
6.3.2 L2 Cache Locality. Figures 14 and 15 show the mutator L2 cache misses and the collector L2 cache misses respectively. Compared with L1 cache locality, L2 cache performance has a strong bearing on the runtime performance of the benchmark programs. On average, STEMA reduces the number of L2 mutator cache misses by 3.47% over the six benchmarks when compared with MarkSweep. This cache-level locality improvement is more significant in raytrace and hsqldb, where their number of mutator misses are reduced by 8.05% and 10.22% respectively. It is because co-locating prolific objects in raytrace and hsqldb creates locality that improves the mutator time as well as the total execution time. It is interesting to note that CopyMS has more L2 mutator cache misses than all other collectors for db and jython, while SemiSpace achieves very good mutator L2 cache locality, despite the fact that both of them use the same bump pointer allocator. CopyMS copies lived objects from a copying space to a mark-and-sweep space at GC time. It is possible that this action spoils the mutator L2 cache locality. The L2 collector cache misses have a similar trend as the L1 collector cache misses for the six benchmark programs. compress has very few L1 and L2 collector misses and a small GC time in the small heap range. It is because STEMA does not require as many GCs as the other collectors in a small heap situation for compress, as the heap is less fragmented. Most of the benchmark programs have good L2 mutator cache locality with SemiSpace and CopyMS, because objects are placed together in allocation order. This echoes the point that co-locating objects at similar creation times can improve locality, because it is likely that these objects are related and accessed together later on. SemiSpace has the poorest L2 collector cache locality in most cases, because it has a higher GC load than the other collectors. We use an internal table to record the prolificacy of types. The table itself enjoys good locality because it is accessed frequently to check for a type’s prolificacy at allocation time. This can be observed from the figures where the numbers of L1 and L2 misses are not increased by much (if any) comparing with MarkSweep. This additional data structure can also affect the timing of when GC is triggered, i.e., earlier than expected, because the table grows with the number of types created by the application and thus affects the amount of available memory in the heap. Therefore, STEMA sometimes has slightly more collector misses (thus a longer GC time) than MarkSweep for db and jython, because one or two more GCs are performed. ACM Transactions on Architecture and Code Optimization, Vol. V, No. N, February 2007.
·
Zoe C.H. Yu et al. 20
25
Heap Size (MB) 30 35 40
45
50
55
20
4.5
1.6
4
1.4
3.5
1.2
3
Heap Size (MB) 35 40 45
50
55
1.5 2 2.5 Heap Size Relative to Minimum Heap Size
1.8
15
20
40
11 10
1.6
9
1.4
8 7
1.2
1
3
1
(a) gcbench L2 Mutator Misses Heap Size (MB) 25 30 35
MarkSweep SemiSpace CopyMS STEMA
6
2.5 1
1.5 2 2.5 Heap Size Relative to Minimum Heap Size
3
(b) compress L2 Mutator Misses
45
20
25
30
Heap Size (MB) 35 40 45
50
55
2 MarkSweep SemiSpace CopyMS STEMA
3.4 3.2
1.6
3 2.8
1.4
2.6 2.4
1.2
2.2
Normalized Mutator L2 Misses
3.6 Mutator L2 Misses (106)
1.8
1.5 2 2.5 Heap Size Relative to Minimum Heap Size
1.8
110 1.6
100
1.4
90 80
1.2
1
3
1
1.5 2 2.5 Heap Size Relative to Minimum Heap Size
(c) raytrace L2 Mutator Misses 20
25
30
Heap Size (MB) 35 40 45 50
55
60
120
70
2
1 1
MarkSweep SemiSpace CopyMS STEMA
3.8
Mutator L2 Misses (106)
2 Normalized Mutator L2 Misses
30
Mutator L2 Misses (106)
1.8
Normalized Mutator L2 Misses
MarkSweep SemiSpace CopyMS STEMA
1
3
(d) db L2 Mutator Misses 65
20
2
25
30
Heap Size (MB) 35 40 45
50
55
60
2 MarkSweep SemiSpace CopyMS STEMA
7.5 7
1.6
6.5 6
1.4 5.5 5
1.2
Normalized Mutator L2 Misses
1.8
MarkSweep SemiSpace CopyMS STEMA
8
Mutator L2 Misses (106)
Normalized Mutator L2 Misses
25
2
Mutator L2 Misses (106)
Normalized Mutator L2 Misses
2
1.8
5.5 5
1.6 4.5 1.4
4
1.2
3.5
Mutator L2 Misses (106)
26
4.5 1
3
1 1
1.5 2 2.5 Heap Size Relative to Minimum Heap Size
3
(e) hsqldb L2 Mutator Misses Fig. 14.
1
1.5 2 2.5 Heap Size Relative to Minimum Heap Size
3
(f) jython L2 Mutator Misses
STEMA vs. Other Collectors (Total L2 Mutator Misses)
6.4 Effects of the Choice of Prolific Types In Sections 3 and 4, we suggest not to treat character and byte arrays, the String type, and types belonging to the Java Collections Framework as prolific types, because these objects tend to be long-lived. Allocating them in the R-space means mixing long-lived objects with short-lived objects, which will harm the performance (in particular the mutator time) of Java programs. Figure 16 shows the performance of compress and db when different sets of prolific types are used. In the figure, “Selected Prolific Types” means that the aforementioned object types would skip the prolificacy check and are allocated in the NR-space; “All Prolific Types” means ACM Transactions on Architecture and Code Optimization, Vol. V, No. N, February 2007.
·
Object Co-location and Memory Reuse for Java Programs 20
Heap Size (MB) 30 35 40
25
45
50
55
20
25
30
Heap Size (MB) 35 40 45
50
55
8
25
7
20
5
15 10
3
Normalized Collector L2 Misses
9
MarkSweep SemiSpace CopyMS STEMA
30 7
5 4.5
6
4 3.5
5
3 4
2.5
3
2 1.5
2
5
1
1
1 1
1.5 2 2.5 Heap Size Relative to Minimum Heap Size
3
1
(a) gcbench L2 Collector Misses 15
20
25
Heap Size (MB) 30 35
40
45
3
20
25
30
Heap Size (MB) 35 40 45
50
55
20
35 30 25
15
20 10
15 10
5
MarkSweep SemiSpace CopyMS STEMA
35
30
30
25
25
20
20
15
15 10 10 5
5
5 1
Collector L2 Misses (106)
MarkSweep SemiSpace CopyMS STEMA
Normalized Collector L2 Misses
40
Collector L2 Misses (106)
1 1
1.5 2 2.5 Heap Size Relative to Minimum Heap Size
3
1
(c) raytrace L2 Collector Misses 20
25
30
Heap Size (MB) 35 40 45 50
55
1.5 2 2.5 Heap Size Relative to Minimum Heap Size
3
(d) db L2 Collector Misses
60
65
20
4
25
30
Heap Size (MB) 35 40 45
50
55
60
11 MarkSweep SemiSpace CopyMS STEMA
3
14 12
2.5
10
2
8 1.5
Normalized Collector L2 Misses
16
Collector L2 Misses (106)
3.5
50
MarkSweep SemiSpace CopyMS STEMA
18 9
45 40 35
7
30 25
5
20 15
3
10
6 1
5
1 1
1.5 2 2.5 Heap Size Relative to Minimum Heap Size
(e) hsqldb L2 Collector Misses Fig. 15.
3
Collector L2 Misses (106)
Normalized Collector L2 Misses
1.5 2 2.5 Heap Size Relative to Minimum Heap Size
(b) compress L2 Collector Misses
25
Normalized Collector L2 Misses
Collector L2 Misses (106)
MarkSweep SemiSpace CopyMS STEMA
Collector L2 Misses (106)
Normalized Collector L2 Misses
11
27
1
1.5 2 2.5 Heap Size Relative to Minimum Heap Size
3
(f) jython L2 Collector Misses
STEMA vs. Other Collectors (Total L2 Collector Misses)
objects of all the detected prolific types are placed and co-located in the R-space; “Prolific Types w/o Arrays and String” means objects of the String type and all array types are allocated to the NR-space; and “Shuf et al.” means using Shuf et al.’s offline approach to identify prolific types. Figure 16 reveals that using different sets of prolific types could affect both the mutator time and the GC time of an application program. It shows that our online approach for prolific type identification and selection (i.e., “Selected Prolific Types”) is better than Shuf et al.’s offline approach, because our approach can detect whether a prolific type will become non-prolific during the program execution. ACM Transactions on Architecture and Code Optimization, Vol. V, No. N, February 2007.
·
Zoe C.H. Yu et al. 20
25
30
Heap Size (MB) 35 40 45
50
55
15
1.5 STEMA (Selected Prolific Types) STEMA (All Prolific Types) STEMA (Prolific Types w/o Arrays and String) STEMA (Shuf et al.)
25
Heap Size (MB) 30 35
40
45
STEMA (Selected Prolific Types) STEMA (All Prolific Types) STEMA (Prolific Types w/o Arrays and String) STEMA (Shuf et al.)
10 1.8
1.3
9 8.5
1.2
8 1.1
Total Time (sec)
9.5
Normalized Total Time
Normalized Total Time
1.4
20
2 36 34 32 30
1.6
28 26
1.4
24 1.2
7.5
Total Time (sec)
28
22 20
7
1 1
1.5 2 2.5 Heap Size Relative to Minimum Heap Size
1
3
1
1.5 2 2.5 Heap Size Relative to Minimum Heap Size
(a) compress Total Time 20
25
30
Heap Size (MB) 35 40 45
50
(b) db Total Time 55
15
20
25
Heap Size (MB) 30 35
40
45
1.5 STEMA (Selected Prolific Types) STEMA (All Prolific Types) STEMA (Prolific Types w/o Arrays and String) STEMA (Shuf et al.)
9 1.3
8.5 8
1.2
Mutator Time (sec)
9.5
7.5 1.1
1.4
27 26 25 24
1.3
23 22
1.2
21 1.1
20
7
19
1
1 1.5 2 2.5 Heap Size Relative to Minimum Heap Size
3
1
1.5 2 2.5 Heap Size Relative to Minimum Heap Size
(c) compress Mutator Time 20
25
30
Heap Size (MB) 35 40 45
50
(d) db Mutator Time
55
15
4
20
25
Heap Size (MB) 30 35
40
45
60 STEMA (Selected Prolific Types) STEMA (All Prolific Types) STEMA (Prolific Types w/o Arrays and String) STEMA (Shuf et al.)
1.1
50
0.9 0.8
2.5
0.7 2
0.6
GC Time (sec)
1 3
12
STEMA (Selected Prolific Types) STEMA (All Prolific Types) STEMA (Prolific Types w/o Arrays and String) STEMA (Shuf et al.)
1.2
Normalized GC Time
Normalized GC Time
3
10
40
8
30
6
20
4
10
2
GC Time (sec)
1
3.5
Mutator Time (sec)
STEMA (Selected Prolific Types) STEMA (All Prolific Types) STEMA (Prolific Types w/o Arrays and String) STEMA (Shuf et al.)
Normalized Mutator Time
Normalized Mutator Time
1.5
1.4
3
0.5
1.5
0.4 1
1 1
1.5 2 2.5 Heap Size Relative to Minimum Heap Size
(e) compress GC Time Fig. 16.
3
1
1.5 2 2.5 Heap Size Relative to Minimum Heap Size
3
(f) db GC Time
Effects of Choice of Prolific Types on compress and db
In compress, when different prolific types are picked for performance optimization, the GC time is affected. It is because co-locating different prolific types in the R-space would affect the degree of memory fragmentation and hence the number of GCs required. If STEMA blindly treats all array types as non-prolific, more GCs would be required as we can see in compress, because too many objects are allocated in the NR-space and the memory blocks in the R-space cannot be fully utilized. For db, the mutator time is influenced when different sets of prolific types are used. The total execution time of the “Selected Prolific Types” is better than that of “All Prolific Types” by 8.79%, “Prolific Types w/o Arrays and String” by ACM Transactions on Architecture and Code Optimization, Vol. V, No. N, February 2007.
Object Co-location and Memory Reuse for Java Programs
·
29
Table X. Fragmentation Results of STEMA and MarkSweep Benchmark STEMA (%) S.D. MarkSweep (%) S.D. jess mtrt raytrace javac jack db mpegaudio compress bloat jython hsqldb ps xalan antlr fop gcbench
31.41 10.66 13.80 22.77 16.71 8.38 19.92 9.01 19.44 22.29 14.00 22.15 9.83 22.72 21.96 4.66
7.61 4.82 7.21 14.47 13.96 5.40 11.62 6.28 12.84 8.14 8.43 11.56 9.77 14.29 15.93 2.80
34.93 15.47 14.95 42.07 26.47 8.09 16.36 12.22 31.16 30.66 21.30 24.18 10.11 25.13 28.39 6.01
18.69 11.18 10.27 27.42 24.01 5.46 11.31 7.71 20.90 14.26 14.73 14.82 9.89 18.05 8.86 1.77
G.M.
15.20
8.82
19.09
11.70
1.64%, and “Shuf et al.” by 13.59%. The poorer performance of the latter three cases is due to the worsened mutator time. From Figure 16(d), neither including all prolific types nor using the offline prolific type identification method can identify a good set of prolific types. The GC time is not affected by much as in the case of compress, because the selected prolific types do not have an impact on the memory fragmentation situation for db. From the results, the “Selected Prolific Types” works well on both compress and db. This proves that the properties of prolific types derived in Section 3 are correct, and making use of the corresponding rules for prolific types selection is advantageous. 6.5 Fragmentation We evaluate the effect of co-locating prolific objects and reusing their memory blocks on memory fragmentation. We define fragmentation ratio as the number of unused bytes over the amount of memory (in bytes) requested by an application. These unused bytes are those of the unused memory cells in memory blocks that contain lived objects, not including the unused retained memory blocks in the Rspace of STEMA. We measure the fragmentation ratios before and after every GC invocation for a heap size equal to twice the minimum heap requirement of each application. We then take the average of the fragmentation ratios at the end of the program execution. Table X shows the average fragmentation ratios (the “%” columns) of the benchmark programs using STEMA and MarkSweep. The “S.D.” column is the standard deviation of each fragmentation ratio measured. We can see that STEMA has a lower average fragmentation ratio than MarkSweep in nearly all the cases. It is because prolific objects are more likely to have similar lifetimes, and so prolific objects in the same memory blocks are likely to die together. This also proves that the memory block reuse mechanism is effective. At the same time, the reuse reduces fragmentation, and hence the number of GCs. The standard deviations of ACM Transactions on Architecture and Code Optimization, Vol. V, No. N, February 2007.
30
·
Zoe C.H. Yu et al. Table XI.
Benchmark jess mtrt raytrace javac jack db mpegaudio compress bloat jython hsqldb ps xalan antlr fop gcbench
Number of GCs of STEMA and MarkSweep Number of GCs 1.25 × Min. Heap 1.5 × Min. Heap 2 × Min. Heap STEMA MS ∆ STEMA MS ∆ STEMA MS ∆ 151 19 23 13 35 13 1 3 61 47 57 42 4 76 9 31
200 +49 18 -1 25 +2 13 0 35 0 14 -1 1 0 15 +12 71 +10 44 -3 59 +2 42 0 4 0 84 +8 8 -1 32 +1
71 12 15 9 24 8 1 3 42 36 32 32 3 46 5 23
75 +4 12 0 15 0 9 0 22 -2 8 0 1 0 10 +7 47 +5 35 -1 51 +19 32 0 3 0 55 +9 5 0 24 +1
36 7 9 9 15 5 1 3 25 20 20 22 2 26 3 15
33 7 9 9 15 5 1 5 28 20 24 22 2 27 3 16
-3 0 0 0 0 0 0 +2 +3 0 +4 0 0 +1 0 +1
3 × Min. Heap STEMA MS ∆ 18 4 5 5 9 3 1 3 15 11 13 13 1 14 2 9
17 -1 4 0 5 0 5 0 9 0 3 0 1 0 3 0 15 0 11 0 13 0 14 +1 1 0 14 0 2 0 10 +1
the fragmentation ratios can be quite large, because the degree of fragmentation before and after GC should be different. The heap is often more fragmented before GC, and the situation would improve after GC. Table XI shows the number of GCs being invoked in the benchmark programs, with the heap size ranging from one and a quarter to three times the minimum heap requirement of each application. The “STEMA” and “MS” columns refer to the number of full-heap GCs required for STEMA and MarkSweep respectively. The “∆” column is the difference in the number of GCs between the STEMA and the MarkSweep with STEMA as the base. The result shows that STEMA requires fewer GCs than MarkSweep for compress, jess, bloat, hsqldb, antlr, and gcbench, because the heap of STEMA is less fragmented. This is especially true with a small heap. STEMA requires one to three more GCs than MarkSweep for mtrt, db, jython, and fop, although they all have a lower fragmentation ratio than MarkSweep. This may be due to the additional data structure we used for keeping track of types’ prolificacy, which affected the amount of memory available for memory allocation and thus induced more GCs. For jess, although STEMA requires several more GCs than MarkSweep with a larger heap, STEMA has a shorter GC time than MarkSweep. This shows that memory reuse can help reduce the GC overhead and thus shorten the total GC time.
7. RELATED WORK STEMA aims to improve the execution speeds of Java programs through improved memory allocation, better cache locality, and reduced memory fragmentation. STEMA’s main tools are memory block reuse and co-location of prolific objects. Reduced fragmentation is particularly important for non-copying collectors. Therefore, we consider others’ work on cache conscious memory allocators and collectors, and techniques of memory reuse for optimization purposes. ACM Transactions on Architecture and Code Optimization, Vol. V, No. N, February 2007.
Object Co-location and Memory Reuse for Java Programs
·
31
7.1 Cache Conscious Memory Allocators and Collectors Wilson et al. [1992] studied the effect of cache associativity, cache size, and cache miss rates for a copying generational GC for Scheme. They pointed out that the problem of locality can be due to both memory allocation and GC, and not GC alone. They improved the locality of generational copying collectors by copying objects which are likely to be accessed contemporaneously together to a mature space during nursery collection. In contrast, STEMA improves the cache locality of a program by aggressively reusing memory blocks from deceased objects collected during GC so that some cache content could be reused after GC and the number of misses is thus reduced. Grunwald et al. [1993] investigated the effect of dynamic storage allocator on reference locality. They showed that algorithms which coalesce adjacent free memory blocks aggressively tend to have poorer program reference locality and longer total execution time. They also demonstrated that most CPU efficient allocators, such as segregated freelist allocators which do not coalesce free memory, have better locality than allocators based on sequential fit. They suggested that rapid memory reuse can enhance program locality, which however might bring forth fragmentation problems. Although they gave highlights of the design principles for developing a memory allocator so that good referential locality can be achieved, they did not provide any proof nor implementation to support their claims. Shuf et al. [2002] proposed to co-locate prolific objects that are connected via object references, with an aim to improve the collector cache locality of Java programs. Unlike their approach, STEMA co-locates objects of the same prolific type in the same memory block, leading to improved mutator cache locality. The approach we use for object co-location is simpler, because we do not require any object connectivity information at memory allocation time. Guyer and McKinley [2004] presented a dynamic object co-location technique which allocates connected objects in the same GC memory space. Their work is based on generational collector and requires static compile-time analysis to determine in which memory space the source object resides, and then allocates the target object to the same memory space. Unlike their work, STEMA does not require static compile-time analysis, but requires determination of types’ prolificacy and homogeneity of type within a memory block. Veldema et al. [2005] proposed the idea of object combining which combines related objects together. In their method, two objects are considered combined if one object becomes the field of another object. They rely heavily on a native Java compiler to transform multiple objects into one object. They also make use of static compile-time analysis to decide if two or more objects should be combined into a single one. However, if objects of different lifetimes are combined into a single object, the memory of the short-lived objects can be reclaimed only if all combined objects are unreachable. STEMA does not suffer from this problem, because STEMA places prolific type objects together at allocation time and does not combine multiple objects into a single one. The memory of the short-lived objects can still be reclaimed for future object allocation, if their memory blocks cannot be retained and reused. ACM Transactions on Architecture and Code Optimization, Vol. V, No. N, February 2007.
32
·
Zoe C.H. Yu et al.
7.2 Reusing Memory of Existing Objects The work that is most similar to ours is the one by Grunwald and Zorn [1993]. They presented CustoMalloc which can synthesize a custom memory allocator for specific applications. Special linked-lists are used as a front-end allocator for allocating objects of frequently occurring object sizes. The allocation procedure turns to a back-end allocator when the linked-lists of the front-end allocator become empty. Unlike CustoMalloc which distinguishes objects by size offline, STEMA identifies prolific types and non-prolific types online for selecting the appropriate allocator. Indeed, we have found type to be a better indicator than size of an object’s behavior and lifetime. Moreover, the front-end and back-end allocators of CustoMalloc are memory cell based, while STEMA uses memory block (each containing multiple memory cells) as the unit. We pick a coarser reuse granularity in order that objects of the same prolific type can be placed together, which can improve the cache locality of a program. This is difficult to achieve if the reuse granularity is a cell. Another closely related work is by Shuf et al. [2002]. Their approach identifies prolific types using offline profiling, and thus a program has to be run at least once to obtain the needed prolificacy information before the actual run of the program. STEMA is an improvement over their work in the sense that it identifies prolific types with an online approach, which gives STEMA the flexibility to react spontaneously if and when the prolificacy of a type changes during program execution. As an option, STEMA provides an offline repository to log the prolific type information. Thus, STEMA can avoid the overhead of online profiling by using the logged profile starting from the second run of the program. Although Shuf et al. have suggested the possibility to recycle objects of prolific types by placing them in a special pool instead of the default free pool, they did not provide any experimental results to confirm the viability of their proposal. As opposed to reusing individual memory cells as they have suggested, STEMA reuses memory blocks allocated to prolific type objects in their entirety. As our experiments have verified, reusing memory blocks did lead to better performance due to the clustering effect of objects of the same prolific types. Lee and Yi [2004] performed static analysis on ML programs and then transformed them by adding explicit memory reuse commands into the source code. They showed that automatic insertion of memory reuse commands in ML programs could result in smaller maximum memory requirement and shorter GC time. However, their approach cannot handle polymorphism and mutable objects. Our previous work [Yu et al. 2004] continued the work of Shuf et al. by carrying out a feasibility study on reusing memory given up by deceased objects to improve the space-time performance of Java programs. We obtained object traces of each Java program being evaluated, and analyzed the amount of space saving if the memory occupied by prolific objects is reused (called object caching). We showed that a considerable amount of space can be saved this way. We also implemented a simple prototype, using the Base configuration of the MarkSweep collector of the Jikes RVM, to demonstrate that object caching can indeed improve the time performance of GC. This present work on reusing memory blocks to improve the total execution time of Java programs differs from our previous work in the following aspects. ACM Transactions on Architecture and Code Optimization, Vol. V, No. N, February 2007.
Object Co-location and Memory Reuse for Java Programs
·
33
—We detect prolific types using a low-overhead OTS mechanism so that the online results can immediately be used to influence the performance of the executing program. We used only offline profiling in our previous work. —In this work, retained memory blocks in excess in the R-space can be transferred to the NR-space to avoid premature invocation of GC and out-of-memory situations. Our previous work does not have the ability to predict whether the memory blocks retained would be used in the future. —We use the Fast configuration in the Jikes RVM for STEMA, which is much faster than the Base configuration used in our previous work. —In this work, we have carried out a detailed performance evaluation and analysis for STEMA in order to fully understand the effects of co-location of prolific objects and memory block reuse on program performance. 8. SUMMARY AND CONCLUSION We introduce STEMA, a new memory management system which can improve the execution time of Java programs by applying memory reuse and object co-location to prolific objects. Our design is founded upon properties of prolific objects we discovered through experiments. We show that memory block reuse can reduce the L1 mutator locality of Java programs, and co-location of prolific objects can reduce the L2 mutator locality. STEMA is able to reduce fragmentation, and thus the GC time of Java programs. Since STEMA relies heavily on type prolificacies, it is equipped with a lowoverhead OTS mechanism for detecting type prolificacies on-the-fly. With OTS, prolificacy information can be used immediately to influence the ongoing execution of the program. OTS uses a table for type ID mapping so that type checking can be done efficiently. To retain a suitable number of memory blocks for future reuse, STEMA monitors the number of memory blocks allocated to prolific objects so that the number retained for future allocation is more or less commensurate with that before the occurrence of GC. STEMA also would transfer unused retained blocks from one memory space to another to avoid GC being invoked too soon. We evaluate STEMA with 16 benchmarks, and compare its performance with MarkSweep, CopyMS, SemiSpace, and GenMS. Our results show that STEMA performs on average 3.0%, 3.4%, and 28.8% better than MarkSweep, CopyMS and SemiSpace respectively with a small heap; 2.6%, 6.7%, and 9.0% with a medium heap; and 2.4%, 5.3%, and 2.1% with a large heap. For hsqldb, a prototype of the popular relational DB engine, STEMA is 15.2% better than MarkSweep, 3.3% better than CopyMS, and 6.5% better than SemiSpace. STEMA also reduces fragmentation by 5% on average, leading to less GC in many applications. STEMA performs better than GenMS with a tight heap as GenMS fails to run six of 16 benchmarks with this heap. This suggests that STEMA is a better choice than GenMS for small memory platforms. STEMA may also work adaptively with GenMS to achieve good performance for all heap sizes. In this work, we make use of prolific types to improve memory management. Intuitively, prolific sizes may also be used to achieve the same goals. We have tried experimentally using “prolific sizes” in STEMA to direct allocation decisions, but ACM Transactions on Architecture and Code Optimization, Vol. V, No. N, February 2007.
34
·
Zoe C.H. Yu et al.
found that prolific sizes are not a good predictor of object lifetimes. For most of the time, the use of size prolificacies led to performance degradation when we applied memory reuse and object co-location to objects of prolific sizes. Details of prolific sizes versus prolific types can be found in Yu et al. [2006]. STEMA uses online profiling to detect the prolificacy of types. It is possible to transfer this mechanism to the compilation phase so that prolificacy information can be made available before the program executes, and the overhead of online profiling can be completely removed or much reduced. ACKNOWLEDGMENTS
We would like to thank the associate editor in charge and the anonymous reviewers for their detailed comments which have greatly improved this paper. This work is partially supported by a Hong Kong RGC CERG grant (7141/06E). REFERENCES Alpern, B., Attanasio, C. R., Barton, J. J., Burke, M. G., Cheng, P., Choi, J.-D., Cocchi, A., Fink, S. J., Grove, D., Hind, M., Hummel, S. F., Lieber, D., Litvinov, V., Mergen, M. F., Ngo, T., Russell, J. R., Sarkar, V., Serrano, M. J., Shepherd, J. C., Smith, S. E., Sreedhar, V. C., Srinivasan, H., and Whaley, J. 2000. The Jalape˜ no Virtual Machine. IBM System Journal 39, 1, 211–238. Alpern, B., Augart, S., Blackburn, S., Butrico, M., Cocchi, A., Cheng, P., Dolby, J., Fink, S., Grove, D., Hind, M., McKinley, K., Mergen, M., Moss, J., Ngo, T., Sarkar, V., and Trapp, M. 2005. The Jikes Research Virtual Machine Project: Buliding an Open-source Research Community. IBM Systems Journal 44, 2, 399–417. Arnold, M., Fink, S., Grove, D., Hind, M., and Sweeney, P. F. 2000. Adaptive Optimization in the Jalape˜ no JVM. In Proc. 15th ACM SIGPLAN Conference on Object-Oriented Programming, Systems, Languages, and Applications (OOPSLA ’00). ACM Press, 47–65. Blackburn, S. M., Cheng, P., and McKinley, K. S. 2004. Oil and Water? High Performance Garbage Collection in Java with MMTk. In Proc. 26th International Conference on Software Engineering (ICSE ’04). Edinburgh, Scotland. Boehm, H. J. 1997. GCBench. http://www.hpl.hp.com/personal/Hans Boehm/gc/gc bench/. Brecht, T., Arjomandi, E., Li, C., and Pham, H. 2001. Controlling Garbage Collection and Heap Growth to Reduce the Execution Time of Java Applications. In Proc. 16th ACM SIGPLAN Conference on Object-Oriented Programming, Systems, Languages, and Applications (OOPSLA ’01). ACM Press, New York, NY, USA, 353–366. Choi, H.-K., Chung, Y. C., and Moon, S.-M. 2005. Java Memory Allocation with Lazy Worst Fit for Small Objects. The Computer Journal 48, 4, 437–442. DaCapo. 2004. DaCapo Benchmarks (beta050224). http://www-ali.cs.umass.edu/DaCapo/. Dijkstra, E. W., Lamport, L., Martin, A. J., Scholten, C. S., and Steffens, E. F. M. 1978. On-the-fly Garbage Collection: An Exercise in Cooperation. Commun. ACM 21, 11, 966–975. Eeckhout, L., Georges, A., and Bosschere, K. D. 2003. How Java Programs Interact with Virtual Machines at the Microarchitectural Level. In Proc. 18th Annual ACM SIGPLAN Conference on Object-Oriented Programing, Systems, Languages, and Applications (OOPSLA ’03). ACM Press, New York, NY, USA, 169–186. Grunwald, D. and Zorn, B. 1993. CustoMalloc: Efficient Synthesized Memory Allocators. Software—Practice and Experience 23, 8, 851–869. Grunwald, D., Zorn, B., and Henderson, R. 1993. Improving the Cache Locality of Memory Allocation. In Proc. ACM SIGPLAN 1993 Conference on Programming Language Design and Implementation (PLDI ’93). ACM Press, Albuquerque, New Mexico, United States, 177–186. Guyer, S. Z. and McKinley, K. S. 2004. Finding Your Cronies: Static Analysis for Dynamic Object Colocation. In Proc. 19th Annual ACM SIGPLAN Conference on Object-Oriented ACM Transactions on Architecture and Code Optimization, Vol. V, No. N, February 2007.
Object Co-location and Memory Reuse for Java Programs
·
35
Programming, Systems, Languages, and Applications (OOPSLA ’04). ACM Press, New York, NY, USA, 25–36. ´, D. 2002. Hertz, M., Blackburn, S. M., Moss, J. E. B., McKinley, K. S., and Stefanovic Error-free Garbage Collection Traces: How to Cheat and Not Get Caught. In Proc. 2002 ACM SIGMETRICS International Conference on Measurement and Modeling of Computer Systems (SIGMETRICS ’02). ACM Press, New York, NY, USA, 140–151. Lee, O. and Yi, K. 2004. Experiments on the Effectiveness of an Automatic Insertion of Memory Reuses into ML-like Programs. In Proc. 4th International Symposium on Memory Management (ISMM ’04). ACM Press, Vancouver, BC, Canada, 97–107. Lindholm, T. and Yellin, F. 1999. The Java Virtual Machine Specification, 2nd ed. AddisonWesley, Palo Alto, California. Pettersson, M. 2003. Linux/x86 Performance-Monitoring Counters Software (perfctr-2.6.4). http://www.csd.uu.se/˜mikpe/linux/perfctr/. Sachindran, N. and Moss, J. E. B. 2003. Mark-copy: Fast copying gc with less space overhead. In Proc. the 18th Annual ACM SIGPLAN Conference on Object-Oriented Programing, Systems, Languages, and Applications (OOPSLA ’03). ACM Press, New York, NY, USA, 326–343. Shuf, Y., Gupta, M., Bordawekar, R., and Singh, J. P. 2002. Exploiting Prolific Types for Memory Management and Optimizations. In Proc. 29th ACM SIGPLAN-SIGACT Symposium on Principles of Programming Languages (POPL ’02). ACM Press, 295–306. Shuf, Y., Gupta, M., Franke, H., Appel, A., and Singh, J. P. 2002. Creating and Preserving Locality of Java Applications at Allocation and Garbage Collection Times. In Proc. 17th ACM SIGPLAN Conference on Object-Oriented Programming, Systems, Languages, and Applications (OOPSLA ’02). ACM Press, 13–25. SPEC. 1998. SPEC JVM98 Benchmarks. http://www.spec.org/osg/jvm98/. Sun Microsystems, I. February, 2003. Introduction to Throughput Computing: Sun’s Revolutionary UltraSPARC Processor Strategy for Driving Down the Cost and Complexity of Network Computing. http://www.sun.com/processors/throughput/. Veldema, R., Jacobs, C. J. H., Hofman, R. F. H., and Bal, H. E. 2005. Object Combining: A New Aggressive Optimization for Object Intensive Programs. Concurrency and Computation: Practice and Experience 17, 439–464. Wilson, P. R., Lam, M. S., and Moher, T. G. 1992. Caching Considerations for Generational Garbage Collection. In Proc. 1992 ACM Conference on LISP and Functional Programming (LFP ’92). ACM Press, San Francisco, California, United States, 32–42. Yang, T., Hertz, M., Berger, E. D., Kaplan, S. F., and Moss, J. E. B. 2004. Automatic Heap Sizing: Taking Real Memory into Account. In Proc. 4th International Symposium on Memory Management (ISMM ’04). ACM Press, New York, NY, USA, 61–72. Yu, Z. C. H., Lau, F. C. M., and Wang, C.-L. 2004. Exploiting Java Objects Behavior for Memory Management and Optimizations. In Proc. Second Asian Symposium of Programming Languages and Systems (APLAS ’04). LNCS 3302. Springer-Verlag, 437–452. Yu, Z. C. H., Lau, F. C. M., and Wang, C.-L. 2006. Object Co-location and Memory Reuse for Java Programs (Minor Revisions on 28/02/2007). Technical Report TR-2006-05, The University of Hong Kong.
ACM Transactions on Architecture and Code Optimization, Vol. V, No. N, February 2007.