losses to predict visual saliency changes in a rule-based ap- proach. Experimental .... 576, 400 frames, 25Hz), soccer (720 Ã 576, 400 frames,. 25Hz), Movie (720 ... the compressed error-free sequence was not displayed [11]. An EyeLink II ...
Proceedings of Seventh International Workshop on Video Processing and Quality Metrics for Consumer Electronics
January 30-February 1, 2013, Scottsdale, Arizona
OBJECTIVE NO-REFERENCE PREDICTION OF SALIENCY CHANGES IN THE PRESENCE OF PACKET LOSSES S. Argyropoulos1,3 , M.-N. Garcia1,3 , M. Salem1,3 , D. List1,3 , R. Schleicher2,3 , and A. Raake1,3 1
Assessment of IP-based Applications Technical University Berlin Berlin, Germany
2
Quality & Usability Lab Technical University Berlin Berlin, Germany
3
Deutsche Telekom Laboratories Deutsche Telekom AG Berlin, Germany
The impact of saliency on perception of quality in images was investigated using eye-tracking experiments in [4]. It was shown that attention-based spatial pooling does not lead to consistent improvement in quality prediction, however the introduced artefacts were only due to compression or blurring. In [5], different schemes were proposed to weight the error in video sequences due to packet losses by the visual saliency of the video pixels and it was shown that the performance of existing objective video quality metrics, such as MSE or SSIM [6], can be improved if the focus of attention is taken into consideration. Moreover, in [7], a model of saliency awareness to complement existing video quality metrics was proposed based on a subjective experiment in which the viewers rated the annoyance of videos with transmission distortions either in the salient regions or the non-salient regions. This experiment confirmed that distortions occurring in the salient regions tend to affect more the annoyance of the viewers. This work was further extended in [8], where it was also shown that sequences with distortions in the salient regions generally receive lower ratings compared to the sequences with distortions in the nonsalient regions. Saliency information was also used in [9] to improve the prediction of visibility of distortion artefacts by including two saliency-related factors in a Generalized Linear Model: (a) the changes between the saliency maps of the distorted and the reference frames and (b) the temporal variation of the saliency maps of the distorted sequence. The aforementioned methods, however, do not address the question on whether the slicing artefacts due to packet losses distract the attention of the viewer and cause a rapid change on the viewer’s focus of attention, which is the topic of the present study.
ABSTRACT In this paper, a novel no-reference method to predict the impact of packet losses in video sequences on visual attention is proposed. Initially, the results of a subjective eye-tracking experiment are analyzed to determine whether the artefacts caused by network degradations result in abrupt saliency changes. Then, the proposed method employs existing objective visual attention models to compute the saliency maps of the individual frames. Subsequently, the temporal consistency of the saliency maps is investigated and correlated with the error propagation pattern that results from the packet losses to predict visual saliency changes in a rule-based approach. Experimental results on a proprietary database are presented to demonstrate the validity of the proposed method. 1. INTRODUCTION The proliferation of video content delivery during the last years has necessitated the development of objective video quality assessment methods. It is of vital importance for service providers to automatically assess the perceptual impact of impairments caused by network degradations to monitor and control the performance of their networks and guarantee a certain level of Quality of Experience (QoE) to the end user [1]. Most of the existing video quality metrics consider the video artefacts irrespective of the error position and do not account for the content dynamics. Hence, most approaches do not consider that visual content usually exhibits regions of different levels of saliency, leading the Human Visual System (HVS) to differently direct visual attention [2]. The limitations linked with ignoring the uneven distribution of visual saliency is of particular relevance in the presence of transmission errors since packet losses can cause significantly different visual impact in different video segments. For example, slicing artefacts due to packet losses may increase the saliency level of certain regions within a frame. Thus, it is expected that considering visual saliency will improve the performance of algorithms for the evaluation of perceptual video quality [3].
In this paper, a novel method is presented to predict whether transmission errors in video sequences result in changes on the saliency awareness. Unlike the visibility detection algorithms, this method provides indication of loss events which occur outside of the focus of attention and cause a sudden and rapid distraction of the viewer. Initially, the results of a subjective eye-tracking experiment are analyzed in a fullreference manner to identify when slicing artefacts attract
6
VPQM2013
the attention of the viewer and result in saliency changes (saccades). Statistical tests are employed to consider the inherent variability of visual attention in repetitive viewing of the same content [10]. Subsequently, a novel noreference method is presented which employs an existing objective visual attention model in the literature to compute the saliency maps of the individual frames. Then, the temporal consistency of the saliency maps is investigated and correlated with the error propagation pattern that results from the packet losses to predict visual saliency changes. It must be noted that the focus of the present study is limited to the detection of whether slicing artefacts caused by packet losses distract the visual attention of the viewer and does not quantify the impact of such losses on the overall quality ratings, which is a matter of further study. Finally, experimental results on the subjective eye-tracking database are presented to demonstrate the validity of the proposed method.
100
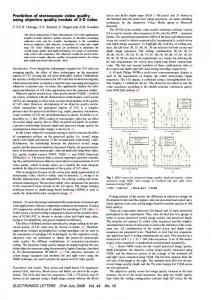
Percentage of viewers focusing on the erroneous area
error duration
50
0
error−free lossy difference −50 0
50
100
150 frame index
200
250
300
(a)
2. SUBJECTIVE EYE-TRACKING EXPERIMENT For the eye-tracking experiments twelve standard video sequences were used in YUV 4:2:0 format: basketball (720 × 400, 300 frames, 25 Hz), canoe (720 × 576, 220 frames, 25 Hz), desert (720 × 396, 240 frames, 25 Hz), entertainment (708 × 576, 250 frames, 25 Hz), race (720 × 540, 250 frames, 25 Hz), Stefan (720 × 488, 300 frames, 30 Hz), table-tennis (704 × 576, 300 frames, 30 Hz), movie trailer (720 × 576, 382 frames, 24Hz), interview (720 × 576, 400 frames, 25Hz), soccer (720 × 576, 400 frames, 25Hz), Movie (720 × 576, 384 frames, 24Hz), and music video clip (720 × 576, 400 frames, 25Hz). The sequences were compressed according to the H.264/AVC standard at 4 Mbps using the x264 encoder, with the GOP size equal to one second, IbbP GOP structure, and one slice per macroblock row. Bursty packet losses were inserted in the compressed bitstreams with 0.5% and 1% packet loss rate. A proprietary H.264/AVC decoder was used which employs concealment of lost regions with the co-located region of the previous frame. The uncompressed and the two lossy versions of the sequences were displayed to 27 non-expert viewers. Therefore, 3 × 12 = 36 sequences were displayed to each viewer. Since it has been shown in the literature that video coding does not result in changes of the saliency maps the compressed error-free sequence was not displayed [11]. An EyeLink II eye-tracker from SR Research was used in the experiment to record they eye movements. It is a headmounted system with three miniature cameras, two of which are connected to an adjustable bracket on the side of the strap and allow binocular eye movement detection. This happens using an automatic detection of the pupil and a reflection point on the cornea. The third mini-camera is located on the head-band and is used to compensate head
(b)
(c) Fig. 1. Visual attention changes in the presence of packet loss for “basketball” sequence with 0.5% packet loss: (a) percentage of viewers focusing at the region where the error occurs (b) visual attention in an error-free frame (c) visual attention in an erroneous frame. movement, using four infrared markers attached to the display device. For the presentation, the sequences were scaled to a uniform size of 720 × 576 pixels and displayed in a 34 × 27 cm area in a 42 inch screen. The distance of the viewers from the screen was 4 times the picture height, i.e. 108 cm, which corresponds to approximately 18◦ × 14◦ of the visual field. The accuracy of the eye-tracker is 0.5◦ of the viewing angle. Before the experiment, the viewers were given instructions, the device was mounted to the head, calibrated, and training sequences were displayed.
7
(a)
(b)
(c)
Fig. 2. Classification of packet loss events using the eye-tracking data: (a) the error occurs in the region of interest and no change of saliency is detected (b) the error causes a saliency change (c) the error is imperceptible. illustrates the visual attention of the viewers in an error-free frame. Green crosses denote fixations while watching the error-free sequence whereas blue crosses denote fixations while watching the erroneous area. Since no error occurs in this frame, the distribution of fixations is quite similar, as expected. However, for a subsequent erroneous frame depicted in Figure 1 (c), it is obvious that the attention of the viewers is shifted to the artefact region and the distribution of the viewers in the erroneous sequence (blue crosses) is different than the error-free case. To detect if the two fixation distributions (of the error-free and the erroneous sequence) of each packet loss event are statistically different, the distance of every fixation point to the nearest erroneous block (computed in a full-reference manner) is calculated. Then, the mean distances and the differences in the mean distance is calculated. Finally, a ttest is performed to identify if the two distance distributions are different. Based on the results of the t-test, each error is classified in one of the three categories mentioned in the beginning of this section. Figures 2 (a), (b), (c) depict one sample of the error events which corresponds to categories 1, 2, and 3, respectively. For visual purposes, the erroneous region due to packet losses is overlayed with red color in the first two images.
3. VISUAL SALIENCY AWARENESS IN THE PRESENCE OF PACKET LOSSES In principle, the errors in a video frame can be classified in three main categories: 1. the error occurs in the region of interest (and therefore no change in visual attention can be observed) 2. the error occurs outside the region of interest and attracts visual attention 3. the error occurs outside the region of interest and no change of visual attention is caused. The first objective of the analysis of the eye-tracking data is to identify to which of these three categories each packet loss event pertains to, i.e., whether the image degradation caused by the packet losses causes a statistically significant difference in the visual attention of the viewers. In other words, we need to identify when a change in the saliency awareness is attributed to the different stimuli and not the inherent intra-variability of the gaze patterns and the repetitive viewing of the same content. Figure 1(a) depicts the percentage of viewers fixating in the region where the loss occurs for all the frames of the “basketball” sequence. More specifically, the green solid line corresponds to the errorfree sequence, the red dashed line to the lossy sequence with 0.5% packet losses, and the blue dashed dotted line to the difference between the two. By comparing the gaze patterns of the error-free sequence with the lossy video sequence it can be seen that for the error event which occurs in frame 173 and propagates until frame 201 there is considerable amount of viewers who get distracted by the artefact and focus their attention at a different region. It can be also seen that even though the error propagation stops at frame 201, the visual attention remains at the erroneous region for several more frames (almost one second) and then it converges again with the focus area of the error-free sequence (at frame 235). Figure 1 (b)
4. NO-REFERENCE MODELING OF SALIENCY CHANGES USING OBJECTIVE SALIENCY MODELS In this section, a novel method is proposed to evaluate the effect of transmission errors on visual saliency awareness in a no-reference manner by employing existing saliency models of the literature, such as the one proposed by Itti et al. [12]. It is assumed that the only available information is the erroneous decoded frame under consideration, all other previously decoded frames, and the received erroneous bitstream which can be used to indicate the location of the error and its propagation in the subsequent frames. Therefore, by applying the aforementioned visual attention
8
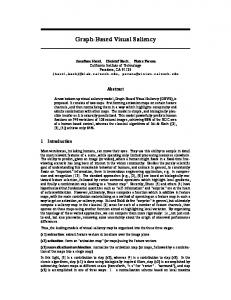
video frame t
compute saliency map SM
compute error map EM
SM overlaps with EM?
no
No change in saliency map
no
Change in saliency map
have corresponding salient points a further check between the error map of the previous frame EM ′ and its saliency map SM ′ is performed. If they overlap, then it is assumed that the salient point under consideration was also apparent in the previous frame and was caused by the packet losses. Otherwise, if SM ′ and EM ′ do not overlap it is deduced that there is no change of visual attention. To explain the above procedure, Figure 4 depicts an example where a modification in the saliency map is predicted due to the overlapping of the corresponding salient region with its error map, even though there is no saliency content difference between the current and its previously decoded frame. Comparing the saliency maps of the original (errorfree) and decoded (erroneous) frames, a new saliency region can be seen in the decoded frame’s saliency map (top-right corner) indicating a change in its saliency content. By comparing the saliency maps of the current and previously decoded frame a change in saliency would be predicted in the current decoded frame, due to the presence of both salient points (top-right region) in erroneous regions when comparing each with its error map.
yes video frame t-1
compute saliency map SM’
compute error map EM’
SM corresponds to SM’?
yes No change in saliency map
no
SM’ overlaps with EM’?
yes
Change in saliency map
Fig. 3. Block diagram of the method for detecting visual attention changes using no-reference saliency models.
model a saliency map for every frame (erroneous or not) of the sequence is obtained. A preliminary analysis of the results of the previous section indicates that the saliency map of a distorted frame (due to packet losses) can only be different from its original undistorted frame at the regions where the error occurs. In other words, a transmission error never causes a new saliency point outside the region of the error. Thus, the proposed method relies on the temporal coherency of the visual attention for successive frames in the video sequence. However, when comparing a frame with its previous frames, distortions would not be the only reason for causing a change in the saliency map as motion between the frames might play a role as well. The challenge is to correctly predict if the change in salient regions between a frame and its previous one is due to distortions (and therefore it can be deduced that distortions have an impact on the saliency awareness) or due to the temporal difference between the two frames. Figure 3 illustrates the block diagram of the proposed method. Initially, the saliency map, denoted by SM , of the frame under consideration at time t is computed, e.g. using [12], and the binary error map, denoted by EM , which can be computed from the bitstream. The details for the computation of the error map is out of scope of this paper; in short, it is based on estimating the innovation error due to a packet loss and then tracking the error propagation based on motion vector information. In the next step, for each salient point in SM , it is checked whether the error map overlaps with the salient point. If it does not overlap, it is assumed that the salient point is due to the content of the scene and no change in saliency awareness is caused. Otherwise, if the location of the error does overlap with a salient point, then the saliency map SM ′ of the previous frame t − 1 is also computed. Based on the assumption of consistency of visual attention for neighbouring frames, if the two saliency maps SM and SM ′ do not have corresponding salient points it is deduced that a change in the visual attention has been caused in the current frame. Otherwise, if SM and SM ′
5. EXPERIMENTAL EVALUATION The validity of the proposed method is tested on the data obtained from the subjective eye-tracking experiment. Initially, the ground truth data are obtained using the method presented in Section 3, and error events due to packet losses are classified according to the three categories, mentioned in the beginning of Section 3. After each event has been classified into one of the three categories, the method of Section 4 is applied to predict which of these categories the error under consideration pertains to. Therefore, the performance of the method for modeling changes in saliency awareness can be evaluated using the following two metrics (presented as ratios): false positives (FP), which corresponds to the case that an error event is falsely classified as causing a visual attention change, and false negatives (FN), which corresponds to the case that the algorithm fails to identify the saliency changes due to packet loss. Moreover, for the method of Section 4 two options are investigated: the first approach employs the previous frame in display order, while the second approach examines the previous frame in decoding order. In the first case, the temporal difference of the previous frame from the current frame is smaller (and therefore the consistency of saliency and error maps is higher) while in the latter case the previous frame does not contain any errors due to error propagation. In the following results, F PC and F NC denote the above ratios when the previous frame in coding order is used, while F PD and F ND correspond to the use of the previous frame in display order. Additionally, the results are presented separately for the lower loss rate (0.5%), the higher loss rate
9
(a) Original error-free frame
(d) Saliency map of error-free frame
(b) Decoded frame at time t
(e) Saliency map of frame t
(g) Error map of frame t
(c) Previously decoded frame t − 1
(f) Saliency map of frame t − 1
(h) Error map of frame t − 1
Fig. 4. Visual saliency change detection by comparing the error propagation maps and the saliency maps of the current and its previous frame.
F PC F PD F NC F ND
Table 1. False positive and false negative ratios 0.5% packet loss rate 1% packet loss rate all sequences 7.42 % 12.37 % 9.15 % 9.28 % 14.02 % 12.26 % 15.25 % 17.33 % 16.38 % 10.04 % 13.28 % 12.07 %
(1%) and for all loss rates. From this table it can be seen that the selection of the previous frame in coding order results in less false detections whereas the use of the previous frame in display order results in less false negatives (i.e., failure to detect saliency changes). This is attributed to the closer temporal distance if display order is used which provides better consistency between successive saliency maps. Moreover, as it was quite expected, the performance of the algorithm worsens as the packet loss increases. This is mainly attributed to the fact that in the sequences with extreme losses the error map cannot be accurately mapped between successive frames.
on the saliency awareness of viewers in video sequences. Initially, a subjective experiment was conducted to obtain the ground truth data for different types of error patterns in a set of video sequences with varying spatio-temporal content dynamics. A t-test was employed for each error event in a sequence to classify if the distribution of fixation points while watching the erroneous sequence is statistically significantly different than the distribution in the error-free sequences. Based on these ground truth data, a no-reference method was presented which employs existing visual attention models to obtain the saliency map of each frame. Subsequently, the temporal consistency of the saliency maps is investigated and correlated with the error propagation pattern that results from the packet losses, to predict visual saliency changes. The quality impact of saliency changes is a topic of future work.
6. CONCLUSION In this paper, a novel method was presented to predict the impact of transmission errors, both spatially and temporally,
10
[7] U. Engelke, M. Barkowsky, P. L. Callet, and H. J. Zepernick, “Modelling saliency awareness for objective video quality assessment,” in Int. Conf. on Quality of Multimedia Experience, Trondheim, Norway, Sep. 2010.
7. REFERENCES [1] A. Raake et al., “T-V-Model: Parameter-based prediction of IPTV quality,” in Int. Conf. on Acoustics, Speech, and Signal Processing (ICASSP), Las Vegas, Nevada, Mar. 2008. [2] V. Mahadevan and N. Vasconcelos, “Spatiotemporal saliency in dynamic scenes,” IEEE Trans. on Pattern Analysis and Machine Intelligence, vol. 32, no. 1, pp. 171–177, Jan. 2010.
[8] U. Engelke, R. Pepion, P. L. Callet, and H. J. Zepernick, “Linking distortion perception and visual saliency in H.264/AVC coded video containing packet loss,” in Int. Conf. on Visual Communication and Image Processing, Huang Shan, China, Jul. 2010.
[3] U. Engelke, H. Kaprykowsky, H. J. Zepernick, and P. Ndjiki-Nya, “Visual attention in quality assessment,” IEEE Signal Processing Magazine, vol. 26, no. 6, pp. 50–59, Nov. 2011.
[9] T. Liu, X. Feng, A. Reibman, and Y. Wang, “Saliency inspired modelign of packet-loss visibility in decoded videos,” in Int. Workshop of Video Processing and Quality Metric, Scottsdale, AZ, Jan. 2009.
[4] A. Ninassi, O. L. Meur, P. L. Callet, and D. Barba, “Does where you gaze affect perception of quality? applying visual attention to image quality metric,” in Int. Conf. on Image Processing, San Antonio, TX, Sep. 2007.
[10] M. Dorr, T. Martinetz, K. Gegenfurtner, and E. Barth, “Variability of eye movements when viewing dynamic natural scenes,” Journal of Vision, vol. 10, no. 10, pp. 1–17, Oct. 2010.
[5] X. Feng, T. Liu, D. Yang, and Y. Wang, “Saliency based objective quality assessment of decoded video affected by packet losses,” in Int. Conf. on Image Processing, San Diego, CA, Oct. 2008.
[11] O. L. Meur, A. Ninassi, P. L. Callet, and D. Barba, “Do video coding impairments disturb the visual attention deployment?” Elsevier Signal Processing: Image Communication, vol. 25, no. 8, pp. 597–609, Sep. 2010.
[6] Z. Wang and A. C. Bovik, “Image quality assessment: from error visibility to structural similarity,” IEEE Trans. on Image Processing, vol. 13, no. 4, pp. 1–14, Apr. 2004.
[12] L. Itti, C. Koch, and E. Niebur, “A model of saliencybased visual attention for rapid scene analysis,” IEEE Trans. on Pattern Analysis and Machine Intelligence, vol. 20, no. 11, pp. 1254–1259, Nov. 1998.
11