Scott Newman and Richard Lo. U.S. Army CERDEC. {Scott.Newman, Richard.Lo}. @us.army.mil. Abstract. In this paper we describe an approach to the problem ...
On Automated Policy Generation for Mobile Ad Hoc Networks Cho-Yu J. Chiang, Gary Levin, Yitzchak M. Gottlieb, Ritu Chadha, Shihwei Li and Alex Poylisher Telcordia Technologies {chiang, glevin, zuki, chadha, sli, sher} @research.telcordia.com Abstract In this paper we describe an approach to the problem of automated policy generation for mobile ad hoc networks. The automated policy generation problem is difficult in its own right. It becomes even more challenging when the context environment to consider is a mobile ad hoc network. We have designed an optimization-based, utility-driven approach aimed at generating optimal policies with respect to the given network objectives. The main novelty of this approach is in the combination of optimization heuristics and network simulation to solve the problem. We describe this approach, present the software architecture of our implementation, and illustrate the approach with a case study on automated generation of DiffServ-based QoS policies for a 50-node mobile ad hoc network.
1.
Introduction
In recent years, mobile ad hoc networks [5] have received considerable attention due to their capabilities to enable data networking without any infrastructure support. Specifically there are no wires, no dedicated routers, and no immobile network nodes. Since there are no fixed wires, nodes use wireless radios with limited bandwidth and typically high loss rates to communicate; since there are no dedicated routers, every node participates in packet forwarding, i.e. every node is a router; since the location of a node is not fixed and nodes can enter and leave the network at any time, the topology of the network is dynamic. The use of a distributed policy-based network management tool has been demonstrated to provide the necessary self-healing and self-adapting capabilities for managing mobile ad hoc networks [1][2][3]. Although policy-based management tools contribute to network management automation, they still currently require network administrators to specify policies. The complexity of dynamic mobile ad hoc networks makes
Scott Newman and Richard Lo U.S. Army CERDEC {Scott.Newman, Richard.Lo} @us.army.mil
policy specification and evaluation of policy effectiveness extremely difficult. Therefore, we consider the problem of automated generation of network management policies based on available network plans and related information. In essence, this problem of policy generation is converted into the following optimization problem: given network information and objectives as input, generate optimal policies as output. The optimization process is guided by a utility function based on performance evaluation criteria reflecting the network objectives. The chief contribution of this work is the design of a generic policy generation architectural framework. While this framework is capable of supporting policy generation for mobile ad hoc networks, it is applicable to stable, stationary networks as well. The other notable feature of this framework is that it can be used to generate policies for various management domains such as routing configuration, topology control, radio spectrum planning, and QoS assurance. We have implemented this framework and used it in a case study to generate DiffServ-based [10] QoS policies for a 50node mobile ad hoc network. The remainder of this paper is organized as follows. In Section 2, we provide some background information, give an overview of the problem, and present our problem formulation. In Section 3, we present our approach, including the conceptual framework, the technical rationale, and the software organization. In Section 4, we describe experimental use of this approach with a case study on automating the generation of QoS policies for a 50-node mobile ad hoc network. We conclude the paper with a summary of this work and our perspective on automated policy generation.
2.
Background
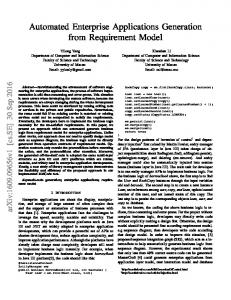
This paper addresses the problem of automated policy generation. Regardless of the type of network being considered, our solution to this problem begins with development of a model of the network and its objectives. We assume that the network is managed by a group of distributed policy managers, and that there is a global policy manager responsible for distributing policies, as described in [2]. Network and related plan information is contained in the network model and the objectives of the network are assumed to be known beforehand. The dynamicity of mobile ad hoc networks significantly increases the complexity of designing a policy composition engine. The effort starts with modeling the network. As illustrated in Figure 1, a model representing a mobile ad hoc network includes three categories of information: communication resources, communication patterns, and node movement. The first category contains relatively static information related to available assets. The other two categories encapsulate predictions of network usage and of the mobility model, respectively. Network Model
Communication Resources Information Radio assets and application software used in the network
Communication Patterns Information Who talks to whom, in what ways, when, where and how long?
Who Where What When How
Node Movement Information
Node movement projection model
Figure 1. A network model of mobile ad hoc networks
Policyi denote the ith policy set to be evaluated. Mathematically, we want to obtain the maximum possible utility Utilitymax, where Utilitymax is defined as: Utilitymax = MAX{Utilityi }i = 1, 2, 3, … where Utilityi = U(NM, Policyi )
(1)
Our goal, therefore, is to find a policy set, Policymax that optimizes the function U with a utility value Utilitymax . A few points need to be made regarding the above formulation. First, when NM represents a mobile ad hoc network, the dynamicity of the network must be accounted for. Second, the utility function U must closely model the network objectives. Third, to arrive at a solution, the number of policy sets to evaluate for any non-trivial network could be enormous. Lastly, we need to define the contents of a policy set Policyi. We will discuss each of the above items in later sections.
3.
Approach
Our approach starts with building a simulation model of the network. Any single simulation run produces one evaluation of the utility function to be optimized by the selected optimization heuristic. Referring to equation (1) in Section 2, NM is a mobile ad hoc network simulation model, Policyi is a specific set of policies that represents configuration settings for the network, and U is a utility function whose value can be computed based on collected simulation run statistics. Given the above setup, an optimization heuristic can be selected to drive the optimization process to determine the optimal Utilitymax, i.e., the maximum value of the function U and the corresponding set of policies Policymax. In the above, we implicitly assumed that there was a one-to-one mapping from a collection of configuration settings to a policy set. We believe this assumption holds for deterministic policy models in which policy behaves deterministically rather than stochastically. This view also implements a language-neutral policy generation paradigm. Adaptors can be built to convert configuration settings to different policy specifications.
Network objectives are required by the policy composition engine for evaluating the effectiveness of different sets of policies for the network. Our approach was to formulate the challenge of generating policies from a network model and its objectives as an optimization problem. In a nutshell, our policy composition engine takes a network model and performance objectives (represented by a utility function) as input, and returns the policy set generating the optimal utility value as output, as described below.
3.1 Parallel simulated annealing
A network model is a data representation of the network and is denoted by NM. Network objectives are collectively represented by a single function, U, that includes a number of performance metrics such as packet loss ratio, packet transmission delay, jitter, etc. as its constituents. U can be a composite function to combine multiple distinct network objectives. Let
A single simulation run for a high-fidelity network model with a reasonable number of nodes can take hundreds or even thousands of seconds to complete, and therefore the time needed for an optimization heuristic to converge to the optimal or a near-optimal solution was a major concern. We used Simulated Annealing as the optimization heuristic in our
approach. Our implementation is based on Adaptive Simulated Annealing (ASA) [9] due to its capability to reduce the number of function evaluations for the result to converge. In addition, we recognized that the structure of the simulated annealing algorithm allowed for parallelizing the search process and modified ASA to select multiple sets of parameter values and run multiple utility function evaluations in parallel. This allows utility values to be generated in parallel for each selected set of parameters. Once a set of parallel tasks has completed, the modified ASA again generates multiple sets of parameters for evaluation. This process repeats until the result has converged. Our optimization algorithm that uses the parallel simulated annealing algorithm is listed in Figure 2. The goal of the algorithm is to choose values for experiment parameters (EP) that maximize the overall network utility (U) for a scenario (s) of a particular mission (M). Here a mission consists of multiple scenarios and defines the communication resources common for these scenarios, and a scenario defines communication patterns and node movements. The last parameter to the algorithm is the number of parallel evaluations (PE) at each step. //Define U(s,EP) as the utility value for //a given EP U(s,EP) = utility function of ns-2 run of s with EP; //Use Simulated Annealing with a suitable //temperature parameter T to control the //annealing schedule Choose initial values for T, currentEP; currentBestU = U(s,currentEP); bestEP = currentEP; bestU = currentBestU; While not satisfied Choose new epi near currentEP, i=1..PE; Post simulation tasks to Bulletin Board for M, s, epi i=1..PE; Wait for results ui from the tasks; u = max(ui); If u > bestU bestU = u; bestEP = epi where u=ui; If u >= bestU or random() < e(u-bestU)/T currentEP = epi; currentU = ui; Reduce T; Set satisfied based on T or lack of improvement in bestU; Return bestU, bestEP; Figure 2. The Parallel Simulated Annealing Algorithm
4.
Case study
Based on the above approach, we studied the problem of automating the generation of DiffServ QoS configuration policies for mobile ad hoc networks using several different scenarios. We used ns2 [7] as the network simulator. The experiment setup included a 50-node simulation model of a mobile ad hoc network. Each node was equipped with a single radio with 250m communication radius. The physical data link rate of the radio was 5.5Mbps. Nodes moved in a 2km by 2km square. The initial placement of nodes was random. Node movement was determined by a random waypoint mobility model. Nodes moved at a speed distributed uniformly between 0-4m/sec. Each node communicated with a group of five other nodes during the simulation runs. Four of these nodes were randomly chosen within the communication radius and one was chosen beyond the radius at the initial node placement stage. The network stack of the nodes in the simulation was configured as follows. All nodes used a simple TDMA-based MAC protocol. Each node was expected to receive 1/50 of the timeslots for its use. The idea was to approximate the worst-case scenario where all the nodes were in the broadcast range of each other. This assumption, though conservative, did not deviate much from the expected theoretical throughput of mobile ad hoc networks as reported in [4]. AODV [5] was used as the ad hoc routing protocol. The model implemented DiffServ with 13 DiffServ queues/classes, in addition to Best Effort (BE). Among the 13 queues nine were Expedited Forwarding (EF) queues scheduled by a priority queuing algorithm; four were Assured Forwarding (AF) queues scheduled by a weighted fair queuing (WFQ) algorithm. The WFQ scheduler was given a priority lower than that of EF9, the lowest among the EF queues. The weights assigned to AF4, AF3, AF2, and AF1 queues were 30%, 25%, 20%, and 15%, respectively. The queues were implemented as ns2 C++ objects that could be configured from Tcl. This split allowed us to easily change the configuration of queues, but still benefit from the execution speed of C++ in simulation. During the simulation initialization, each mobile node was configured to use a DiffServ queue as its packet interface queue. Each of the queues had a separate policer that shaped the traffic transiting the queue. The policer on the EF queues used a token bucket with a configurable rate and maximum size. Any incoming packet that would cause the token bucket to overflow was dropped. AF and BE queues were not policed. A QoS assurance solution for mobile ad hoc networks [11] was included in the simulation. It included an admission control component functioning
as a Bandwidth Broker and decided whether QoS requests (on a per-flow basis) should be admitted or not. This decision was based on a Measurement-Based Access Control (MBAC) approach that estimates the congestion status of the path between the sending and receiving nodes. The solution also included a quality adjustment component that preempted existing flows by downgrading them to BE as needed to adapt to dynamically changing network conditions. The two functions of the QoS assurance solution were implemented as part of a Tcl object called platform manager. During simulation initialization, a platform manager was created to represent each node in the network. During simulation execution, these platform managers started UDP flows as specified in the scenario’s communication traffic patterns description. An AF flow was three times more likely to be generated than an EF flow. EF flows belonging to different EF classes (EF3-EF9) had equal probability of being generated. EF1 and EF2 classes were used for network control (e.g., routing) and management traffic (e.g., QoS feedback messages). Therefore, the traffic patterns profile did not have any EF1 or EF2 flows. The data rate of a flow was constant in a simulation run. The flow durations were in the range of 500 and 1000 seconds, following a uniform distribution. The flow starting rate for a node was one flow every 12 seconds to create a heavily congested network scenario. The generated traffic was close to the capacity of the MAC layer. We created bandwidth contention in this multi-hop mobile ad hoc network simulation so that QoS settings affected flow performance. The results reported in this paper were obtained using a Panta Matrix System [6]. The Panta system was a 32processor system that used AMD Opteron 846 processor at a clock frequency of 2 GHz. The system had 64GB memory. We used 8 processors in this study. Each simulation ran on an independent processor, but all the simulation agents shared a common file system. Red Hat Linux Enterprise 10 was the operating system. Table 1. The experiment setup for DiffServ classes Class Index Stringency Class Index Stringency
AF1 0 0.8 EF9 4 0.90
AF2 1 0.8 EF8 5 0.90
AF3 2 0.85 EF7 6 0.90
AF4 3 0.85 EF6 7 0.90
EF5 8 0.95
EF4 9 0.95
EF3 10 0.95
The study was focused on generating the optimal bucket sizes for the EF queues. The indices assigned to the EF and AF classes are listed in Table 1. The rows
marked ‘Stringency’ are settings referenced by the admission control and quality adjustment components to decide at what point loss due to congestion warrants action such as flow preemption/rejection. For example, if a node sees that the admitted EF4 flows lost more than 5% (1-0.95) of their packets, it adjusts the estimate of network congestion status and possibly also downgrades some already admitted EF4 flows. In addition, any further incoming EF4 flow requests are rejected until network conditions improve. See [11] for more detail of the modeled QoS assurance functions. Based on the indices given in Table 1, we defined the following utility function for the DiffServ class i to measure the performance of using a set of queue bucket sizes in simulation runs: Ui = (Nai /(Nai +Nri +Ndi )) * (Nsi /Nai ) * Si, (2) where Nai : # alive flows at the time of observation, Nri: # rejected flows in an observation period, Ndi : # downgraded flows in an observation period, Nsi: # satisfied flows at the time of observation, Si : stringency constant of the class i. The rationale for choosing the above utility function is given below. Ui is comprised of three components. The first component, Nai/(Nai +Nri +Ndi ), represents the alive flow ratio in an observation period. It is included to ensure high utility will not be attained by excessive rejection of new flow requests or by downgrading admitted flows. The second component, Nsi/Nai, measures the ratio of the satisfied flows over the alive (admitted) flows. The third component, Si, considers that “satisfaction” for traffic belonging to classes with high stringency values (of higher priority classes) is harder to achieve, and therefore provides a factor that accounts for this in the utility calculation by providing a benefit. Note that with this formula the utility would be normalized in the range [0, 1]. Equation (2) represents the utility obtained by a single DiffServ class i. With the assumption that the traffic in a higher priority class should contribute more to the overall utility than that in a lower priority class, we apply an exponential weight schedule, Wi = 2i, where i is the index of a DiffServ class, to the individual utilities for each class. The resulting overall utility function aggregating the utility values over all DiffServ classes, and it is represented as: U = Σ Wi * Ui.
5. Results
run, there were still some significantly worse utility values. This can be attributed to ASA’s behavior. The heuristic converges very quickly, but still allows random variation to avoid the possibility of being stuck with a local optimum.
The above case study was performed with multiple scenarios for a number of missions. Given the use of a mobility model, the average number of hops between a sender and a receiver was found to be ~1.5. The results obtained from different scenarios shared some common traits. Due to space constraints, we present and discuss a small subset of the results below. .
6.
Conclusions
This paper described the architecture of an automated policy generation system. The system was designed to take network model and objectives as input and generate network configuration parameters as output. The approach has been implemented and a case study on a sample DiffServ QoS problem was performed. Near-optimal DiffServ token bucket sizes were generated as output. We believe that automatic generation of management policies for mobile ad hoc networks is essential, and our work showcases a promising approach to achieve this goal.
7. Figure 3. Utility values of EF classes
We would like to thank U.S. Army PM FCS (BCT) Technologies for their support of this study.
The utility Ui of the EF classes (EF3 – EF9) is shown in Figure 3. The duration of this particular simulation run was 2000 seconds. It took about 9 minutes for an agent to finish one simulation task. By the use of admission control and quality adjustment functions, the average utility across the EF classes was smoothed out, except for EF9, whose low priority severely affected the EF9 flows.
8. [1]
[2]
Utility 800
[3]
700 600 500 400
util
300
[4] [5]
200 100 0 1 11 21 31 41 51 61 71 81 91 101 111 121 131 141 151 161 171 181 191 201 211 221 231 241 251 261 271 281 291 301 311 321 331 341 351 361 371 381 391 401 411 421 431 441 451 461
Figure 4. Utility values of the tasks in a scenario
The overall utility as a function of task (simulation run) indices is shown in Figure 4. After 417 simulation runs over 22 hours, the optimization engine reported a token bucket size setting with a utility of 720. However, after only 66 simulation runs (roughly 3 hours) the optimization engine had already found a configuration setting whose utility was within 97% of the reported value in the end. This result indicated that for this case study, the optimization engine could arrive at a good setting quickly. Note that even after the 66th
Acknowledgements
[6] [7] [8] [9] [10] [11]
References R. Chadha, Y-H Cheng, C. Chiang, S. Li, G. Levin, and A. Poylisher, “Policy-based Mobile Ad Hoc Network Management”, Proc. Of the 5th IEEE Itnl. Workshop on Policy for Distributed Systems and Networks, June 2004. R. Chadha, Y-H Cheng, C. Chiang, S. Li, G. Levin, and A. Poylisher, L. LaVergne and S. Newman, “Scalable Policy Management for Ad Hoc Networks”, MILCOM 2005, Atlantic City, NJ, Oct. 17-20, 2005 C. Chiang et al., “Performance Analysis of DRAMA: A Distributed Policy-based System for MANET Management”, Milcom 2006, Washington, DC, Oct. 23-25, 2006. J. Li, C. Blake, D. S. J. De Couto, H. I. Lee, and R. Morris, “Capacity of Ad Hoc Wireless Networks”, MobiCom, 2001. C. E. Perkins, Ad Hoc Networking. New York: AddisonWesley, 2001 Panta Matrix System. http://www.pantasys.com The Network Simulator--ns2. http:// www.isi.edu/nsnam/ns/ S. Kirkpatrick, C. D. Gelatt, Jr., M.P. Vecchi, “Optimization by Simulated Annealing”, Science, Number 4598, 13 May 1983. L. Ingber, “Very Fast Simulated Re-Annealing”, J. Math Computational Modeling, Vol. 12, pp. 967-973, 1989. RFC 2475, “Architecture for Differentiated Services”, December 1998 A. Poylisher, F. Anjum, L. Kant and R. Chadha, “QoS Mechanisms for Opaque MANETs”, MILCOM 2006, Washington, DC, Oct. 23-25, 2006.