of the rectangle is related to the number of multiple paths between a ... In particular, multiple paths .... with respect to the angle θ at which paths diverge at the.
On Load Balancing in a Dense Wireless Multihop Network Esa Hyytiä†,‡
Jorma Virtamo‡
Centre for Quantifiable Quality of Service in Communication Systems Norwegian University of Science and Technology O.S. Bragstads plass 2E, N-7491 Trondheim, Norway
Networking Laboratory Helsinki University of Technology P.O. Box 3000, FIN 02015 TKK, Finland
Abstract— We study the load balancing problem in a dense wireless multihop network, where a typical path consists of large number of hops, i.e., the spatial scales of a typical distance between source and destination, and mean distance between the neighbouring nodes are strongly separated. In this limit, we present a general framework for analysing the traffic load resulting from a given set of paths and traffic demands. We formulate the load balancing problem as a minmax problem and give two lower bounds for the achievable minimal maximum traffic load. The framework is illustrated by an example of uniformly distributed traffic demands in a unit disk with a few families of paths given in advance. With these paths we are able to decrease the maximum traffic load by factor of 33 − 40% depending on the assumptions. The obtained traffic load level also comes quite near the tightest lower bound.
I. I NTRODUCTION In a dense wireless multihop network a typical path consists of several hops and intermediate nodes along a path act as relays. In this paper we focus on studying the traffic load in such a network. By traffic load we mean, roughly speaking, the rate at which packets are transmitted in the proximity of a given node, and the objective of load balancing is to find such paths that minimise the maximum traffic load in the network. In particular, we assume a strong separation in spatial scales between the macroscopic level, corresponding to a distance between the source and destination nodes, and the microscopic level, corresponding to a typical distance between the neighbouring nodes. This assumption justifies modelling the routes on the macroscopic scale as smooth geometric curves as if the underlying network fabric formed a homogeneous, continuous medium. The microscopic scale corresponds to a single node and its immediate neighbours. At this scale the above assumptions imply that only the direction in which a particular packet is traversing is significant. In particular, considering one direction at a time there exists a certain maximum flow of packets a given MAC protocol can support (packets per unit time per unit length, “density of progress”). Generally, this maximal sustainable directed packet flow depends on the particular MAC protocol defining the scheduling rules and possible coordination between the nodes. Determining the value of this † This
work was completed while Esa Hyytiä was with the Networking Laboratory of Helsinki University of Technology. ‡ This work has been funded by the Finnish Defence Forces Technical Research Center and by the Academy of Finland (grant n:o 202204).
maximum is not a topic of this paper but is assumed to be given (known characteristic constant of the medium). By a simple time sharing mechanism this maximal value can be shared between flows propagating in different directions. As a result, the scalar or total flux (to be defined in Section II) of packets is bounded by the given maximum, and the load balancing task is to determine the paths in such a way that the maximum flux is minimised. Under the assumption of a dense multihop network the shortest paths (SP) are approximately straight line segments [1]. Straight paths yield an optimal solution in terms of mean delay when the traffic demands are low and there are no queueing delays. However, they typically concentrate significantly more traffic in the centre of network than elsewhere, and as the traffic load increases the packets going through the centre of the network start to experience queueing delays and eventually the system becomes unstable when the maximal sustainable scalar flux is exceeded. Hence, the use of shortest paths limits the capacity of the multihop network unnecessarily and our task is to minimise the maximum packet flux in the network by a proper choice of paths on the macroscopic scale. Our main contribution is the formulation of the traffic load and the corresponding load balancing problem in a dense multihop network. For the load balancing problem we provide two lower bounds. Further, we show how the scalar flux can be calculated for a given set of curvilinear paths. Even though the results are valid only in the limit of a dense network (i.e., a large number of nodes and a small transmission range), they give insight and can serve as useful approximations for more realistic scenarios. The rest of the paper is organised as follows. In Section II we present the necessary mathematical framework. In Section III two lower bounds for the achievable traffic load level are presented. In Section IV the general expressions for the traffic load with curvilinear paths are derived. In Section V we demonstrate the load balancing in unit disk with three different path sets yielding a better performance than the shortest paths in terms of maximum traffic load. Section VI contains our conclusions. A. Related work In [1] Pham et al., and later in [2] Ganjali et al., have studied the load balancing using multipath routes instead of shortest paths. The analysis is done assuming a disk area and
a high node density so that the shortest paths correspond to straight line segments. In multipath situation the straight line segments are replaced by rectangular areas where the width of the rectangle is related to the number of multiple paths between a given pair of nodes. In particular, multiple paths are fixed on both sides of the shortest path. In [3] Dousse et al. study the impact of interference on the connectivity of large ad hoc networks. They assume an infinite area and the behaviour of each node to be independent of the other nodes, which, together with interference assumptions, defines the stochastic properties for the existence of links. With these assumptions the authors study the existence of a gigantic component, which is related to the network connectivity. In [4] Sirkeci-Mergen et al. study a dense wireless network with cooperative relaying, where several nodes transmit the same packet simultaneously in order to achieve a better signal-to-noise ratio. In the analysis an infinitely long strip is studied and the authors are able to identify a so-called critical decoding threshold for the decoder, above which the message is practically transmitted to any distance (along the strip). The analysis assumes a dense network similarly as in this paper. In a dense network with shortest path routing the transmission of each packet corresponds to a line segment in the area of the network. A line segment process with uniformly distributed end points is similar to the so-called random waypoint (RWP) mobility model commonly used in studies of wireless ad hoc networks [5], [6], [7], [8]. In the RWP model the nodes move along straight line segments from one waypoint to the next and the waypoints are assumed to be uniformly distributed in some convex domain. The similarity between the RWP process and the packet transport with the shortest path routes is striking and we can utilise the readily available results from [11] in this case. For curvilinear paths the situation, however, is more complicated and the new results derived in the present paper allow us to compute the resulting scalar packet flux (i.e., traffic load). II. P RELIMINARIES In this section we introduce the necessary notation and definitions for analysing the transport of the packets and the resulting traffic load in the network. Let A denote the region where the network is located and A the area of A. The packet generation rate corresponding to traffic demand density is defined as follows. Definition 1 (traffic demand density) The rate of flow of packets from a differential area element dA about r1 to a differential area element dA about r2 is λ(r1 , r2 )·dA2 , where λ(r1 , r2 ) is called the traffic demand density. Remark 1 The total packet generation rate is given by Z Z 2 Λ = d r1 d2 r2 λ(r1 , r2 ). A
A
Each generated packet is transferred along a certain multihop path. More formally,
Definition 2 Set of paths denoted by P defines for all source destination pairs (r1 , r2 ) a unique path p ∈ P. Remark 2 The mean path length, i.e., the mean distance a packet travels, is given by Z Z 1 2 `= d r1 d2 r2 λ(r1 , r2 ) · s(P, r1 , r2 ), Λ A
A
where s(P, r1 , r2 ) denotes the distance from r1 to r2 with path set P. Example 1 For the shortest paths we have Z Z 1 `sp = d2 r1 d2 r2 λ(r1 , r2 ) · |r2 − r1 |. Λ A
(1)
A
Probably the most important quantity for our purposes is the packet arrival rate into the proximity of a given node. This is described by the notion of scalar flux, which in turn is defined in terms of the angular flux. These are similar to corresponding concepts of particle fluxes in physics, e.g., in neutron transport theory [10]. In our case, the packet fluxes depend on the traffic demand density λ(r1 , r2 ) and the chosen paths P, and are defined as follows: Definition 3 (angular flux) Angular flux of packets at r in direction θ, denoted by Φ(r, θ) = Φ(P, r, θ), is equal to the rate [1/s/m/rad] at which packets flow in the angle interval (θ, θ + dθ) across a small line segment of the length dx perpendicular to direction θ at point r divided by dx · dθ in the limit dx → 0 and dθ → 0. Definition 4 (scalar flux) Scalar flux of packets [1/s/m] at r is given by Z2π Φ(r) = Φ(P, r) = Φ(P, r, θ) dθ. 0
With the above notation we can formulate the optimisation problem. Definition 5 (load balancing problem) Find such a set of paths, Popt , that minimises the maximum scalar flux, Popt = arg min max Φ(P, r). P
r
Remark 3 (optimal maximum traffic load) With the load balanced paths the maximum load is Φopt = max Φ(Popt , r) = min max Φ(P, r). r
P
r
(2)
In Def. 5 one needs the scalar flux Φ(P, r). In Section IV we will show how this can be calculated for a given set of paths P. The remaining problem of finding the optimal paths is a difficult problem of calculus of variation. In this paper, we do not search for a general solution but rather study three heuristically chosen families of paths and compare their performance with that of the shortest paths and with the bounds introduced in the next section.
Another bound is obtained by considering traffic flows crossing an arbitrary boundary (cf., cut bound in wired networks).
h
dθ
Proposition 2 (cut bound) For any curve C which separates the domain A into two disjoint subdomains A1 and A2 it holds that Z Z 1 2 d r1 d2 r2 (λ(r1 , r2 ) + λ(r2 , r1 )) , Φopt ≥ L
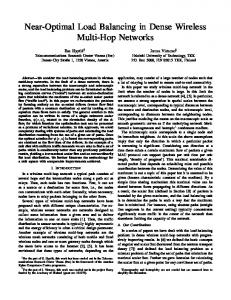
w Fig. 1.
Cumulative progress in a small square.
III. L OWER BOUNDS
FOR PACKET FLUX
A1
Our next goal is to derive two lower bounds for achievable load balancing, i.e., for a given traffic demand density λ(r1 , r2 ) we want to find bounds for the minimum of the maximal traffic load that can be obtained by a proper choice of paths. Let us start with two preparatory remarks that give additional characterisations of the scalar flux. Remark 4 Scalar flux of packets is equal to the rate at which packets enter a disk with diameter d at point r divided by d in the limit when d → 0. The proof follows trivially from the definitions. Note that Remark 4 justifies the interpretation of the scalar packet flux as a measure of spatial traffic load. Remark 5 (density of cumulative progress rate) Scalar flux Φ(r) can also be interpreted as the cumulative progress [m] of packets per unit time [s] per unit area [m2 ] about point r (rendering 1/s/m as its dimension). Proof: Consider the packet flux within a small angle interval dθ entering a square from the left side as illustrated in Fig. 1. According to Def. 3, the rate of such packets is Φ(r, θ) · h · dθ. The same flow departs the square from the right side. Thus, inside the square the cumulative progress per unit time (for packets moving within the angle interval dθ) is Φ(r, θ) · h · dθ · w. Per unit area the above yields Φ(r, θ) dθ. Integrating over θ then gives that Φ(r) corresponds to the cumulative progress per unit time and unit area. Proposition 1 (distance bound) Λ·` . (3) A Proof: The cumulative progress rate in the whole area is obviously Λ · `. Thus, the right hand side equals the average density of progress rate, i.e., the average scalar flux. max Φ(P, r) ≥
A2
where L is the length of the curve C and the double integral gives the total rate at which packets cross the curve C (both directions included). Proof: Consider first a short line segment ds at r at some point along the curve C. Let γ denote a direction perpendicular to the curve at r such that the packets arriving from the angles (γ −π/2, γ +π/2) cross ds from outside to inside, and packets arriving from (γ + π/2, γ + 3π/2) cross ds from inside to outside. The rate λ(r) ds at which packets move across ds is given by Zπ/2 λ(r) ds = cos α (Φ(r, γ+α)+Φ(r, γ+α+π)) dα ds. −π/2
As 0 ≤ cos α ≤ 1 for −π/2 ≤ α ≤ π/2 we get Zπ/2 Φ(r, γ + α) + Φ(r, γ + α + π) dα ds
λ(r) ds ≤ −π/2
= Φ(r) ds ≤ max Φ(x) ds. x∈A
Integrating over the curve C completes the proof. IV. PACKET
FLUX WITH CURVILINEAR PATHS
In this section, unless stated otherwise, we assume uniform traffic demand density and a single path p(r1 , r2 ) between source and destination locations r1 and r2 . We make the assumption of uniformity mainly for notational simplicity. It is easy to generalise the results for any distribution. Moreover, we assume that the paths in P satisfy the so-called path continuity constraint:
r
Remark 6 Combining (2) and (3) we have Φopt ≥
Λ min `. A P
It is obvious that the minimum of ` is obtained when P consists of the shortest paths. Denoting the corresponding mean path length by `sp , cf. Eq. (1), we get Φopt ≥
Λ · `sp . A
(4)
Definition 6 (path continuity) If r ∈ p(r1 , r2 ), then p(r1 , r2 ) = p(r1 , r) + p(r, r2 ). The above definition lets us characterise the paths according to the direction at some point x. In particular, the routing decision made in each point depends only on the destination of the packet, not the source. Let p(x, θ) denote a path going through point x and having a direction θ at that point. The points along the curve (assumed to be smooth) are denoted by p(x, θ, s),
where s ∈ [−a1 , a2 ], and a1 , a2 > 0,
so that p(x, θ, 0) = x. Thus, a1 and a2 denote the distance to the boundary along the path in opposite directions. Note
that this means that we limit ourselves to paths that start and end at the boundary of the domain (no closed paths within the domain allowed). Definition 7 (path divergence) Let h(x, θ, s) denote the rate with respect to the angle θ at which paths diverge at the distance of s, |p(x, θ + dθ, s) − p(x, θ, s)| dθ→0 dθ ∂ = p(x, θ, s) . ∂θ
h(x, θ, s) = lim
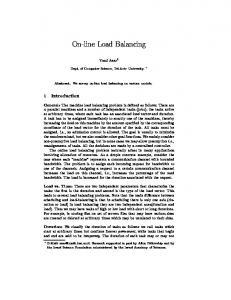
Proposition 3 (angular flux with curvilinear paths) For uniform traffic demand density, λ(r1 , r2 ) = Λ/A2 , the angular flux at point x in direction θ is given by Za1 Za2 h(x, θ, −s0 ) Λ h(x0 , θ0 , s+s0 ) ds ds0 , (5) Φ(x, θ) = 2 A h(x0 , θ0 , s0 ) 0
0
0
where x = p(x, θ, −s ) and θ is the direction of the path at x0 (see Fig. 2). Proof: Without loss of generality we may assume Λ = 1. Assume that a particular source is located in a differential area element about point x0 (see Fig. 2 left) x0 = p(x, θ, s0 ),
s0 ≤ 0,
dθ
dθ 0 ds11111 00000
11111 00000 00000 11111 00000 0 11111 00000x 11111
x
θ0
x0
p(x0 , θ0 , s − s0 ) = p(x, θ, s). Let dθ denote a differential angle at x. The differential source area about x0 is given by (see Fig. 2 left) 0
As = h(x, θ, s ) · dθ · ds . Similarly, let dθ denote a small angle at point x0 , which yields a destination area of Za2 Ad = h(x0 , θ0 , s − s0 ) ds dθ0 , 0
as illustrated in Fig. 2 (right). The height of the “target line segment” perpendicular to the path at point x is hx = h(x0 , θ0 , −s0 ) · dθ0 . Thus, the contribution to the angular flux from the differential source area As about x0 is As · Ad dΦ = 2 A · dθ · h� x � 1 1 1 · = 2· · A dθ h(x0 , θ0 , −s0 ) · dθ0 � Za2 � 0 0 h(x, θ, s ) · dθ · ds · h(x0 , θ0 , s − s0 ) ds dθ0 Za2 0
θ0
x
Fig. 2.
Derivation of expression (5) for the scalar flux.
Consequently, the angular flux at x in direction θ is given by 1 Φ(x, θ) = 2 A
Z0 −a1
h(x, θ, s0 ) h(x1 , θ0 , −s0 )
Za2 h(x0 , θ0 , s−s0 ) ds ds0 . 0
The proposition follows upon substitution s0 ← −s0 . Remark 7 (angular flux with non-uniform λ(r1 , r2 )) It is straightforward to generalise (5) to the case of non-uniform traffic demand density λ(r1 , r2 ). In this case, the angular flux at x in direction θ is given by Za1 Za2
0
h(x, θ, −s0 ) · h(x0 , θ0 , s0 )
λ(x0 , p(x0 , θ0 , s+s0 )) · h(x0 , θ0 , s+s0 ) ds ds0 .
0
0
0
1 h(x, θ, s0 ) · · 2 A h(x0 , θ0 , −s0 )
11111111111111111 00000000000000000 00000000000000000 11111111111111111 00000000000000000 11111111111111111 00000000000000000 11111111111111111 00000000000000000 11111111111111111 θ 00000000000000000 11111111111111111 00000000000000000 11111111111111111
0
As
Φ(x, θ) =
for which it clearly holds that
=
θ
0
0
Ad 00000000000000000 11111111111111111 00000000000000000 11111111111111111 h11111111111111111 x 00000000000000000
0
h(x0 , θ0 , s − s0 ) ds ds0 .
Example 2 (shortest paths) For the shortest paths h(x, θ, s) = |s|, and the angular flux is given by Za1 Za2 Φ(x, θ) = 0
λ(r1 , r2 ) · (s + s0 ) ds ds0 ,
0
0
where r1 = r − s eθ , and r2 = r + s eθ , with eθ denoting the unit vector in direction θ. Consequently, for uniform traffic demand density, Λ Φ(x, θ) = 2 A
Za1 Za2 Λ (s+s0 ) ds ds0 = a1 a2 (a1 +a2 ), 2A2 0
0
in accordance with the result on RWP model in [9]. V. U NIT
DISK WITH UNIFORM TRAFFIC DEMANDS
In this section we will demonstrate how the proposed framework can be applied. To this end, we consider a special case of a unit disk with uniform load, A = {r ∈ R2 : |r| < 1}, and, λ(r1 , r2 ) = Λ/π 2 .
source
1
Rout source, As target dθ d
Rin SP
0.8 SP
Rout
0.6 θ
0.4
destination destinations, Ad
SP + Rout Rin
0.2 0.2
0.4
0.6
0.8
1
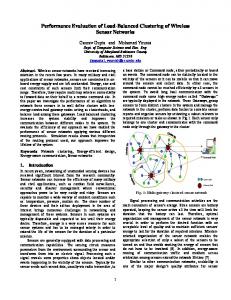
Fig. 3. Left figure illustrates the three path sets considered: straight line segments (SP), radial paths with outer (Rout) and inner (Rin) angular ring transitions. The middle figure illustrates the derivation of the angular ring flux at the distance d for Rout paths. In the figure on right the resulting flux is plotted for the three path sets (SP, Rout and Rin) and for a randomised combination of SP and Rout (dashed curve) as a function of distance d from the centre.
We study the performance of three simple families of paths: outer and inner radial ring paths and circular paths. The performance of these path sets is compared with that of the shortest paths, and with the appropriate lower bounds for the minimal maximum traffic load.
Example 6 (cut bounds for unit disk) Let us consider two curves, a diameter C1 separating the unit disk into two semicircles, and a concentric circle C2 with radius d, 0 < d < 1. For the packet rate λ1 across C1 it holds that λ1 ≥ Λ/2, and Φopt ≥
Example 3 (shortest paths for unit disk) For transport according to the straight line segments we can rely on the results for the RWP model (see [11]). Accordingly, the scalar flux at distance d is given by 2(1 − d2 ) · Λ Φsp (d) = π2
Zπ p 1 − d2 cos2 φ dφ. 0
2 · Λ ≈ 0.637 · Λ. π
(6)
Example 4 (distance bound for unit disk) The distance bound gives a relationship between the obtainable maximum load and the mean path length. With shortest paths we have `sp = 128/45π which upon substitution in (4) yields Φopt ≥
Similarly, the packet rate across C2 is bounded by λ2 (d) ≥ 2d2 (1−d2 ) · Λ, which corresponds to radial flux Φr (d) =
d − d3 2d2 (1 − d2 ) ·Λ = · Λ. 2πd π
By the cut bound we have Φopt ≥ Φr (d). The tightest lower bound is obtained by maximising Φr (d) with respect to d, √ 2 · Λ ≈ 0.123 · Λ. Φopt ≥ Φr (1/ 3) = √ 3 3·π
In particular, the maximum flux is obtained at the centre, Φsp (0) =
Λ = 0.25 · Λ. 4
Λ · 128 ≈ 0.288 · Λ. 45π 2
Example 5 (greatest sensible mean path length) With the aid of (6) we can write the distance bound (3) in terms of Φsp , max Φ(P, r) ≥ Φsp · `/2. r
Shortest paths are not optimal set of paths for uniform traffic demand density. But the above relation says that in searching for a better set of paths (which necessarily has ` ≥ `sp ) one can outright reject such path sets for which ` > 2 since for them the maximal scalar flux surely is greater than that for the shortest paths. That is, in order to lower the maximal flux one has to bend the paths away from the loaded region but without increasing the mean length of the paths too much at the same time.
We see that in the case of uniform traffic demand density the distance bound provides the tightest lower bound for the solution of the minmax problem (2). A. Radial ring paths Let us consider next the three actual path sets illustrated in Fig. 3. The shortest paths (SP) are equivalent to RWP model as has been already mentioned. The two radial path sets, referred to as “Rin” and “Rout”, are similar in the sense that each path consists of two sections. One section is a radial path towards (or away from) the origin, and the other section is an angular path along a ring with a given radius. The difference between the two sets is the order of sections, “Rout” uses the outer angular rings and “Rin” the inner ones, as the names suggest. Note that locally, at any point, the packets are transmitted only in 4 possible directions (2 radial and 2 angular), which may simplify the possible implementation of the time division multiplexing. When studying the arrival rate into a small area at the distance of d from the origin one needs to consider both radial and angular ring movement. The radial component of the flux is the same for both path sets, i.e., Φr (d) =
d − d3 · Λ. π
(7)
1 0.8 SP
0.6 circular
0.4 0.2 0.2
0.4
0.6
0.8
1
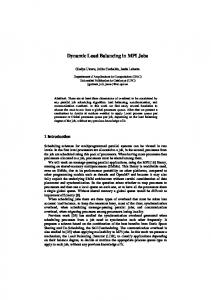
Fig. 4. Circular paths are paths formed by the circumferences of circles which cross the unit disk at the opposite points. The figure on right illustrates the resulting scalar flux Φ(d) (y-axis) for both circular and shortest paths (SP) as a function of distance d from the centre (x-axis).
1) Outer radial ring paths: Let us next consider outer radial ring paths. We want to determine the flux along the ring at the distance of d. To this end, consider a small line segment from (−d, 0) to (−d − ∆, 0) as the target line segment, as illustrated in Fig. 3 (middle). Packets originating from a small source area As at the distance of d in direction θ travel through the target line segment if their destination is in the destination area Ad . The size of the source area is As = d · ∆ · dθ, while the possible destination area is d2 θ · πd2 = · θ. 2π 2 Combining the above with λ = Λ/π 2 , and taking into account the symmetries, gives the angular flux at the distance of d, Zπ 2 4Λ d · θ · ∆ dθ = d3 · Λ. Φθ (d) = ∆ π2 2 Ad =
0
Hence, the total flux at the distance d for the outer path set is given by (π − 1)d3 + d · Λ. π The maximum flux is obtained at point d = 1, ΦRout (d) = Φr (d) + Φθ (d) =
ΦRout (1) = Λ. 2) Inner radial ring paths: For inner paths the possible destination area of packets is (1 − d2 )/2 · θ, and we have, 4Λ Φθ (d) = ∆ · π2
Zπ 0
1 − d2 · θ · d · ∆ dθ = (d − d3 ) · Λ. 2
Combining the above with (7) gives (π + 1)(d − d3 ) · Λ. π √ The maximum is obtained at point d = 1/ 3, √ ΦRin (1/ 3) ≈ 0.507 · Λ. ΦRin (d) =
Hence, the outer version leads to a higher maximum load than the shortest paths while the inner version yields a slightly better solution. The resulting packet fluxes are illustrated in Fig. 3 (right) as a function of the distance d from the centre. B. Circular paths As the last path set we consider curvilinear paths, referred to as circular paths, which consist of such sections of circumference of circles that cross the unit disk at the opposite points as illustrated in Fig. 4 (left). From the figure it can be seen that these paths smoothly move some portion of the traffic away from the centre of the area. The angular flux can be calculated using Proposition 3, and the scalar flux is obtained by integration (cf., Def. 4). The resulting scalar flux is depicted in Fig. 4 (right). It can be seen that the traffic load is fairly well distributed in the area. The maximum flux is obtained at the centre of the disk, where the flux is 0.424. In fact, it is possible to determine the packet flux at the centre analytically (see Appendix). For this we have 4 · Λ ≈ 0.424 · Λ, 3π which is exactly 2/3 of the packet flux with the shortest paths (cf., Ex. 3) and is also smaller than the maximal scalar fluxes with the ring paths. Φ(0) =
C. Randomised path selection approach One option to achieve a lower maximum load is to allow the use of several paths for each pair of nodes (similarly as in [1], [2]). In particular, let us relax our assumptions and allow a finite number of path sets {Pi }, where i = 1, . . . , n. Upon transmission of a packet the source node chooses a path from path set Pi with probability of pi , i = 1, . . . , n. Remark 8 (packet flux with randomised path sets) Randomised path upon transmission selection from path sets {Pi } with probabilities pi , i = 1, . . . , n, yields a scalar packet flux of X pi · Φ(Pi , r). Φ(r) = i
Example 7 Consider uniform traffic demand density in unit disk and two path sets, 1) shortest paths, and 2) the outer radial
paths. Weights p1 = 0.61 and p2 = 0.39 give a packet flux of Φ(d) = 0.61 · Φsp (d) + 0.39 · ΦRout (d). The resulting flux is almost constant as illustrated by the dashed line in Fig. 3. The maximum is 0.397 · Λ. The same technique can be taken further, e.g., by combining all three path sets as follows Φ(d) = 0.52 · Φsp (d) + 0.37 · ΦRout (d) + 0.11 · ΦRin (d), which gives a maximum flux of 0.379 · Λ. VI. C ONCLUSIONS In this paper we have presented a general framework for analysing traffic load and routing in a large dense multihop network. The approach relies on strong separation of spatial scales between the microscopic level, corresponding to the node and its immediate neighbours, and the macroscopic level, corresponding to the path from the source to the destination. In a dense wireless network with this property the local traffic load can be assimilated with the so-called scalar packet flux. The packet flux is bounded by a maximal value that the network with a given MAC and packet forwarding protocol can sustain. The packet flux depends on traffic demand density λ(r1 , r2 ) and the chosen set of routing paths P. The load balancing problem thus comprises of determining the set of routing paths such that the maximal value of the flux in the network is minimised. While the general solution of this difficult problem remains for future work, our main contribution in this paper consists of giving bounds for the packet flux and giving a general expression for determining the packet flux at a given point for a given set of curvilinear paths. The results are illustrated by numerical examples with three different sets of paths in unit disk. Future work also includes investigating how to find nearly optimal load balancing in a distributed fashion. R EFERENCES [1] Peter P. Pham and Sylvie Perreau, “Performance analysis of reactive shortest path and multi-path routing mechanism with load balance,” in Proc. of IEEE Infocom ’03, San Francisco, USA, March-April 2003, vol. 1, pp. 251–259. [2] Yashar Ganjali and Abtin Keshavarzian, “Load balancing in ad hoc networks: Single-path routing vs. multi-path routing,” in Proc. of IEEE Infocom ’04, Hong Kong, Mar. 2004. [3] Olivier Dousse, François Baccelli, and Patrick Thiran, “Impact of interferences on connectivity in ad hoc networks,” IEEE/ACM Trans. Networking, vol. 13, no. 2, pp. 425–436, Apr. 2005. [4] Birsen Sirkeci-Mergen and Anna Scaglione, “A continuum approach to dense wireless networks with cooperation,” in Proc. of IEEE Infocom ’05, Miami, FL, USA, 2005. [5] David B. Johnson and David A. Maltz, “Dynamic source routing in ad hoc wireless networks,” in Mobile Computing, vol. 353, pp. 153–181. Kluwer, 1996, Chapter 5. [6] C. Bettstetter and C. Wagner, “The spatial node distribution of the random waypoint mobility model,” in Proc. of German Workshop on Mobile Ad Hoc networks (WMAN), Ulm, Germany, Mar. 2002. [7] Christian Bettstetter, Giovanni Resta, and Paolo Santi, “The node distribution of the random waypoint mobility model for wireless ad hoc networks,” IEEE Trans. on Mobile Computing, vol. 2, no. 3, pp. 257– 269, July–September 2003.
[8] W. Navidi and T. Camp, “Stationary distributions for the random waypoint mobility model,” IEEE Trans. on Mobile Computing, vol. 3, no. 1, pp. 99–108, January-March 2004. [9] Esa Hyytiä, Pasi Lassila, and Jorma Virtamo, “Spatial node distribution of the random waypoint mobility model with applications,” IEEE Trans. on Mobile Computing, 2005, accepted for publication. [10] G.I. Bell and S. Glasstone, Nuclear Reactor Theory, Reinhold, 1970. [11] Esa Hyytiä and Jorma Virtamo, “Random waypoint mobility model in cellular networks,” Wireless Networks, 2005, accepted for publication.
A PPENDIX A. Flux at the centre with circular paths In order to illustrate the framework and the steps involved we will next determine analytically the scalar packet flux at the centre of unit disk for the circular paths. Furthermore, a uniform traffic demand density is assumed. The situation is depicted in Fig. 5. For point z1 we get, p s0 · sin dθ = R · cos(dθ0 − dθ) − R2 − 1, s0 · cos dθ = R · sin(dθ0 − dθ). For small values of x we have √ 1 1 1 − x ≈ 1 − x. sin x ≈ x, cos x ≈ 1 − x2 , and 2 2 Thus, we get � � p 1 0 0 2 s · dθ = R · 1 − (dθ − dθ) − R2 − 1, 2 1 2 0 0 s · (1 − dθ ) = R · (dθ − dθ). 2 According to Fig. 5 dθ0 −dθ = s0 /R. Substituting that into former equation above yields � �2 1 s0 1 1 1 − s02 s0 · dθ = 1 − −1+ · 2 = , R 2 R 2 R 2R2 and consequently,
1 − s02 . 2R · s0 Hence, as dθ0 − dθ = s0 /R, we have dθ =
1 + s02 1 − s02 0 and dθ ≈ . 2Rs0 2Rs0 For the height of the “target line segment”, H, we have p 1 . H = R − R2 − 1 ≈ 2R The destination area is composed of the half segment A1 , 1 2 , A1 ≈ H ≈ 3 3R and the area of the sector A2 , dθ ≈
A2 =
1 − s02 dθ ≈ . 2 4Rs0
Consequently, Za2 1 h(x, θ0 , s + s0 ) ds = 0 (A1 + A2 ) dθ 0 � � 1 1 − s02 3 + 4s0 − 3s02 2Rs0 + . · ≈ ≈ 1 + s02 3R 4Rs0 6(1 + s02 )
Moreover, we have s0 · dθ = s0 , dθ 2Rs0 H 1 s0 · = . h(x, θ0 , s0 ) = 0 ≈ dθ 2R 1 + s02 1 + s02
h(x, θ, −s0 ) =
z1
Hence, 0
0
02
s · (1 + s ) h(x, θ, −s ) = = 1 + s02 , h(x, θ0 , s0 ) s0
=
Z1 0
Λ 6π 2
Z1
h(x, θ, −s0 ) h(x0 , θ0 , s0 )
Z1
A2
h(x0 , θ0 , s + s0 ) ds ds0
0
3 + 4s0 − 3s02 ds0 =
0
111111111111111 000000000000000 000000000000000 111111111111111 H A1 000000000000000 111111111111111 000000000000000 111111111111111 000000000000000 111111111111111 dθ
1
and the angular packet flux at the centre of the unit disk is Λ Φ(0, θ) = 2 A
dθ0 s0
h
2 · Λ. 3π 2
R dθ0 −dθ
Finally, the packet flux at the centre is given by Z2π Φ(0, θ) dθ =
Φ(0) = 0
4 · Λ ≈ 0.424 · Λ, 3π
which is exactly 2/3 of the packet flux with the shortest paths consisting of straight line segments (cf., Ex. 3).
Fig. 5. Notation used in the derivation of the packet flux with the circular paths at the centre of the unit disk.