Abstractâ Two general methods of multi-port network analyzer calibration are described using the classical SOLT model respectively the 7-term TXX model ...
ROHDE & SCHWARZ WORKSHOP , EUMC 2003, , OCTOBER 2003
1
Multi-Port Calibration Techniques for Differential Parameter Measurements with Network Analyzers Holger Heuermann, Committee Member, IEEE, MTT-11
Abstract— Two general methods of multi-port network analyzer calibration are described using the classical SOLT model respectively the 7-term TXX model which includes all linear errors of the network analyzer test-sets. The GSOLT-procedure supports vector network analyzers with n+1 measurement channels only to measure n-port devices with high accuracy. The GTXX-procedure requires network analyzers with 2 � n measurement channels and less calibration standard measurements. The error correction algorithms are both out-standing regarding the simplicity and numerical robustness. The algorithms also allow an easy programming of the calibration and enable the errorcorrected measurement of any device irrespective of the number of ports (1 to n). Results of numerical experiments attest the excellent precision of the GSOLT and the GTXX error procedure. The mathematical process to calculate from the multi-port measurements the differential mode parameter is shown. The limitations are discussed. Index Terms— Network analyzer, calibration, error-correction, multi-port, multi-mode, scattering parameter.
I. I NTRODUCTION N the one hand RF-electronics consumer products with multi-band applications are a growing market and on the other hand differential systems are coming up due to better noise and power behaviour. Both system trends result in the fact that the number of RF-ports is increasing. E.g., a standard antenna switch module for GSM-triple band applications has 9 RF-ports altogether. To measure these multi-port products with an adequate accuracy, a multi-port vector network analyzer is needed. Twoport network analyzers are well established. The hardware expansion to realize a multi-port network analyzer based on the concept of a two-port network analyzer is well known and produced by most manufacturers. Two-port vector network analyzers (VNAs) are realized as a three or a four measurement channel (so-called double reflectometer) concept. For multi-port VNAs based on double reflectometers, calibration procedures to correct all linear errors of the imperfect hardware set-up are well known [1]. However, the GSOLT calibration procedure is the first one for multi-port VNAs based on the cheaper three-channel concept. In practice, network analyzers with no exact working error correction procedure are useless.
O
This paper presents the generalization of the classical SOLT two-port procedure, which is the standard error correction for three-channel VNAs and double reflectometers, too. This This work was supported by Rohde & Schwarz, Munich. Prof. H. Heuermann is with the Univ. of Applied Sciences Aachen, Institute of High Frequency Technology.
GSOLT-procedure 1 allows accurate n-port measurements with vector network analyzers having only n+1 measurement channels. Additionally, this paper presents a very simple mathematical formulation to perform a multi-port calibration based on double reflectometers,the so-called GTXX-procedure 2. This procedure requires vector network analyzers with 2 � n measurement channels for a n-port measurement. This algorithm may include every known 7-term TXX- or LXX-procedure, e.g. TRL, LMR, or the general TAN method [2]. The way to perform a VNA error correction is: 1) Measurement of well-known calibration standards 2) Calculation of the error-coefficients = Calibration of the network analyzer 3) Measurement of an unknown device under test (DUT) 4) Error correction calculation of the DUT raw data by using the error-coefficients This article begins with a short description of the classical SOLT 5-term calibration procedure. The mathematical derivation of the GSOLT calibration process presents the calculation of the n � 3 error coefficients by using the reflection standards measurements. The missing n � (n-1) � 2 error coefficients can be calculated by using the transmission measurements. The second part of the mathematical derivation of the GSOLT-procedure is the novel and very simple error correction process. This very short mathematical solution is the key to perform multi-port error correction from 1 to n ports all with the same mathematical algorithm. The last theory section presents a very simple mathematical derivation of the GTXX multi-port VNA calibration and error correction by using the 2 � n measurement channel performance. The excellent conformity of the scattering parameters of multi-port verification standards generated by a virtual multiport VNA shows the system accuracy of both procedures. II. M ULTI -P ORT T HEORY For SOLT two-port measurements, error correction algorithms are published beginning with the 5-term procedure to detect ��� � and ��� � in an uni-directional way up to the 22-term procedure to detect all four scattering parameters of a two-port in a leakage-error system [3]. 1 The 2 The
name GSOLT is the abbreviation of General SOLT. name GTXX is the abbreviation of General TXX.
ROHDE & SCHWARZ WORKSHOP , EUMC 2003, , OCTOBER 2003
2
� � � ��� � ��,���# � %! &$' $ �� � � ��,"�$( ��� ��� 7
and the relation between
A. The 5-Term Model The hardware test-set for an uni-directional VNA is shown in Fig. 1.
���
and
yields (4)
)
After a re-organisation of these equations, the error coefficients ��, and ��- are obtained:
�� , � and Fig. 1. Block diagram of a vector network analyzer with three measurement channels
More than 20 years ago the SOLT-procedure was introduced (e.g. [4]). This theory describes how to reduce the test-set to a so-called schematic block diagram, as shown in Fig. 2.
' 8 9 �$ ' �$#�!%�$(%: 8 9 �$�;
&$' ��- � 8 < : ��,���(=;
5 )
(5)
(6)
All five error coefficients can be calculated. B. GSOLT Calibration of a N-Port VNA The simple way to calibrate a multi-port VNA with the GSOLT-procedure is described by using a three-port VNA. It is easy to extrapolate these results to n-port VNAs. The block diagram with the error networks of a three-port VNA is shown in Fig. 3.
Fig. 2. Schematic block diagram of a vector network analyzer for the 5-term model
The schematic block diagram includes the device under test (DUT) in scattering parameters and the two error networks (matrices � � and � ) with the ��� - and ��� -error coefficients. These five error coefficients are similar to scattering parameters, including the physical non-idealities of the test-set. Based on this 5-term model (5 unknown error coefficients) a simple relation between the measurement values ��� , ��� and the reflective one-port device (reflection value � � ) can be derived:
�$#%� � ��� � ��"! &$' ��(�� �*) � �� � � �� ��� �
(1)
Measuring the three known reflection standards: short (S), open (O), and load (L, or match M) with the known values � � , � � , and � + , three equations are available to calculate the three error coefficients �� , ��# , and �$( . This first step is also called reflectometer calibration. This step is used in most cases where only reflection measurements are performed. In this case it is called 3-term procedure (SOL- or MSO-procedure). The other error coefficients ��, and ��- can be calculated from the measurement results of a thru-connection (T) with the scattering matrix:
� .�/� �10�2 &
&
2�3
)
(2)
For the relation of the measurement values ��+ to ��� results
��+ � �� &$' �� ,"�$(65 � �� � � �� ��� 4
(3)
Fig. 3. Block diagram of a vector network analyzer with three ports and four measurement channels
The (real) switch can be mismatched, but it needs an isolation in the range of the measurement dynamic. The block diagram shown in Fig. 3 can be separated into three schematic block diagrams for the three states of the switch. The Figs. 4 and 5 illustrate the schematic block diagrams for the first and second state of the switch with the included error coefficients. The calibration process first consists of n (here n=3) reflectometer calibrations. These three reflectometer calibrations bring up 9 error coefficients �?> , �?# > , �?( > , �?> > , �?# > > , �?( > > , @A> > > , @A># > > , and @?>( > > 3 . The second calibration step is based on the thru-connection measurements between all ports: For every state of the switch, the second part of the 5-term procedure is used twice: The first state of the switch delivers �A, > and �A- > as well as @ >, and @ >- by using equations similar to (5) and (6). The second state of the switch provides the calculation of �?, > > , �?- > > , @A,> > , and @?-> > from (5) and (6) and the third state helps to determine � , > > > , � - > > > , � , > > > , and � - > > > . 3 The
number of primes stands for the state of the switch.
ROHDE & SCHWARZ WORKSHOP , EUMC 2003, , OCTOBER 2003
3
A three-port scattering matrix is defined as follows:
GH D JI HG IJLGH B IJ �D �� � �K��� �K��� + � B � � �D �� � �K��� �K��� + B + + �� + �K��+ �K��+ +
(12)
)
We have already calculated three sets of error corrected (highly accurate) incident and reflected wave values which each fit equation (12). Finally, we can combine the three sets of scattering parameter equations to the matrix equation
GH D
Fig. 4. Schematic block diagram of a three-port VNA for the first state of the switch
D >� D >� � >+
D
D
D >� > D D >� > D � >+ � > ��M NPO
IJ GH JI HG B >� > > �� � Q � ��� �K��� + >� B >� > B � >� > > �� � Q � ��� �K��� + >� B >� > B >+ > > � � �� + Q � ��� + � �K��+ + � � >+ B � >+ � > ��M R S O �� M T
O
B >� > > JI B >� > > B >+ > > ) �
(13) The error correction equation is simply expressed in a matrix formulation:
� .�U� � � V� � W� X �
Fig. 5. Schematic block diagram of a three-port VNA for the second state of the switch
)
(14)
The robustness of an error correction algorithm is very important [2]. Please note, that the trace values of the matrix � WP are never low or zero. This is an important fact for a very good numerical quality of this simple GSOLT error correction equation. D. GTXX Calibration of a N-Port VNA
Generally, the number of error coefficients is 3 � n for the reflection calibration steps and 2 � n � (n-1) for the transmission � calibration steps, i.e. 2 � n +n error coefficients altogether. C. GSOLT Error Correction Process
The way to calibrate and to error-correct the multi-port VNA with the GTXX-procedure is described by using a threeport triple reflectometer VNA. These results can easily be extrapolated to n-port VNAs. The block diagram with the error networks of a three-port triple-reflectometer VNA is shown in Fig. 6.
Using Fig. 4, the scattering parameter relation
� >� �C0 ? � &> 0 � B >� 3
�?# > 0 ��D >� �?( > 3 >� 3
(7)
is valid for the properties at port 1. The incident and the reflected wave at port 1 of the DUT can be calculated from equation (7):
B >� D> �
� �
�?E > ' : � >� � > � >� ; � >� ! � #> & ' : � >� � > � >� ; � #> ) 5
(8) (9)
All other relations between the measurement values of the first state of the switch, the error coefficients, and the waves at the port 2 and 3 can be directly picked up from Fig. 4:
D > � ��9> � � > 5 D > � ��>F + @ > 5 D D The waves B >� > , >� > , B �> > , ...
� , > ��9> B >� � A � -> B >+ � @A>, ��>F @ >-
(10)
5 )
(11)
+> > > can be calculated in a similar manner for the second and the third state of the switch.
Fig. 6. Block diagram of a vector network analyzer with three ports and six measurement channels (triple-reflectometer)
The (real) switch can be mismatched and it does not need a perfect isolation [2]. The block diagram shown in Fig. 6 can be separated into two double-reflectometer VNAs: Using the first and second state of � the switch, the error matrices � YZ and � []\ X can be calculated with a standard two-port calibration TXX-procedure. With the first and third state of the switch, the 7 parameters of the error
ROHDE & SCHWARZ WORKSHOP , EUMC 2003, , OCTOBER 2003
4
boxes A and B^ ^ can also be calculated by using a TXXprocedure. _ The notation is using the transmission parameters
� `aU� � � YZ � b�U� � []c X � with the measurement matrix � `dU� for the DUT � beU�
(15) [2].
The number of error coefficients is 3 for the error box A and 4 � (n-1) for the transmission calibration steps, i.e. 2 � (n-1)+3 error coefficients in total.
It is useful to invert the error matrices for the GTXX multiport error correction process.
5
� g�c � � []c X �
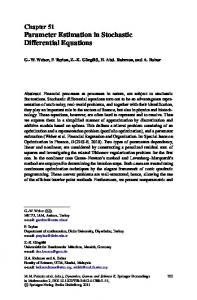
−19.99 Magnitude S21 (dB): GSOLT Magnitude S21 (dB): GTXX
−19.992
E. GTXX Error Correction Process
� fZ � � YZ X �
typical values for leakage and reflection coefficients of the test-set and the signal/noise ratio of -95 dB. For the GTXX-procedure the general TAN-procedure [2] with match- and reflect-standards was used. The reflectstandard was a short. The mostly used verification standard is a 20 dB attenuator. Fig. 7 illustrates that both procedures work very accurately for the transmission of this attenuator.
5
: h �ji i i ; 5
−19.994 −19.996
(16) −19.998
Referring to Fig. 6, the relations −20
(17) (18)
apply to every state of the switch for the inverted transmission parameters. That means that for a three-port, all three sets of error corrected incident and reflected wave values which each fit equation (12) can be calculated with high accuracy. Finally, we can combine the three sets of scattering parameter equations to the matrix equation (13) and use equation (14) to calculate the error-correted scattering parameters. III. A C OMPARISON
OF
GSOLT
AND
GTXX
The advantages of GTXX: k Less calibration measurements. k Many possible calibration standards. k Easy to realize self-calibration standards can be used. k Switch can have poor isolation. The advantages of GSOLT: k Less measurement channels = cheaper VNAs. k Based on the most used SOLT-procedure = calibration standards are widespread. k More robust for high dynamic measurements. IV. R ESULTS OF N UMERICAL E XPERIMENTS The GSOLT-procedure is implemented in the multi-port network analyzer4 [5] since Oct. 1998 and performs in an excellent way as shown in [6]. The best way to make a comparison between two calibration procedures is the use of ”measurement data” of a virtual VNA. The conditions of this software-VNA are well known. There are no re-connection errors or other unknown errors in the system. To realize a comparison between the GSOLT- and the GTXX-procedure, the data of a virtual VNA were used with 4A
similar software in special R&S-multi-port-VNA solutions.
−20.002 −20.004 −20.006 −20.008 −20.01
0
5
10
15 20 Frequency
25 (GHz)
30
35
40
Fig. 7. Error corrected multi-port scattering parameters of a 20 dB attenuator performed by using the GTXX- (solid) and the GSOLT-procedure (dashed)
However, the largest magnitude of measurement errors for reflection measurements appears for both procedures at port 3. But the error corrected results are very similar as shown in Fig. 8 and they are quite small (exact value: -40 dB). −39.9 −39.92 −39.94
(dB)
0 B� �
� � fZ 0 ��� � � 3 5 � 3 D � + � � g�\ 0 � 0 B + � � g�\ \ 0 � < � 9 3 5 + 3 � F 3 3
−39.96 −39.98
Magnitude S33
D
D 0 B� �
−40 −40.02 −40.04 −40.06 −40.08 −40.1
0
5
10
15 20 Frequency
25 (GHz)
30
35
40
Fig. 8. Error corrected multi-port scattering parameters of the return loss of a 20 dB attenuator performed by using the GTXX- (solid) and the GSOLTprocedure (dashed)
ROHDE & SCHWARZ WORKSHOP , EUMC 2003, , OCTOBER 2003
5
−50
−50 −55
−55
(dB)
−60 −65 −70 Magnitude S23
All investigations show that differences between both procedures up to values of -50 dB can be neglected. In a real system the non-perfect calibration standards are the main influence on the measurement accuracy. In practise it should be easy to carry out the error correction of the measurement data of a well-matched and high isolating device. However, Fig. 9 shows that the GSOLT-procedure is more suitable in this case than the GTXX-procedure.
−75 −80 −85
−60
(dB)
−90 −65
−95
Magnitude S23
−70
−100
−75
0
5
10
15 20 Frequency
25 (GHz)
30
35
40
Fig. 10. Error corrected multi-port scattering parameters of the isolation between a mis-matched device performed by using the GTXX- (solid) and the GSOLT-procedure (dashed)
−80 −85 −90 −95 −100
0
5
10
15 20 Frequency
25 (GHz)
30
35
40
Fig. 9. Error corrected multi-port scattering parameters of the isolation between a well-matched device performed by using the GTXX- (solid) and the GSOLT-procedure (dashed)
Nevertheless, in practise high isolation devices are mismatched ones, e.g. filters. The GSOLT-procedure shows a better performance than the GTXX-procedure (Fig. 10) for worst case conditions of high reflective devices.
Fig. 11. Illustration of a differential device under test (DDUT) with multimode parameters
waves must be used. V. M ULTI -M ODE T HEORY A device under test with differential in- and output is shown in Fig. 11. This differential device under test (DDUT) can be discribed with the dual mode matrix � `d :
GlH D X IJ n D� � opqZr L D �mX �Dm r � r r
�X �
m X� � �m � X ��X
�X �
r m X� � r �m � X r ��X
m
�X � m r � X m� r �m � r �� r
m s t lG In � X � m H BB X� J r � X m� u B �mX r �m � B m�� r �� r
)
(19) r A signal flow diagram of these M-parameters is illustrated in Fig. 12. The calculation of the M-parameters from multi-port Sparameters is possible if: k the DDUT has ground-couple ports only and
k
& B m� � w x Dm � w&x � & B m� � w x Dm � w&x �
:B + ! B9; D D : +P! 9 ;
B �X � y � � D � y� X� � B �X � y � � D � y� �X �
' :B � B �; D ' D : � �; ' :B + B 9 ; D ' D : + 9;
(20) (21) (22) (23)
After a longer calculation we obtain: M-parameters for the differential mode:
r
the DDUT is a passive device or
r
k
with two 0 v /180v hybrids for an active device. To derive the M-parameters, the relations between the unsymmetrical waves and the differential and common mode
:B P � ! B �; D D : ��! � ;
r
r
�X �
�
�X �
�
�X �
�
�X �
�
& x : ��� �P!%��� � ' �� � � ' ��� � & x : ��� + !%��� 9 ' �� � 9 ' ��� + & x : ��+ �P!%� 9 � ' � 9 � ' �� + � & x : ��+ + !%� 9 9 ' ��+ 9 ' � 9 + ;
(24)
5
(25)
5
(26)
)
(27)
;
5
;
;
ROHDE & SCHWARZ WORKSHOP , EUMC 2003, , OCTOBER 2003
6
Additionally, a simple, robust, and easy to program algorithm for the GTXX-procedure has been discribed. This multi-port procedure shows benefits regarding the calibration standards and a drawback regarding the use of expensive 2 � n channel network analyzers. The multi-mode M-parameters have been introduced. It was shown, that the linear relations between M- and S-parameters hold for a lot of devices. ACKNOWLEDGMENT The author would like to thank the RF-devision of Rohde & Schwarz, especially Christian Evers, who made it possible to publish this article. Fig. 12.
Signal flow diagram of the multi-mode parameters
R EFERENCES
M-parameters for the common mode:
m
& x : ��� �P!%��� � !"��� � !%��� & x : ��� + !%��� 9 !"��� 9 !%��� & x : ��+ �P!%� 9 � !"� 9 �P!%��+ & x : ��+ + !%� 9 9 !"��+ 9 !%� 9
�� r m �� r m �� r m ��
� � � �
r
�;
(28)
5
(29)
5
(30)
)
(31)
+;
5
�; +;
Conversion parameters for the differential into the common mode:
& x : ��� � & x : ��� + & x : ��+ � & x : ��+ +
m � �X r m ��X r m � �X r m ��X � � � �
r
' '
��� � ��� 9
'
'
��� �P!%��� � ;
(32)
5
(33)
5
(34)
)
(35)
5
(36)
5
(37)
5
(38)
)
(39)
��� 9 !%��� + ; ' ' � 9 � !%� 9 � ��+ � ; ' ' � 9 9 ��+ 9 !%� 9 + ;
5
Conversion parameters for common into the differential mode:
�
r
m � m � m �
�X �
m
r
�X � r
�X � r
�X �
& x : ��� � & x : ��� + & x : ��+ � & x : ��+ +
'
'
��� � !%��� �
'
��� � ;
' ��� 9 !%��� 9 ��� + ; ' ' � 9 � � 9 ��!%��+ � ; ' ' � 9 9 !%��+ 9 � 9 + ;
VI. C ONCLUSION A general calibration and error correction algorithm that can be implemented in any vector network analyzer has been presented. This so-called GSOLT-method works for 1-port measurements as well as for n-port measurements. The novel error correction algorithm is robust and easy to program. This well tested procedure allows to perform accurate nport measurements with a network analyzer with only n+1 measurement channels.
[1] Ferrero, A., Pisani, U., Kerwin, K.J., A New Implementation of a Multiport Automatic Network Analyzer, IEEE Trans. Microwave Theory Tech., vol. 40, Nov. 1992, pp. 2078-2085 [2] Heuermann, H., Schiek, B., Robust Algorithms for Txx Network Analyzer Procedures, IEEE Trans. Instrum. Meas., Feb. 1994, pp. 18-23 [3] Heuermann, H., Schiek, B., Results of Network Analyzer Measurements with Leakage Errors – Corrected with Direct Calibration Techniques, IEEE Trans. Instrum. Meas., IM-5, Oct. 1997, pp. 1120-1127 [4] Hewlett Packard, Automating the HP 8410B Microwave Network Analyzer, Application Note 221A, Jun. 1980. [5] Heuermann, H., Fabry, H.-J., Ballmann, R., Kalibrierverfahren zur Durchf¨uhrung von Mehrtormessungen basierend auf den 10-TermVerfahren, Invention P 198 18 878.1-35, 06.05.98, Aktenzeichen: 199 18 697.9 [6] Heuermann, H., GSOLT: The Calibration Procedure for all Multi-Port Vector Network Analyzers, MTT-S International Microwave Symposium, Philidelphia, 2003, pp. 1815-1818
Holger Heuermann (M’92) was born in Wagenhoff, Niedersachsen, Germany, in 1964. He received the Dipl.-Ing. (FH) degree from the Fachhochschule Braunschweig-Wolfenbuettel in 1988 and the degree Dipl.-Ing. from the University of Bochum 1991, both in electrical engineering. From 1991 to 1995, he was a research assistant at the University of Bochum, Germany, working in the field of high-frequency measurement techniques and industrial applications of microwaves. From 1995 to 1998 he was working at Rosenberger Hochfrequenztechnik, Tittmoning, Germany, where he was engaged in the design of high frequency equipment, especially for the calibration of network analyzers. In 1998, he joined Infineon Technologies, Munich, Germany, leading a development group for wire-less front-end modules and circuits. Since 2002, he has been with the University of Applied Sciences Aachen, Germany, where he is currently a Professor, leading the Institute of High Frequency Technology. His current research interests include passive and active high frequency components, design of RF front-end circuits, as well as high precision-, multi-port-, and multimode-scattering parameter measurements. He is member in the microwave measurements technical committee MTT-11.