1894
IEEE TRANSACTIONS ON POWER SYSTEMS, VOL. 21, NO. 4, NOVEMBER 2006
On Power System Controlled Separation M. M. Adibi, Fellow, IEEE, R. J. Kafka, Fellow, IEEE, Sandeep Maram, Student Member, IEEE, and Lamine M. Mili, Senior Member, IEEE
Abstract—This paper describes verification of five conjectures related to power system controlled separation. It attempts to verify that the location of uncontrolled separation (loss of synchronism or out-of-step operation) is independent of the location and severity (short-circuit duty or duration) of the initial faults, that the location depends on the prevailing network configuration and load level, and that it takes place one operation at a time (cascades). Verification of these conjectures would allow controlled separation during a disturbance in real-time, using the present communication and protection systems, and results in a minimal load and generation imbalance. Two actual power systems were used, a 50-bus system to establish the procedure for controlled separation and a 640-bus interconnection to apply the procedure. Data representing static and dynamic behavior of the two power systems were obtained from the operating utilities, and the many required simulations were conducted using EPRI Power System Analysis Package (including IPFLOW and ETMSP programs). Index Terms—Controlled separation, graceful degradation, out-of-step blocking, system separation, transfer tripping.
I. BACKGROUND OST POWER system faults occur on high- and extrahigh-voltage transmission lines due to their vulnerability arising from their exposed lengths. The majority of these faults, such as those caused by lightning, are temporary and of short duration. These faults are cleared by rapidly opening and reclosing circuit breakers at both ends of lines, leaving the power system in an unfaulted condition. However, during the short fault duration, the electrical output of generators decreases, while the mechanical input to the generators remains practically constant. The effect of the torque imbalance is for the groups of coherent generators to accelerate at different rates and to “swing” with respect to one another. If not quickly corrected, they may lose synchronism, splitting the system into an imbalance load and generation parts, and consequently result in blackouts. The recent major power disturbances have shown that the initial and temporary system faults have been cleared in milliseconds, and the uncontrolled system separation into unbalanced load and generation parts has occurred in seconds [1]. Therefore, it appears that between the clearance of the initial fault and formation of uncontrolled separation, there is ample time
M
Manuscript received September 6, 2005; revised May 8, 2006. This work was supported by the National Science Foundation under Small Business Innovative Research Grant DMI 0439603. Paper no. TPWRS-00555-2005. M. M. Adibi is with IRD Corporation, Bethesda, MD 20827 USA (e-mail:
[email protected]). R. J. Kafka is with Pepco Holdings, Inc., Bethesda, MD 20827 USA (e-mail:
[email protected]). S. Maram and L. M. Mili are with Virginia Polytechnic Institute and State University, Blacksburg, VA 24061 USA (e-mail:
[email protected];
[email protected]). Color versions of Figs. 4–6 and 8–15 are available online at http://ieeexplore. ieee.org. Digital Object Identifier 10.1109/TPWRS.2006.881139
for real-time controlled separation using the present protective and communication systems. The past controlled separations have been developed for elongated and isolated power systems, splitting the system along predetermined boundaries. They have been planned for a forecasted load condition. Then in response to the resulting load and generation imbalance in the separated parts, they have invariably resorted to undesirable load shedding and generation curtailment [2]–[6]. In recent years, there have been several “response-driven” types of studies addressing the controlled islanding. Their approaches are based on availability of real-time system-wide phasor measurements, accurate and extensive power system modeling, highly efficient computing, pattern recognition, ordered binary decision diagrams, and other real-time analytical tools to predict the instability of the power system and to determine the locations, timing, and the need for system separation. The prediction of online real-time transient stability may well be a long-term solution [7]–[11]. It is believed that the simplicity in detection, control, and the use of existing protective and communication systems makes the approach described in this paper very attractive. This “event-driven” approach, after the initial fault, blocks the system separation where load and generation is unbalanced “undesirable” and transfers the separation to where it is balanced “desirable” [12]. The approach is based on verification of the following five conjectures. 1) The location of loss of synchronization (i.e., the out-of-step operation) causing uncontrolled separation is independent of the locations and severity (duration) of the initial faults. This implies that for many likely initial faults, there would be only a few locations where out-of-step operation could take place. 2) The location of the out-of-step operation depends on the current system topology and the prevailing operating condition. It infers that under a prevailing network configuration and load level, only a few out-of-step relays need to be armed for possible out-of-step blocking and transfer tripping operations. 3) The out-of-step operations take place one operation at a time (cascading). It suggests that the loss of synchronism does not occur in several locations simultaneously and that the time interval between successive occurrences allows blocking and transfer of the loss of synchronism to a desirable location. 4) During normal operation, at any given time, there are several locations that can split the power system into separate and desirable parts. Usually these locations are identified by light power flow lines.
0885-8950/$20.00 © 2006 IEEE
ADIBI et al.: POWER SYSTEM CONTROLLED SEPARATION
5) The location(s) to which transfer tripping is (are) made will have a “minimal” imbalance in load and generation, resulting in the least disruption of service. Verification of the above conjectures together with the current knowledge of the system configuration and load condition would allow arming certain relays for out-of-step blocking and transfer-tripping. Then within a second or two after a possible initial fault, the controlled separation could take place. The arming of specific relays will be updated from time to time or in response to significant changes occurring in the system configuration and load condition. In order to verify the above conjectures, the out-of-step operations have to be monitored at several likely locations for many possible initial faults. This required that the relay characteristics and the apparent impedance representations be modified by expressing the relay tripping zone and the apparent impedance in per unit on the basis of the impedance of the individual line that is being protected. This process had to be further simplified by monitoring the distance between the apparent impedance position and the center of the relay tripping zone, both in the plane. Without these modifications and simplifications, it would have been difficult to conduct the many required simulations efficiently. In Section II, a reduced 50-bus system is used to establish the procedure for verifying the five conjectures. Sections II-A to II-D include identification of locations for the possible initial faults locations for the likely system separations, timings for typical fault clearing, out-of-step blocking and transfer-tripping procedure, and the coherent generators’ dynamic response to the three-phase faults. In Section II-E, representation and simplification of relay tripping zones and apparent impedances are described. In Section III, the procedure developed in Section II is applied to a 640-bus interconnection, to verify the five conjectures. In Section III-A, the desirability/undesirability criteria for location of system separation is discussed. Sections III-Bto III-G simulate and demonstrate: sequential (cascading) operation of out-of-step relays, the effect of out-of-step blocking and subsequent tripping, the independence of out-of-step location vis-à-vis the initial fault intensity (duration) and location, and the dependence of out-of-step operation on peak- and light-load conditions. In Section III-H, the out-of-step blocking and transfer-tripping procedure is demonstrated. The discussion of the results and concluding remarks are in Section IV. II. PROCEDURE A. Reduced 50-Bus System Fig. 1 shows the reduced 50-bus system [13]. It is actually an interconnection of two systems, one represented by buses 109 and 135 through 142, operating at nominal 230 kV, whereas the other system operates at a nominal 110 kV. The two systems are interconnected by a two-winding transformer between buses 109 and 108 and a three-winding transformer between buses 135 and 127. Two 30-MVAr synchronous condensers are connected to the tertiary winding of this transformer. The 110-kV transmission loop encircles a metropolitan area, and the major part of the system load is concentrated here. Two of the steam
1895
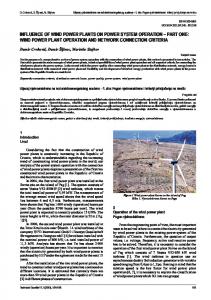
Fig. 1. Reduced 50-bus system.
TABLE I REDUCED 50-BUS SYSTEM DYNAMIC DATA
plants are located near this load center, but the high-head longconduit hydro plants are remote. The 50-bus system is loosely connected, and as such, it is prone to transient instability and uncontrolled separation. In this type of system, out-of-step operation where the system separation may take place is readily identifiable by simulation and actual instability experience. Using network reduction and dynamic equivalent techniques, the 50-bus system was reduced to 30 buses, three steam-electric stations, six hydro-electric plants, and one synchronous condenser. The initial fault locations where judiciously selected. Eight three-phase faults were placed on the system as indicated by X on the one-line diagram. The locations where out-of-step operations were suspected and monitored are indicated by M1, M2, M3, and M4. The dynamic data used for the generators, governors, and excitation systems are listed in Table I. B. Initial Fault Clearing In general, on high- and extra-high-voltage transmission lines, high-speed fault clearing is used [13], [14]. High-speed fault clearing requires simultaneous tripping and then simultaneous reclosing of circuit breakers at both ends of a line such as the 136-135 line in Fig. 1, for which high-speed relays and communication are used. These relays also distinguish whether the system fault is internal or external to the line. The fault clearing time is the sum of fault detection time of 1/4 to 1 cycle (on the basis of 60 Hz), signal transmission time of 1/4 to 1 cycle, and the circuit breakers interruption (opening) time of 1 1/2 to 2 cycles. Thus, depending on the line voltage level and the type of relay and breaker used, the duration of the initial fault is within two to four cycles (typically, the higher the voltage level, the faster the relay/breaker and shorter the fault duration). The breakers are then simultaneously reclosed (one time) about 10 to 15 cycles later. The lengthy interval between the opening and reclosing of the circuit breakers is to allow time
1896
Fig. 2. Swing blocking relaying.
Fig. 3. Ohm unit relay.
for de-ionization of the arc at fault location and to prevent restriking (typically, the higher the voltage level, the longer the reclosing interval). C. Out-of-Step Blocking and Transfer Tripping Following clearance of a fault, external to a given line, the line’s apparent impedance (bus voltage over line current) gradually moves toward the relay’s out-of-step tripping zone [15]–[17]. For example, in Fig. 1, the out-of-step relay indicated by M2 on 136-135 line is such a location. By detecting that the out-of-step relay operation may occur at an undesirable location, ample time is available to block the relay from operation and transfer the tripping to a desirable location [18], [19]. Microprocessor-based relaying schemes with fiber-optic communication and electronic relays offer more options for out-of-step blocking and transfer tripping; however, the ohm unit relay of Figs. 2 and 3 that are in general industry use will be described here. The ohm units that are also called angle-impedance relays are used as “blinders” to control the angle range of tripping out-of-step or swing conditions. As shown in Fig. 2, the angular range covered by the distance relay element may be narrowed to any desired extent. The
IEEE TRANSACTIONS ON POWER SYSTEMS, VOL. 21, NO. 4, NOVEMBER 2006
fault-impedance locus is the shaded area between the two lines at angles 75 (line-impedance angle) and 60 . The apparent impedance path or swing-impedance locus is drawn intersecting the line-impedance and indicating the various swing angles. The distance relays without blinders would trip during swing in the range from 90 to 240 , whereas with the blinders, the range is limited to 135 to 195 . These blinders respond to impedances at angles 75 and 60 , which are selected to make the characteristics of ohm relay unit parallel to the boundaries of the line’s fault area. Their “ohm settings” are adjusted to place the characteristic close to the boundaries. During out-of-step conditions or heavy swing, a distance relay may trip, depending on whether the prevailing swingimpedance locus passes through the tripping area. That is, the relay tripping is a function of 1) relay characteristics and position of its tripping area; 2) position of the relay in the network with respect to the operating generators. It is, however, desirable to control the locations where such relay tripping occurs. This requires that during out-of-step conditions, those relays that may trip at undesirable locations be blocked and those relays that may not trip at the desirable locations be allowed to tripped. The out-of-step blocking can be accomplished by the use of an additional blinder as shown in Fig. 3. The apparent impedance passes across the parallel blinders from normal operating conditions to tripping areas gradually (i.e., a low rate of change of impedance) for the out-of-step condition and instantaneously (i.e., a high rate of change of impedance) for a fault condition. If the elapsed time, between the crossing of the outer blinder and the inner blinder (the shaded area), is equal of the auxiliary relay to or greater than the pick-up time associated with the out-of-step relay, then the auxiliary relay operates, blocking the tripping operation. The pick-up time of the blocking relay is about 1/4 to 1 cycle, signal transmission time for the transfer to the desirable location is also 1/4 to 1 cycle, and the simultaneous circuit breakers opening time at the transferred to locations is about 1 1/2 to 2 cycles. Thus, within two to four cycles following the apparent impedance crossing, the shaded area between the outer and the inner blinders, the out-of-step blocking, and transfer tripping can be accomplished. D. Generators Transient Response Fig. 4 shows responses (swing curves) of several generating plants after placing a three-phase fault adjacent to Bus 139 on one of the two parallel lines to Bus 140. It can be seen that the initial fault has been placed on the system at 0.1 s after the start of simulation, cleared at 0.2 s by opening the two breakers at both ends of the faulted 139-140 line, and reclosed the two breakers at 0.5 s later. During the 0.1 s (six cycles) of the initial fault duration, the electrical and mechanical torque imbalance has caused the two groups of coherent generators to accelerate at different rates, swinging with respect to one another [15], [20]–[22]. It should be noted that following the placement of a number of initial faults, as indicated by X in Fig. 1, the two generating plants, Gen 138 Hydro and Gen 142 Hydro, have consistently
ADIBI et al.: POWER SYSTEM CONTROLLED SEPARATION
1897
Fig. 5. Apparent impedance for line 135-136. Fig. 4. The 50-bus transient test results.
had a higher accelerating rates than the other “coherent” group. Subsequently, the two groups may lose synchronism at 136-135 line, splitting the system into two parts, with unbalanced load and generation that could lead to a blackout. E. Relay and Apparent Impedance Representations In Fig. 1, let line 136-135 be represented by bus voltages Ei and Ej, current Iij, and the line impedance Zij, all in per unit on 100 MVA base and line’s nominal kV level. The apparent impedance Zi at i-bus is determined from or
(1)
Under normal operating conditions, Zi is much greater than the line impedance Zij. During swing conditions, path described by Zi can come into the vicinity of the relay , tripping zone and may enter the tripping area, when and consequently open the unfaulted 136-135 line. In order to monitor the out-of-step operations for a set of possible three-phase initial fault locations (eight locations as selected and indicated by X in Fig. 1), at a set of likely out-of-step relay locations (four locations indicated by M1, M2, M3, and M4 in Fig. 1), the 32 transient stability simulations required that the relay characteristics and the apparent impedance representation be simplified by expressing the apparent impedance and the relay tripping zone in per unit on the basis of individual line impedance, as follows: or
(2)
Thus, Zo position in the plane can be compared with line impedance Zij, approximately equal to 1.0 at all relay locations without representing each relay separately, as illustrated in Fig. 5. Although this approach is less accurate than full representation of the relay tripping zone, it does simplify the verification effort. plane at Fig. 5 shows movements of Zo in the bus 136 for line 136-135 due to the three-phase fault adjacent to Bus 127 on one of the two parallel lines 127-129, as indicated by X in Fig. 1. After clearance of the initial fault, the ap-
Fig. 6. Apparent impedance for line 135-136.
parent impedance at the out-of-step relay location M2 gradually varies in magnitude and angle, so that it gradually moves toward its tripping zone that is close to the line impedance. In this case, it can be seen that the apparent impedance has not entered the out-of-step relay’s tripping zone (shown as a circle), and consequently, line 136-135 does not trip due to the out-of-step operation. In Fig. 6, the process has been further simplified by showing the magnitude of apparent impedance Zo against time, under the same condition. When an imminent tripping by the out-of-step , and the rate of change of relay is detected, i.e., when in Fig. 3, time is impedance is greater than the preset value available to quickly block the relay (when armed) from operation and transfer the tripping to a desirable locations by means of the communication channel as described above [12], [13]. III. APPLICATION A. 640-Bus Interconnection The 640-bus interconnection in contrast to the 50-bus system is an all-thermal power system, with relatively short intertie paths. The 640-bus interconnection is composed of several
1898
IEEE TRANSACTIONS ON POWER SYSTEMS, VOL. 21, NO. 4, NOVEMBER 2006
TABLE II 640-BUS SYSTEM DYNAMIC DATA
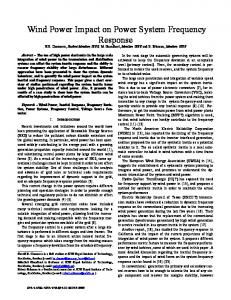
power systems that over the years have been independently developed and are very closely net. They have later on been interconnected by relatively short tie-lines. The 640-bus interconnection is fairly stable and unlike the 50-bus system has seldom experienced instability or uncontrolled separation. Experience with blackouts of 1965, 1967, 1977, and 2003 has shown that in this type of system, the out-of-step operation that separates the interconnection has taken place at the tie-lines between the individual systems and/or with the other interconnections [1], [23], [24], [29]. The 640-bus system is a 22 000-MW interconnection composed of four power systems tied together with relatively short 500- and 345-kV transmission lines. It consists of 92 generators in 24 power plants. Using the network reduction and dynamic equivalent techniques, the interconnection was reduced to 517 buses and 38 generators of cross-compound, tandem, and combustion turbine types. The dynamic data used in the EPRI ETMSP for the generators, excitation systems, and governor systems are listed in Table II. Due to space limitation, the static data and the one-line diagram for the 640-bus interconnection are not included in this paper. During different power system operating conditions such as the peak-load and light-load or the heavy interchange of power, the four power systems each were either generation rich or load rich. Accordingly, the tie-line flows also were different in different simulation cases. Fig. 7 shows the four power systems E, F, G, and H with the four ties e-f, e-g, g-h, and f-h and the four out-of-step monitoring points M1, M2, M3, and M4. Many cases were simulated to illustrate different types of power system disturbance using EPRI IPFlow and ETMSP programs. Attempts were made to verify the five conjectures regarding the effects of cascading, relay-blocking, fault-intensity, fault-location, load-levels, and network-configuration on the out-of-step blocking and transfer tripping that is the basis for controlled separation. It is shown that for a given power system configuration and load level, the out-of-step location for the initial faults on any part of the power system can be determined. For instance, the unfaulted e-f tie-line in Fig. 7 is such a location. The undesirability of such a location for system separation depends on whether the power flow , across the out-of-step location (e.g., from e-bus to f-bus), is appreciably greater than the frequency regulation , of generators on the receiving F-System. In the event that is substantially greater than , then the blinder relay (ohm unit, angle impedance, or digital equivalent) is armed for out-of-step blocking and transfer tripping to
Fig. 7. The 640-bus interconnection.
criterion. Otherwise, a dethose locations that meet the , sirable system separation would be allowed to take place and subsequently resynchronized, resulting in no or insignificant disturbance. Given a system configuration and a load level, a set of line outages needs to be selected that results in system separation with the least between the two separated parts. If necessary, this minimal can further be reduced by rescheduling the area generation in the separated parts [7], [25], [26]. In their daily normal operation, utilities often reschedule area generation to provide sufficient area spinning and effective (dynamic) reserve to overcome loss of a significant area generation. Typically, the area spinning reserves (area generation capacity less output) are distributed in proportion to the area generators’ frequency response rates to maximize the area regulation [20], [27], [28]. B. Cascading The purpose of this simulation was to show that out-of-step relay operations occur sequentially (cascading) and not simultaneously. The distinction between the two types of operation is whether control actions can take place in the time interval between successive out-of-step operations. In Fig. 8, a three-phase fault was placed adjacent to Bus 64 on one of the 230-kV, 20-mile-long double circuit line 64-132. The line’s parameters are listed in Table III. Bus 64 has a relatively high short-circuit duty being the system bus for the Power Plant 65 (450-MVA generators and the 500-MVA step-up transformers) in the E-System. It can be seen that fault had been placed at and , i.e., a fault duration of nine cycles on cleared at 60-Hz basis. The breakers at both ends of the single circuit , 64-132 have opened and successfully reclosed at i.e., for a 15-cycle reclosing duration. As shown, the apparent impedance at e-bus of the e-f tie-line has entered the relay tripand for the g-bus of the g-h tie-line ping zone at at or about 35 cycles later. Consequently, there
ADIBI et al.: POWER SYSTEM CONTROLLED SEPARATION
Fig. 8. Tie-lines e-f and g-h cascading.
1899
Fig. 9. Tie-line e-f is blocked.
TABLE III THREE-PHASE INITIAL FAULT LOCATIONS
TABLLE IV INITIAL OPERATING CONDITIONS FOR THE CASCADING CASE
Fig. 10. Fault intensity (duration).
D. Fault Intensity (Duration) has been ample time available in the interval for relay blocking and transfer-tripping (i.e., the required two to four cycles). The simulation also confirms that under several system faults, there were only two coherent groups of generators within the 38 generators in the interconnection. Table IV lists the tie-lines’ power flow and parameters for the cascading case. C. Out-of-Step Blocking Fig. 9 illustrates the effect of blocking the e-f tie-line from tripping under the same initial operating condition and fault procedure as in the previous (cascading) case. At , the apparent impedance for the e-f tie-line enters the relay tripping zone. The relay, having been armed, recognizes the out-of-step operation and blocks the relay from tripping. Subsequent to the out-of-step blocking of the e-f tie-line, the g-h tie-line, having not been armed, trips at time or about five cycles later than in the cascading case, as expected.
Fig. 10 shows that two three-phase faults have been placed adjacent to Bus 64 on one of the two parallel lines to Bus 132, one fault with nine cycles and the second with 12 cycles fault clearing times. Examination of the logarithms of the apparent impedance paths for the four tie-lines e-f, g-h, e-g, and f-g monitored at M1, M2, M3, and M4 show that only the e-f tie-line is susceptible to out-of-step operation. This simulation case shows that location of out-of-step operation, i.e., the uncontrolled power system separation, is independent of the intensity (duration) of the initial faults. E. Initial Fault Locations One of the conjectures to be verified was to demonstrate that the location of the out-of-step operation is independent of the locations of the initial faults. Fig. 11 shows the apparent impedance paths of the g-h tie-line under two identical three-phase faults, one adjacent to Bus 64 on one of the double circuit line to Bus 132 as described in Section III-B and the other adjacent to Bus 47 on one of the 230-kV 30-mile-long double
1900
IEEE TRANSACTIONS ON POWER SYSTEMS, VOL. 21, NO. 4, NOVEMBER 2006
Fig. 13. Change in network configuration. Fig. 11. Fault location. TABLE VI INITIAL OPERATING CONDITION FOR THE SECOND LIGHT-LOAD CASE
for the light-load condition. Under peak-load, g-h tie-line trips, whereas under light-load condition, it does not. G. Network Configuration
Fig. 12. Peak and light load conditions. TABLE V INITIAL OPERATING CONDITION FOR THE LIGHT-LOAD CASE
In Fig. 13, two light-load operating conditions with different configurations are compared. In the first case, the number of generators is 38, the same as in the peak-load configuration of Table IV, but load and generation have been reduced to 80%. In the second case as listed in Table VI, all the 12 peaking steam units and combustion turbine units have been shut down, but the load level has been kept to the same level as that of the first case. The logarithm of the apparent impedance path for the e-f tie-line for the second case with 24-generator configuration is quite different from the first case with 38-generator configuration, showing that out-of-step operation also depends on the network or generation configuration. H. Out-of-Step Blocking and Transfer Tripping
circuit line 47-32. The line’s parameters are listed in Table III. Bus 47 is the system bus for Power Plant 48 (1260-MVA generators and the 1465-MVA step-up transformers), also in the E-System. It can be seen that under the same initial fault duration, but in two different locations, g-h tie-line is subject to out-of-step operations within four cycles of each other. F. Load Condition Fig. 12 shows that the out-of-step operation depends on power system load levels. This can be seen by comparison of the apparent impedance for g-h tie-line, under peak-load and lightload conditions without changing the number of generators or the network configuration. Table IV lists the system load of 21 630 MW for the peak-load, and Table V lists 17 300 MW
Figs. 14 and 15 illustrate the out-of-step blocking and transfer tripping. Under this operating condition, the E-System and G-System of Fig. 7 are by about 10% generation rich as compared with the F-System and H-System. The differences in the tie-line flows can be seen by comparing Tables IV and VII. In Fig. 14, a three-phase nine-cycle initial fault is placed adjacent to the Bus 64 on one of the two parallel lines to Bus 132, as discussed earlier. The apparent impedance Zo for the e-f tie-line has moved and gradually entered the relay tripping zone at . If not blocked, as seen in earlier cases, the g-h tie-line will follow and trips about 35 cycles later. This is undesirable as it would separate the interconnection into two unbalanced parts. The E-System and G-System parts being generation rich will accelerate, and the F-System and H-System part being load rich will decelerate. If these frequency rise
ADIBI et al.: POWER SYSTEM CONTROLLED SEPARATION
1901
TABLE VIII APPARENT IMPEDANCE PATHS
Fig. 14. Out-of-step blocking.
Fig. 15. Transfer tripping. TABLE VII INITIAL OPERATING CONDITION FOR THE OUT-OF-STEP BLOCKING AND TRANSFER-TRIPPING CASE
and decay are not arrested by proper load shedding and load rejection, they could result in a blackout. However, as seen in Figs. 14 and 15, if the relays on e-f tie-line and g-h tie-line are blocked from operation and the tripping is transferred to e-g tie-line and f-h tie-line, the 640-bus interconnection separates into two balanced E-F and G-H parts. Table VIII lists results of simulations that are similar to Sections III-D, III-E, and III-F supporting three of the conjectures. IV. CONCLUDING REMARKS The purpose of this paper was to verify certain conjectures related to power system controlled separation. The five conjec-
tures outlined in Section I were verified for the loosely connected 50-bus system and for the tightly net 640-bus interconnection. In these two systems, the locations of out-of-step operations could be identified by simulation and were supported by field experience. The first conjecture is that the locations for out-of-step operation is highly system specific and determination of their locations is a critical step in application of controlled separation. The other four conjectures, however, are generally applicable. The 50-bus system is a dynamic equivalent of much larger power system. This system was selected for establishing the research procedure because in practice, it was prone to transient instability and uncontrolled separation. The 640-bus system also has been reduced for this paper using similar techniques. This system was selected because it had a history of preventing wide-area cascading in response to internal and external faults [1], [23], [24], [29]. Numerous simulation cases were conducted in an attempt to verify the five conjectures. Only eight cases in Sections III-Dto III-G and in Figs. 8–15 were selected to describe and illustrate the phenomena, including sequential operation (cascading) of out-of-step relays, the effect of out-ofstep blocking, location and duration of the initial faults, the power system load levels, and network configuration. In general, power system faults are cleared without occurrence of uncontrolled separation, yet it is noted that the great 1965 blackout was initiated with a reactance relay operation on a 230-kV transmission line, resulting in several uncontrolled islands [1]. In order to monitor the out-of-step operations in a large power system, such as the 640-bus interconnection, the relay characteristic and the apparent impedance representations had to be simplified. Without this innovation, it would have been difficult to conduct the study efficiently. It is recognized that after an initiating event, the rise and decay in system frequency are automatically arrested by a number of corrective and complementary actions, including load rejection, controlled separation, load shedding, and low-frequency isolation scheme, in that order. An IEEE survey shows that over 100 utilities are practicing one or more of these corrective
1902
actions with an average success rate of about 50%. This paper deals with one of such corrective actions—that of controlled separation—and it is an attempt to improve its success rate. The five conjectures were conceived on the basis of analysis of the past major power system disturbances and on the observations of the actual system instabilities. It is believed that the verification of these conjectures together with knowledge of the prevailing system topology and load condition would allow controlled separation of power systems. The proposed conjectures are controversial, but the results should be of interest, precisely because in the blackout of August 14, 2003, one of the questions raised was “Why the Blackout Stopped Where It Did” [31]. The same phenomenon can be noted in the 1965, 1967, and 1977 blackouts. ACKNOWLEDGMENT The first author would like to thank Potomac Electric Power Company for providing partial network, dynamic, and operational data. He also would like to thank Prof. V. Vittal of ASU, Prof. M. Pavella of University of Liege, Mr. C. Taylor of BPA, Mr. D. Milanicz, System Protection and Control (SP&C) of BG&E, and Mr. A. Depew, SP&C of Pepco, for the discussion held regarding the five conjectures. REFERENCES [1] Prevention of Power Failures U.S. Federal Power Commission, vol. I–III, U.S. Printing Office, 1967. [2] A. S. Shahnavaz et al., “A scheme for controlled islanding to prevent subsequent blackout,” IEEE Trans. Power Syst., vol. 18, no. 1, p. 136-13, February 2003. [3] H. Tsun-Yu et al., “Defense plan design in a longitudinal power system,” in Proc. 14th PSCC, Sevilla, Spain, Jun. 2002. [4] V. Vittal et al., “Determination of generator groupings for an islanding scheme in Manitoba hydro system using the method of normal form,” IEEE Trans. Power Syst., vol. 13, no. 4, pp. 1345–1351, Nov. 1998. [5] C. Counan et al., “Major incidents on the french electric system—potentiality and curative measure,” in Proc. IEEE Power Eng. Soc. Summer Meeting, Seattle, WA, 1992, (92SM432-5PWRS). [6] Islanding of Union Electric Co/ and Western Part of Illinois Power Co. Systems, 10:32 a.m., Feb. 13, 1978 Report to MAIN, Apr. 24, 1978. [7] V. Vittal et al., “Self-healing in power systems: an approach using islanding and rate of frequency decline-based load shedding,” IEEE Trans. Power Syst., vol. 18, no. 1, pp. 174–181, Feb. 2003. [8] Q. Zhao et al., “A study of system splitting strategies for island operation of power system: a two phase method based on OBDD,” IEEE Trans. Power Syst., vol. 18, no. 4, pp. 1556–1565, Nov. 2003. [9] K. Sun et al., “Splitting strategies for islanding operation of large-scale power system using OBDD-based methods,” IEEE Trans. Power Syst., vol. 18, no. 2, pp. 912–923, May 2003. [10] H. You et al., “Slow coherency based islanding,” IEEE Trans. Power Syst., vol. 19, no. 1, pp. 483–491, Feb. 2004. [11] ——, “Self-healing in power systems: an approach using islanding and rate of frequency decline-based load shedding,” IEEE Trans. Power Syst., vol. 18, no. 1, pp. 174–181, Feb. 2003. [12] IEEE Power System Relaying Committee WG K12, System Protection and Voltage Stability, 93 THO 596-7 PWR, 1993. [13] M. M. Adibi, “Power system protective relaying and simulation models,” in Proc IEEE Power Eng. Soc. PICA Conf., 1969. [14] M. M. Adibi and D. P. Milanicz, “Protective system issues during restoration,” IEEE Trans. Power Syst., vol. 10, no. 3, pp. 1492–1497, Aug. 1995. [15] A. Chang and M. M. Adibi, “Power system dynamic equivalents,” IEEE Trans. Power App. Syst., vol. PAS-89, no. 8, pp. 1737–1744, Nov./Dec. 1970. [16] M. M. Adibi et al., “Solution methods for transient and dynamic stability,” Proc. IEEE, vol. PROC-62, no. 7, pp. 951–958, Jul. 1974. [17] W. G. Tuel, Jr. and M. M. Adibi, “Some considerations of power system stability studies,” in Proc. IEEE PICA Conf., 1969. [18] C. W. Taylor et al., “A new out-of-step relay with rate of change of apparent resistance augmentation,” IEEE Trans. Power App. Syst., vol. PAS-102, no. 3, pp. 631–639, Mar. 1997.
IEEE TRANSACTIONS ON POWER SYSTEMS, VOL. 21, NO. 4, NOVEMBER 2006
[19] J. M. Haner et al., “Experience with the R-Rdot out-of-step relay,” IEEE Trans. Power Del., vol. 1, no. 2, pp. 342–348, Apr. 1986. [20] M. M. Adibi et al., “Frequency response of prime movers during restoration,” IEEE Trans. Power Syst., vol. 14, no. 2, pp. 751–756, May 1999. [21] J. R. Winkleman et al., “An analysis of inter-area dynamics of multimachine systems,” IEEE Trans. Power App. Syst., vol. PAS-100, pp. 754–763, Feb. 1981. [22] R. Podmore, “Identification of coherent generators for dynamic equivalents,” in IEEE PAS-97, 1978, pp. 1344–1354. [23] U.S. Department of Energy, Federal Energy Regulatory Commission, The Con Edison Power Failure of July 13 and 14, 1977, Final Staff Report, Jun. 1978. [24] J. Coleman et al., “System restoration: northeast blackout of Nov 9, 1965, PJM Blackout of June 5, 1967, and U.S.-Canada Blackout of Aug 14, 2003,” LLC Training, 2004. [25] M. M. Adibi and D. K. Thorne, “Local load shedding,” IEEE Trans. Power Syst., vol. 3, no. 3, pp. 1220–1229, Aug. 1988. [26] C. W. Taylor et al., “Northwest power pool transient stability and load shedding controls for generation-load imbalances,” IEEE Trans. Power App. Syst., vol. PAS-100, no. 7, pp. 3486–3495, Jul. 1981. [27] M. M. Adibi, “Load pickup & reserve distribution,” An Operator Guide, EPRI EP-P1663-C673, Dec. 2000. [28] H. B. Ross, “An AGC implementation for system islanding and restoration conditions,” IEEE Trans. Power Syst., vol. 9, no. 3, pp. 1399–1410, Aug. 1994. [29] The Con Edison Power Failure of July 13 and 14, 1977, U.S. Department of Energy, Federal Energy Regulatory Commission, U.S. Government Printing Office, Jun. 1978. [30] “EPRI-Extended Transient-Midterm Stability Program (ETMSP): Vol 3.1 Application Guide Rev. 1,” May 1994. [31] Final Report on the August 14, 2003 Blackout in the United States and Canada—Causes and Recommendations, p. 91, Blackout Final-web. pdf. M. M. Adibi (M’56–SM’72–F’95) received the B.Sc. degree in electrical engineering in 1950 from the University of Birmingham, Birmingham, U.K., and the M.E.E. degree in 1960 from Polytechnic Institute of Brooklyn, Brooklyn, NY. In 1967, as a Program Manager at IBM, he investigated the 1965 Northeast Blackout for the Department of Public Service of the State of New York, and in 1969 and following the PJM blackout of 1967, as an IBM Industry Consultant in the IBM Research Division, he investigated Bulk Power Security Assessment for Edison Electric Institute. Since 1979 and in the aftermath of the New York Blackout of 1977, he has chaired the Power System Restoration Working Group, publishing Power System Restoration—Methodologies & Implementation Strategies (Piscataway, NJ: IEEE/Wiley, 2000). Mr. Adibi is a Registered Professional Engineer in the state of Maryland. R. J. Kafka (M’73–SM’88–F’00) received the B.S. degree in physics from Regis College, Denver, CO, in 1970 and the M.S degree from Purdue University, West Lafayette, IN, in 1972. He has been employed by the Potomac Electric Power Company (Pepco) since 1973. He was assigned to Pepco’s system restoration study team in 1979, which produced one of the first formal power flow studies for a system restoration plan. He is Transmission Policy Manager of Pepco Holdings, Inc., Bethesda, MD. Mr. Kafka is a charter member of the Power System Restoration Working Group, Secretary of the Power System Operations Committee, and a Registered Professional Engineer in the state of Maryland. Sandeep Maram (S’05) was born in Hyderabad, India. He received the B.Eng. degree in electronics and communication engineering from Visveswariah Univerrsity, Belgaum, India, in 2004. He is currently pursuing the M.E.E. degree at Virginia Polytechnic Institute and State University, Blacksburg. Lamine M. Mili (SM’90) received the electrical engineering diploma from EPFL, Lausanne, Switzerland, in 1976, and the Ph.D. degree from the University of Liege, Liege, Belgium in 1987. He is a Professor of electrical and computer engineering at the ARI, Virginia Polytechnic Institute and State University. He recently organized a NSF workshop on the “Mitigation of the Vulnerability of Critical Infrastructures to Catastrophic Events.” Dr. Mili is the recipient of the NSF Research Initiation Award (1990) and the NSF Young Investigator Award (1992).