Aug 23, 2005 - The base line wandering, a low frequency fluctuation is due to the rhythmic ... heart rate. the SA node can be considered the heart's pacemaker.
K.D. Chinchkhede et al. / International Journal of Engineering Science and Technology (IJEST)
On the Implementation of FIR Filter with Various Windows for Enhancement of ECG signal K.D. CHINCHKHEDE * Department of Applied Electronics, SGBAU Amravati, (M.S.) India
GOVIND SHARAN YADAV Department of EXTC, GCOE Amravati, India, (M.S.) India
S.R HIREKHAN Department of EXTC, GCOE Amravati, India, (M.S.) India
D.R SOLANKE Department of Applied Electronics, SGBAU Amravati, (M.S.) India Abstract - Digital filters plays very significant role in the analysis of the low frequency components in ECG signal. Numbers of biomedical signals are of low frequency, the removal of baseline wander and power line interference is a very important step in the pre-processing stage of ECG. This paper deals with the study of FIR filtering of ECG signals under noisy condition. The performance of FIR filter is evaluated on several ECGs, by artificially adding white Gaussian noises to raw ECG recordings, and studying the SNR and morphology of the filter outputs. Power spectral density and spectrogram analysis reveals the further details of ECG. The correlation analysis at various noise (SNR) levels 1 to 50 dB clearly indicate that the FIR filter efficiently enhances raw ECG signal at 20dB or higher levels of noise. We find FIR filter with Kaiser window works excellent as compared to the Gaussian, Blackman and Blackman-Harris window based FIR filter.
Keywords- FIR digital filter, Kaiser Window, PSD, spectrogram, correlation, signals to noise ratio (SNR). I. INTRODUCTION The electrocardiogram (ECG) is non-stationary electrical signals from the heart characteristically precede the normal mechanical function and monitoring of these signals has great clinical significance. The denoise ECG are utilized by Cardiologist readily interprets the ECG waveforms and classifies them into normal and abnormal patterns. The ECG signal consist of six continuous electromagnetic peaks namely PQRST and U .the P wave represent depolarization and contraction of atria .the QRS complex wave represent depolarization and contraction of ventricles and the T wave corresponds to the repolarisation of ventricles . The repolarisation of atria is not recorded on the reading of ECG, While acquisition of ECG, it gets corrupted due to different types of artifacts and interferences such as Power line interference, Electrode contact noise, Motion artifacts, Muscle contraction, Base line drift, Instrumentation noise generated by electronic devices and Electrosurgical noise. For the meaningful and accurate detection, steps have to be taken to filter out all these noise sources. The EMG is high frequency fluctuation is due to the random depolarization and contraction of cardiac muscles; while abrupt transitions are due to random moment of the body. The base line wandering, a low frequency fluctuation is due to the rhythmic depolarization and repolarisation during respiration [7][8].The heart consists of two major smooth muscles, the atrium, and the ventricle which form the synoatrial cells, that conducts depolarization from one cell to the next cell. The synoatrial (SA) node beats at a rate of 70 to 80 beats per minute (bpm) at rest. The antrioventricular (AV) node beats at 40 to 60 bpm and the bundle branch oscillate at 15 to 40 bpm. The SA node, normally determines the heart rate. the SA node can be considered the heart’s pacemaker. The depolarization of the SA node spreads throughout the atrium and reaches the AV node in about 40ms. Because of the low conduction velocity of the AV node tissue, it requires about110ms for the depolarization to reach the bundle branches called the Purkinje system. The contraction period of the heart is called systole. The action potentials in the ventricle
ISSN : 0975-5462
Vol. 3 No. 3 March 2011
2031
K.D. Chinchkhede et al. / International Journal of Engineering Science and Technology (IJEST)
hold for 200 - 250ms. This relatively long time allows the ventricular contraction to empty blood into the arteries. The heart then re-polarizes during the rest period, called diastole, and then the cycle repeats. Figure1 below shows basic electrocardiogram.
Figure1. Basic Electrocardiogram
II.
DATASET
The dataset used in this study is obtained from physio-Bank entitled “MIT-BIH Arrhythmia Database”[18] available on-line. The source of the ECGs included in the MIT-BIH Arrhythmia Database is a set of over 4000 long-term Holter recordings that were obtained by the Beth Israel Hospital Arrhythmia Laboratory between 1975 and 1979. Approximately 60% of these recordings were obtained from inpatients. The database contains 23 records (numbered from 100 to 124 inclusive with some numbers missing such as 110,120) chosen at random from this set, and 25 records (numbered from 200 to 234 inclusive, again with some numbers missing such as 204, 206, 211, 216, 218, 224, 225, 226, 227, 229) selected from the same set to include a variety of rare but clinically important phenomena that would not be well-represented by a small random sample of Holter recordings. Each of the 48 records is slightly over 30 minutes long. The first group is intended to serve as a representative sample of the variety of waveforms and artifact that an arrhythmia detector might encounter in routine clinical use. The second group were chosen to include complex ventricular, junctional, and supraventricular arrhythmias and conduction abnormalities. The subjects were 25 men aged 32 to 89 years, and 22 women aged 23 to 89 years. In most records, the upper signal is a modified limb lead II (MLII), obtained by placing the electrodes on the chest. The lower signal is usually a modified lead V1. The original analog recordings were made using nine Del Mar Avionics model 445 two-channel recorders. The analog outputs of the playback unit were filtered to limit analog-to-digital converter (ADC) saturation and for anti-aliasing, using a passband from 0.1 to 100 Hz relative to real time. ADCs were unipolar, with 11-bit resolution over a ±5 mV range. Sample values thus range from 0 to 2047 inclusive, with a value of 1024 corresponding to zero volts. The bandpass-filtered signals were digitized at 360 Hz per signal relative to real time using hardware constructed at the MIT Biomedical Engineering Center and at the BIH Biomedical Engineering Laboratory. The sampling frequency was chosen to facilitate implementations of 60 Hz (mains frequency) digital notch filters in arrhythmia detectors. Since the recorders were battery-powered, most of the 60 Hz noise present in the database arose during playback. In those records that were digitized at twice real time, this noise appears at 30 Hz (and multiples of 30 Hz) relative to real time. In our study we selected four records (100, 101, 102 and103), we called it as raw ECG signals. III. DIGITAL FIR
FILTER
FIR filters are widely used due to the powerful design algorithms that exist for them, their inherent stability when implement in non-recursive form, the ease with which one can attain linear phase, their simple extensibility to multirate cases, and the ample hardware support that exists for them among other reasons. In order to determine a suitable filter order, it is necessary to specify the amount of passband ripple and stopband attenuation that will be tolerated. It is also necessary to specify the width of the transition region around the ideal cutoff frequency. The latter is done by setting the passband edge frequency and the stopband edge
ISSN : 0975-5462
Vol. 3 No. 3 March 2011
2032
K.D. Chinchkhede et al. / International Journal of Engineering Science and Technology (IJEST)
frequency. the difference between the two determines the transition width. Next section provides the brief introduction of different window used in analysis. A. Windows use in design i. Kaiser Window To obtain a Kaiser [12] window that designs an FIR filter with side lobe attenuation of dB, Kaiser window parameter that affects the side lobe attenuation of the Fourier transform of the window is given by 0.1102 8.7 , 50 0.4 0.582 21 0.07886 21 , 21 50......................................................................(1) 0, 21 Where 20 log10 is the stop band attenuation expressed in decibels. Increasing widens the main lobe and decreases the amplitude of the side lobes (i.e., increases the attenuation). Filter order for FIR filter is given by
N
8
2 .2 8 5
1 ..............................................................( 2 )
Here N is the filter order and is the width of the smallest transition region. ii. Blackman window The equation for computing the coefficients of a Blackman [13] window is n n (n) 0.42 0.5cos 2 0.08cos 4 ,0 n N ......................................................................(3) N N The window length L N 1 Blackman windows have slightly wider central lobes and less sideband leakage than equivalent length Hamming and Hann windows. iii. Blackman Harris window The equation for computing the coefficients of a minimum 4-term Blackman-Harris window [14] is 2 2 2 (n) a0 a1 cos n a2 cos 2n a3 cos 3n N N N Where
N N n and the window length is L N 1 , the coefficients for this window are 2 2
a0 = 0.35875, a1 = 0.48829, a2 = 0.14128, a3 = 0.01168 i. Gaussian Window The coefficients of a Gaussian window [15][16] are computed from the following equation.
1 n 2 N 2
2
w (n ) e ....................................................................( 5 ) N N n , and 2 the window length is L N 1 Where is the reciprocal of the Where 2 2
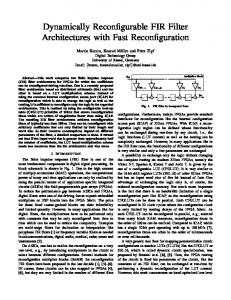
standard deviation. The width of the window is inversely related to the value of ; a larger values of produces a narrower window. The fig. 2(a) shows time domain representation of windows, fig. 2(b) shows spectrum of the various windows ( #1-Kaiser,#2-Gaussian,#3-Blackman and #4-Blackman-Haris).
ISSN : 0975-5462
Vol. 3 No. 3 March 2011
2033
K.D. Chinchkhede et al. / International Journal of Engineering Science and Technology (IJEST)
Time domain
Frequency domain
1
0 -20 Normalized Magnitude (dB)
Amplitude
0.8
0.6
0.4
-40 -60 -80 -100 w indow #1 -120
w indow #2 w indow #3
-140
w indow #4
0.2
-160
0
20
40
60
80 100 Time (ms)
120
140
0
160
10
Figure 2 (a) time domain spectrum
1
10 Frequency (Hz)
2
10
Figure 2(b) frequency domain spectrum
B. Performance Measure i. Correlation The enhanced ECG signal is compared with original ECG signal, to verify the degree of mismatch. The correlation coefficient, measures the degree to which two variable's movements are associated. The correlation coefficient will vary from -1 to +1. Coefficient value of -1 indicates perfect negative correlation, and +1 indicates perfect positive correlation. The correlation is the average product of the standard scores for the cases on two variables, and since the standard deviation of standardized data is 1. The correlation coefficient matrix represents the normalized measure of the strength of linear relationship between variables [17]. The correlation coefficient rX ,Y between two random variables X and Y with expected values X and Y and standard deviations
X
and
Y
is their covariance normalized by their standard deviations, as follows
cov X , Y
rX ,Y
XY
E X X Y Y
XY
..........................................................................(6)
E is the expected value operator and cov means covariance. Since X E X , X 2 E X 2 E2 X likewise for Y , rX ,Y is also
Where
E ( XY ) E ( X ) E (Y )
rX ,Y
E ( X ) E 2 ( X ) E (Y 2 ) E 2 (Y ) 2
..............................................................................(7)
The correlation is defined only if both of the standard deviations are finite and both of them are nonzero. For time series, correlation coefficients rk are given by: N
rk
x x x t 1
t k
t
N
x x t 1
x
2
t
Where xt is a data value at time step t , k is the lag, and the overall mean is given by:
x
N
t 1
xt ..........................................................................................( 9 ) N
ISSN : 0975-5462
Vol. 3 No. 3 March 2011
2034
K.D. Chinchkhede et al. / International Journal of Engineering Science and Technology (IJEST)
ii. Output SNR The efficiency of FIR filter based de-noising is measured by evaluating SNR of enhanced ECG signal, the SNR0 of denoised ECG signal is given by [19] xorg2 ...................................................................................................... 10 SNR0 10log10 2 x x org est
In which xorg is raw ECG signal and xest is enhanced or filtered ECG signal
IV. EXEPERIMENTAL SETUP We have selected the raw ECG records of four subjects 100m, 101m, 102m and103m, each having 9000 samples per record. The experimental setup is divided into two parts, in part I, ECG signals were processed by designed FIR bandpass filters to remove the baseline wondering and power line interference. In part II, same ECG signals were subjected to white Gaussian noise at various SNR levels from 1dB to 50dB. The performance of designed FIR bandpass filters was studied in respect to the enhancement of ECG. The optimal FIR bandpass filter with Kaiser, Gaussian, Blackman and Blackman-Harris window at sampling frequency 360Hz have been designed. The filter passband was set at 3-55Hz, the transition bandwidths are (0.1 to 3Hz) on lower side and (56 to 58.9Hz) on upper side, the pass band attenuation of 0.01dB and stop band attenuation of 80 dB was selected. With these specifications, the minimum filter order for Kaiser window was 623. The MATLAB version 7.6.0, 2008a with signal processing and FDA toolbox was used for the design of FIR filters. The Magnitude and Phase response, impulse response and pole zero plot of the filter with Kaiser Window (order 623) shown in Figure 3(a), 3(b), 3(c), respectively. Finally the correlation coefficient is calculated using equation (6), to indicate the degree of mismatch between raw and enhanced ECG. Impulse Response
7.423
1
0.25
-47.0694
-40
-101.56
-60
-156.054
-80
-210.54
-100
-265.03
-120
-319.53
0.2
0.5 Imaginary Part
-20
Amplitude
Magnitude (dB)
0
Pole/Zero Plot
0.3
Magnitude (dB) and Phase Responses
0.15 0.1 0.05
623
0
-0.5
0 -0.05
0
50
100 Frequency (Hz)
(a)
150
-1
0
0.5
1 Time (seconds)
(b)
1.5
-1
-0.5
0 Real Part
0.5
1
(c)
Figure3. (a) Magnitude and phase response (b) Impulse response (c) Pole –zero plots
ISSN : 0975-5462
Vol. 3 No. 3 March 2011
2035
K.D. Chinchkhede et al. / International Journal of Engineering Science and Technology (IJEST)
V. RESULTS
AND DISCUSSION
ECG records of four subjects (100m, 101m, 102m and 103m) are shown in figure4. RAW ECG SIGNALS
mV
2
Welch Power Spectral Density Estimate of raw ECG
0 -2
0
1000
2000
3000
4000
5000
6000
7000
8000
a
-10
9000
-20
b
0 -2
0
1000
2000
3000
4000
5000
6000
7000
8000
9000
mV
1 c
0 -1
0
1000
2000
3000
4000
5000
6000
7000
8000
9000
Power/frequency (dB/Hz)
mV
2
Low Freq. Baseline Wondering
-30 60 Hz Power Line Interfrence 100m
-40
101m -50
102m
mV
2
-2
0
1000
2000
3000
4000 5000 Samples
6000
7000
8000
103m
-60
d
0
-70
9000
0
20
40
60
80 100 120 Frequency (Hz)
140
160
180
Figure 5 PSD Estimate of raw ECG signals.
Figure 4. Raw ECG (a) 100m, (b) 101m, (c) 102m (c) 103m
The time domain view of ECG signal reveals the presence of low frequency base line wondering, which is confirmed by power spectral density estimate as shown in fig.5. The PSD also indicates the power line interference at 60Hz as well as low frequency artifacts. This provides the motivation to design and study the different FIR filters to remove these noise and artifacts. Further the Spectrogram analysis was carried for ECG signal, to analyze the energy distribution at various frequency bands. Figure 6 shows the spectrogram of ECG (100m), the spectrogram indicates the localization energy in low frequency bands from 0 to 70Hz. In fig.6 the presence of 60Hz power line interference and very low frequency base line wondering is visible. In part I, the dataset (raw ECG) was passed through bandpass FIR filter with various windows. Table I indicates average power of raw ECG before and after filtering. From Table I, it clearly indicate that the average signal power of enhanced ECG signal with Kaiser window based FIR filter for each subject is slightly greater. Signal to noise ratio of filtered signal for four subject are calculated as shown in Table II. Thus FIR filter with Kaiser window performs excelent with others The result of FIR filtering is shown in Figure 7. Results shown in fig.7 clearly show removal of baseline wondering, similar results were obtained for all subjects in the database. Spectrogram of Raw ECG (100m)
2 mV
180
-2
160
a
0 0
1000
2000
3000
4000
5000
6000
7000
8000
9000
2 mV
140
0
1000
2000
3000
4000
5000
6000
7000
8000
9000
2
Presence of Base Line wodering
mV
100
60 Hz Power Line Interference
80
c
0 -2
0
1000
2000
3000
4000
5000
6000
7000
8000
9000
2
60
mV
Frequency (Hz)
120
b
0 -2
40
0
1000
2000
3000
4000
5000
6000
7000
8000
9000
2 mV
20 0
d
0 -2
5
10
15
20
25
e
0 -2
0
1000
Time
Figure 6. Spectrogram of first subject(100m)
ISSN : 0975-5462
2000
3000
4000 5000 Samples
6000
7000
8000
9000
Figure 7 (a) Raw ECG signal (b) ECG Filtered with Kaiser window (b) with Gaussian window (c) with Blackman window (d) with Blackman Harris.
Vol. 3 No. 3 March 2011
2036
K.D. Chinchkhede et al. / International Journal of Engineering Science and Technology (IJEST)
TABLE I Average power before and after filtering in dB
TABLE II Signal to noise ratio after filtreing
Avg. Power After FIR Filtering (dB)
ECG Signals
Avg. Power of ECG
Kaiser
Gauss
B'man
B'Harris
100m
-7.83
-15.48
-15.65
-15.70
101m
-9.06
-13.63
-14.06
102m
-9.92
-15.66
-16.70
103m
-8.60
-10.10
-10.18
-10.44
SNR After FIR Filtering (dB)
ECG Signals
Kaiser
Gauss
B'man
B'Harris
-15.70
100m
0.8172
0.5264
0.7699
0.7706
-14.23
-14.26
101m
1.8778
1.3658
1.6636
1.675
-17.20
-17.27
102m
1.3716
0.693
1.0447
1.0658
-10.48
103m
5.3182
4.5669
4.8858
4.8948
Further the PSD and Spectrogram analysis was carried out for filtered ECG signal, to analyze the energy distribution at various frequency bands. The results are plotted in Figure 8 and Figure 9 respectively. The PSD of filtered ECG approximates closely with Magnitude response of Bandpass filter shown in fig.3, the spectrogram indicates the removal of base line wondering and 60Hz interference. Spectrogram of Filtered Raw ECG (100m) 180
Welch Power Spectral Density Estimate of Filtered ECG -20 100m
160
101m
140
102m
-60
120
Removal of Low Freq. Baseline Wondering
103m
-80
Frequency (Hz)
Power/frequency (dB/Hz)
-40
-100 Removal of 60 Hz Power Line Interfrence -120
100 80 60
-140
40
-160
20
-180
0 0
20
40
60
80 100 120 Frequency (Hz)
140
160
180
5
10
15
20
Time
Figure 8. PSD of filtered ECG signal of all 4 subject
Figure 9. Spectrogram of filtered ECG signal of subject (100m)
In part II of experiment raw ECG signals were subjected with white Gaussian noise at different SNR levels from 1dB to 50dB, which results in set of 50 noisy ECG signals for each subject. Each set is passed through the FIR filter; the result of processing is shown in figure 10, which shows noisy ECG of one subject at SNR level of 10 dB, figure 10(b) to10 (e) represents de-noised signals from the output of FIR filter with Kaiser, Gaussian, Blackman and Blackman-Harris window respectively. The PSD estimate of noisy ECG is plotted in figure 11, it is apparent from PSD estimates shown in figure 5 and11, the noise has superimposed on raw ECG, masking important feature of ECG including 60Hz electrical interference. The FIR filtering of noisy ECG not only removes power line interference but also reduced the effect of noise as visible in figure10 (b) to (e). The spectrogram shown in figure 12 confirms the removal of power line interference and high frequency noise.
ISSN : 0975-5462
Vol. 3 No. 3 March 2011
2037
K.D. Chinchkhede et al. / International Journal of Engineering Science and Technology (IJEST)
Welch Power Spectral Density Estimate of Noisy ECG (SNR=10dB) -10
Noisy ECG 100m (SNR=10dB) and Filtered ECG mV
2 a
0 -2
100m 101m 102m 103m
-15 0
1000
2000
3000
4000
5000
6000
7000
8000
9000 b
0 -2
0
1000
2000
3000
4000
5000
6000
7000
8000
9000
mV
2 c
0 -2
0
1000
2000
3000
4000
5000
6000
7000
8000
9000
mV
2 d
0 -2
0
1000
2000
3000
4000
5000
6000
7000
8000
Power/frequency (dB/Hz)
mV
2
9000
mV
-25
-30
-35
-40
2 e
0 -2
-20
-45 0
1000
2000
3000
4000 5000 Samples
6000
7000
8000
9000
0
Figure 10. 100 m (a) noisy ECG signals at 10dB (b) Filtered with Kaiser Window (c) with Gaussian window (d) with Blackman window (e) with Blackman Haris.
20
40
60
80 100 120 Frequency (Hz)
140
160
180
Figure 11. PSD of Noisy ECG signal of all 4 subject
Spectrogtram of Filtered Noisy ECG 100m (SNR=10dB)
Welch Power Spectral Density Estimate of Filtered Noisy ECG (SNR=10dB) -20
180 160
100m -40
140 Power/frequency (dB/Hz)
101m
Frequency (Hz)
120 100 80 60
-60 102m -80
103m
-100
-120
40 -140
20 0
5
10
15
20
-160
0
20
Time
Figure 12. Spectrogram of filtered Noisy ECG 100m (SNR=10dB)
40
60
80 100 120 Frequency (Hz)
140
160
180
Figure 13. PSD of filtered Noisy ECG signal of all 4 subjects
It is evident from spectrogram that high frequency region (30Hz to 55Hz) is still corrupted by noise. The TABLE III represents the SNR of FIR filtered noisy ECG with respect to raw ECG and TABLE IV tabulated the result of filtering the noisy ECG with respect to filtered raw ECG. Finally the PSD of filtered noisy ECG is calculated and shown in figure 12. Its frequency response is also similar to magnitude response of FIR filter shown in figure3, from TABLE III and TABLE IV , it is evident that Kaiser window based FIR filter works excellent in comparison with others window. As mentioned earlier each subject has set of 50 noisy signals which are passed through FIR filter with four windows, which results in collection of 200 de-noised ECG. We have calculated SNR of each de-noised ECG and plotted as shown in Figure 13 and 14 respectively
ISSN : 0975-5462
Vol. 3 No. 3 March 2011
2038
K.D. Chinchkhede et al. / International Journal of Engineering Science and Technology (IJEST)
TABLE III SNR of Enhanced ECG with respect to raw ECG
Noise Level(dB) 5
TABLE IV SNR of Enhanced ECG with respect to Filtered ECG
SNR of FIR Filtered Noisy Signal (100 m) Kaiser
Gauss
B'man
B'Haris
Noise Level(dB)
-0.2392
-0.4854
-0.2928
-0.2919
SNR of FIR Filtered Noisy Signal (100m) Kaiser
Gauss
B'man
B'Haris
5
0.9881
0.7419
0.9345
0.9354
0.8866
0.6133
0.8373
0.8379
10
0.4522
0.179
0.4029
0.4036
10
15
0.6971
0.4127
0.6492
0.6499
15
0.8437
0.5594
0.7959
0.7965
20
0.7781
0.4897
0.7307
0.7313
20
0.8276
0.5392
0.7802
0.7809
0.8216
0.5317
0.7743
0.7749 0.7726
25
0.8044
0.5145
0.7571
0.7577
25
30
0.8129
0.5225
0.7656
0.7663
30
0.8192
0.5288
0.7719
35
0.8157
0.5251
0.7684
0.7691
35
0.8182
0.5276
0.7709
0.7716
0.8177
0.527
0.7704
0.7711
40
0.8167
0.526
0.7693
0.7701
40
45
0.817
0.5263
0.7697
0.7704
45
0.8175
0.5267
0.7702
0.7709
50
0.8171
0.5264
0.7698
0.7705
50
0.8174
0.5266
0.77
0.7708
Figure 13 shows the variation of SNR of filtered noisy ECG with raw ECG and Figure 14 shows the similar result for filtered noisy ECG with filtered raw ECG.
Variation in SNR of Filtered ECG (100m)
Variation in SNR of Filtered ECG (100m)
1.3
1
1.2
0.5 Output SNR (dB)
Output SNR (dB)
1.1 1 0.9 0.8 0.7
0 -0.5 -1 -1.5
0.6 -2 60
0.5 60
B'Haris
40 Adde d No ise (d B)
40
B'man 20
Gauss 0
Kais
Adde d No ise (d B)
B'Haris B'man
20 0
Gauss Kais
Figure 13 Variation of SNR of filtered noisy ECG with raw ECG. Figure 14 Variation of SNR of filtered noisy ECG with filtered raw ECG.
The final step was to carry out correlation analysis to measure the degree of mismatch between raw ECG and filtered ECG. The correlation coefficient (R) is determined using equation (6) for all subjects under noisy conditions is shown in figure 15. It is evident from plot, that FIR filter efficiently enhances raw ECG signal at 20dB or higher levels of noise.
ISSN : 0975-5462
Vol. 3 No. 3 March 2011
2039
K.D. Chinchkhede et al. / International Journal of Engineering Science and Technology (IJEST)
Comparision of Filtered raw ECG with Filtered Noisy ECG 1 0.95 100m
Correlation Coefficient (R)
0.9
101m 0.85
102m 103m
0.8 0.75
Kaiser window based FIR Filter
0.7 0.65
0
10
1
10 Noise Level (dB)
2
10
Figure 15 Correlation Coefficient (R) of Filtered raw ECG with Filtered Noisy ECG of all Subjects
VI. CONCLUSION In this paper we have investigated the improvement of raw and noisy ECG signals by various window based FIR filters. The PSD and spectrogram analysis was carried out to study the effect of noise on ECG. In order to measure the performance of de-noising, SNR of processed ECG is calculated and correlation coefficient was determined to find the degree of mismatch between raw ECG and filtered noisy ECG. The designed FIR filter with Kaiser window works excellent in removing baseline wandering and power line interference under different noisy conditions. REFERENCES [1] [2] [3]
[4] [5]
[6] [7]
[8] [9] [10] [11] [12] [13] [14] [15] [16] [17] [18] [19]
S.Pooranchandra, N.Kumaravel, ‘A novel method for Elimination of power line frequency in ECG signal using hyper shrinkage function’, Digital Signal Processing, Volume18, Issue 2, March 2008, pp. 116-126. Alireza K Ziarani, Adaibert Konrad, ‘Non linear Adaptive method of elimination of power line interference in EC signals’, IEEE Transactions on Biomedical Engg, Vol.49 No.6, June 2002, pp. 540-544. Santpal Singh Dhillon, Saswat Chakrabarti, ‘Power Line Interference removal From Electrocardiogram Using Simplified Lattice Based Adaptive IIR Notch Filter’, Proceedings of the 23rd Annual EMBS International conference, October 25-28, Istanbul, Turkey, 2001 pp.3407-12 Mahesh S.Chavan, R.A.Aggarwala, M.D.Uplane, ‘Interference reduction in ECG using digital FIR filters based on Rectangular window’, WSEAS Transactions on Signal Processing, Issue 5, Volume 4, May 2008, pp.340-49. Chavdar Levkov, Georgy Mihov, Ratcho Ivanov, IvanDaskalov, Ivaylo Christov, and Ivan Dotsinsky, ‘Removal of power line interference from the ECG a subtraction Procedure’, Biomed Eng Online, 2005;4;50, published online 2005 August 23 doi: 10.1186/1475-925X-4-50. LIN Yue-Der, YU HEN HU, ‘Power-Line Interference Detection and Suppression in ECG Signal Processing’, IEEE Transactions on Biomedical Engineering ISSN 0018-9294,2008, vol. 55, pp. 354-357. R. McCraty, M. Atkinson, D. Tomasino, W.Tiller, “The Electricity of Touch: Detection and measurement of cardiac energy exchange between people,” In:K.H. Pribram, ed. Brain and Values: Is a Biological Science of Values Possible. Mahwah, NJ: Lawrence Erlbaum Associates, Publishers, 1998: 359-379. R. McCraty, “The Energetic Heart: Bioelectromagnetic Communication Within and Between People,” Chapter published in: Clinical Applications of Bioelectromagnetic Medicine, edited by Rosch P J and Markov M S. New York: Marcel Dekker: 541-562, 2004. Marques.De.Sa.J.P. 1982 “Digital FIR filtering for removel of baseline wonder,” Journal of Clinical Engineering vol. pp. 235-240 Yi-Sheng, Zhu,et al. “P-wave detection by an adaptive QRS-T cancellation technique”.1987 IEEE. Suppappola S, Sun Y, “Automated performance evaluation of real-time QRS-detection devices”, Biomed Instrum Technol. 1995 JanFeb;29(1):41-9 Kaiser, J.F., "Nonrecursive Digital Filter Design Using the I0- sinh Window Function," Proc. 1974 IEEE® Symp. Circuits and Systems, (April 1974), pp.20-23. Oppenheim, A.V., and R.W. Schafer. Discrete-Time Signal Processing. Upper Saddle River, NJ: Prentice-Hall, 1999, pp. 468-471. Harris, F. J. "On the Use of Windows for Harmonic Analysis with the Discrete Fourier Transform." Proceedings of the IEEE®. Vol. 66 (January 1978). pp. 51-84. Harris, F.J. "On the Use of Windows for Harmonic Analysis with the Discrete Fourier Transform." Proceedings of the IEEE®. Vol. 66, No. 1 (January 1978). Roberts, Richard A., and C.T. Mullis. Digital Signal Processing. Reading, MA: Addison-Wesley, 1987, pp. 135-136. Quinn, G.P .and Keough ,M.J. ,Experimental Design and Data Analysis for Biologists Cambridge University Press, Cambridge,2002. http://www.physionet.org/cgi-bin/atm/ATM “MIT-BIH Arrhythmia Database” Mikhled Alfaouri and Khaled Daqrouq, “ECG signal denoising by wavelet transform thresholding,” American journal of Applied Sciences, vol. 5(3), pp.276-281, 2008
ISSN : 0975-5462
Vol. 3 No. 3 March 2011
2040